
|
|||||
|
 | |
| |
| |
| |
| |
| |
|
Gene: SGTB |
Gene summary for SGTB |
| Gene information | Species | Human | Gene symbol | SGTB | Gene ID | 54557 |
| Gene name | small glutamine rich tetratricopeptide repeat co-chaperone beta | |
| Gene Alias | SGT2 | |
| Cytomap | 5q12.3 | |
| Gene Type | protein-coding | GO ID | GO:0006457 | UniProtAcc | Q96EQ0 |
Top |
Malignant transformation analysis |
| Identification of the aberrant gene expression in precancerous and cancerous lesions by comparing the gene expression of stem-like cells in diseased tissues with normal stem cells |
| Entrez ID | Symbol | Replicates | Species | Organ | Tissue | Adj P-value | Log2FC | Malignancy |
| 54557 | SGTB | LZE4T | Human | Esophagus | ESCC | 4.64e-03 | 1.51e-01 | 0.0811 |
| 54557 | SGTB | LZE24T | Human | Esophagus | ESCC | 1.96e-03 | 1.49e-01 | 0.0596 |
| 54557 | SGTB | LZE6T | Human | Esophagus | ESCC | 4.77e-03 | 1.98e-01 | 0.0845 |
| 54557 | SGTB | P2T-E | Human | Esophagus | ESCC | 3.26e-08 | 1.51e-01 | 0.1177 |
| 54557 | SGTB | P4T-E | Human | Esophagus | ESCC | 2.57e-06 | 1.88e-01 | 0.1323 |
| 54557 | SGTB | P9T-E | Human | Esophagus | ESCC | 5.36e-09 | 2.00e-01 | 0.1131 |
| 54557 | SGTB | P12T-E | Human | Esophagus | ESCC | 4.38e-05 | 1.85e-01 | 0.1122 |
| 54557 | SGTB | P15T-E | Human | Esophagus | ESCC | 1.96e-04 | 1.13e-01 | 0.1149 |
| 54557 | SGTB | P16T-E | Human | Esophagus | ESCC | 2.46e-06 | 8.59e-02 | 0.1153 |
| 54557 | SGTB | P20T-E | Human | Esophagus | ESCC | 6.33e-07 | 1.25e-01 | 0.1124 |
| 54557 | SGTB | P21T-E | Human | Esophagus | ESCC | 8.49e-06 | 1.61e-01 | 0.1617 |
| 54557 | SGTB | P22T-E | Human | Esophagus | ESCC | 1.72e-03 | 1.31e-01 | 0.1236 |
| 54557 | SGTB | P24T-E | Human | Esophagus | ESCC | 8.03e-04 | 8.07e-02 | 0.1287 |
| 54557 | SGTB | P26T-E | Human | Esophagus | ESCC | 1.38e-06 | 2.22e-01 | 0.1276 |
| 54557 | SGTB | P27T-E | Human | Esophagus | ESCC | 6.77e-05 | 1.33e-01 | 0.1055 |
| 54557 | SGTB | P28T-E | Human | Esophagus | ESCC | 1.33e-02 | 1.14e-01 | 0.1149 |
| 54557 | SGTB | P30T-E | Human | Esophagus | ESCC | 8.76e-06 | 2.46e-01 | 0.137 |
| 54557 | SGTB | P31T-E | Human | Esophagus | ESCC | 2.83e-03 | 6.66e-02 | 0.1251 |
| 54557 | SGTB | P32T-E | Human | Esophagus | ESCC | 4.96e-10 | 2.51e-01 | 0.1666 |
| 54557 | SGTB | P36T-E | Human | Esophagus | ESCC | 2.70e-02 | 1.47e-01 | 0.1187 |
| Page: 1 2 3 |
| Tissue | Expression Dynamics | Abbreviation |
| Esophagus | 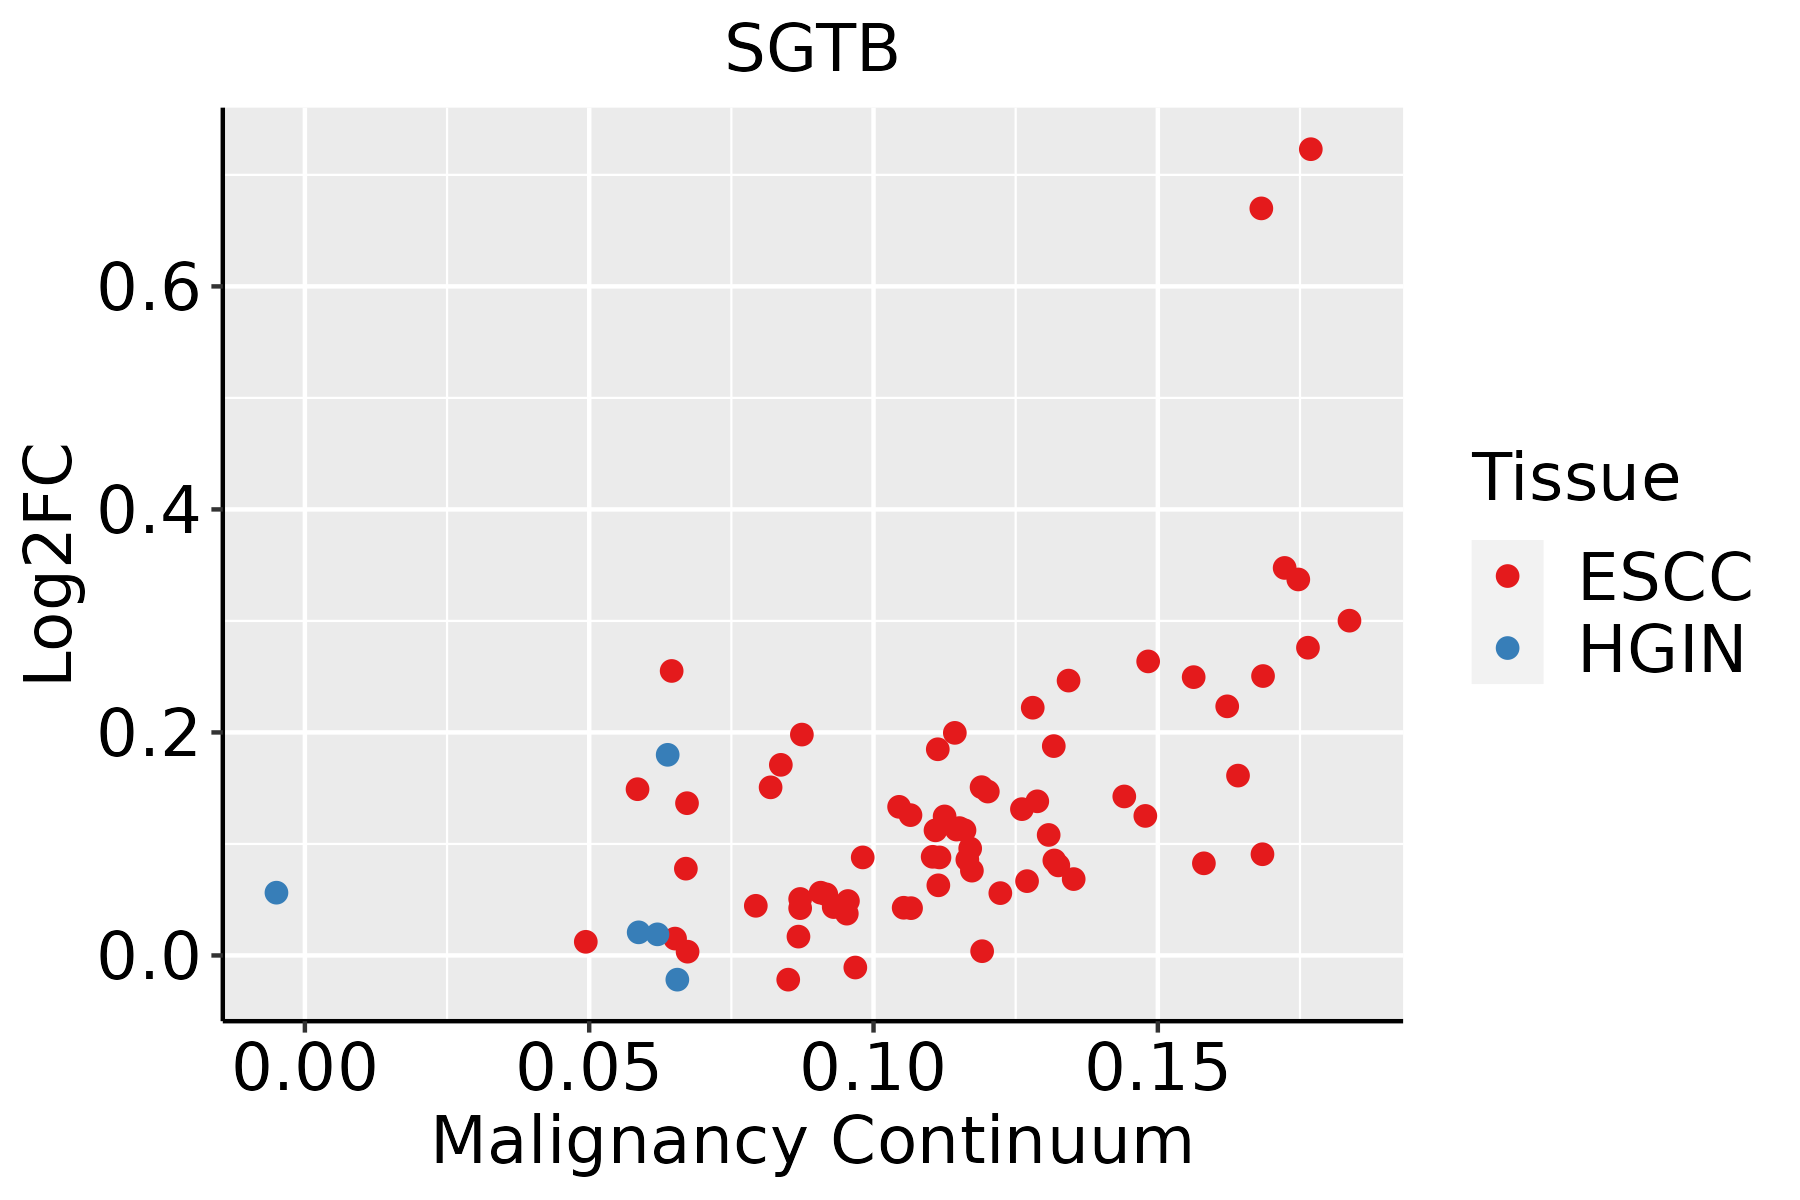 | ESCC: Esophageal squamous cell carcinoma |
| HGIN: High-grade intraepithelial neoplasias | ||
| LGIN: Low-grade intraepithelial neoplasias | ||
| Liver | 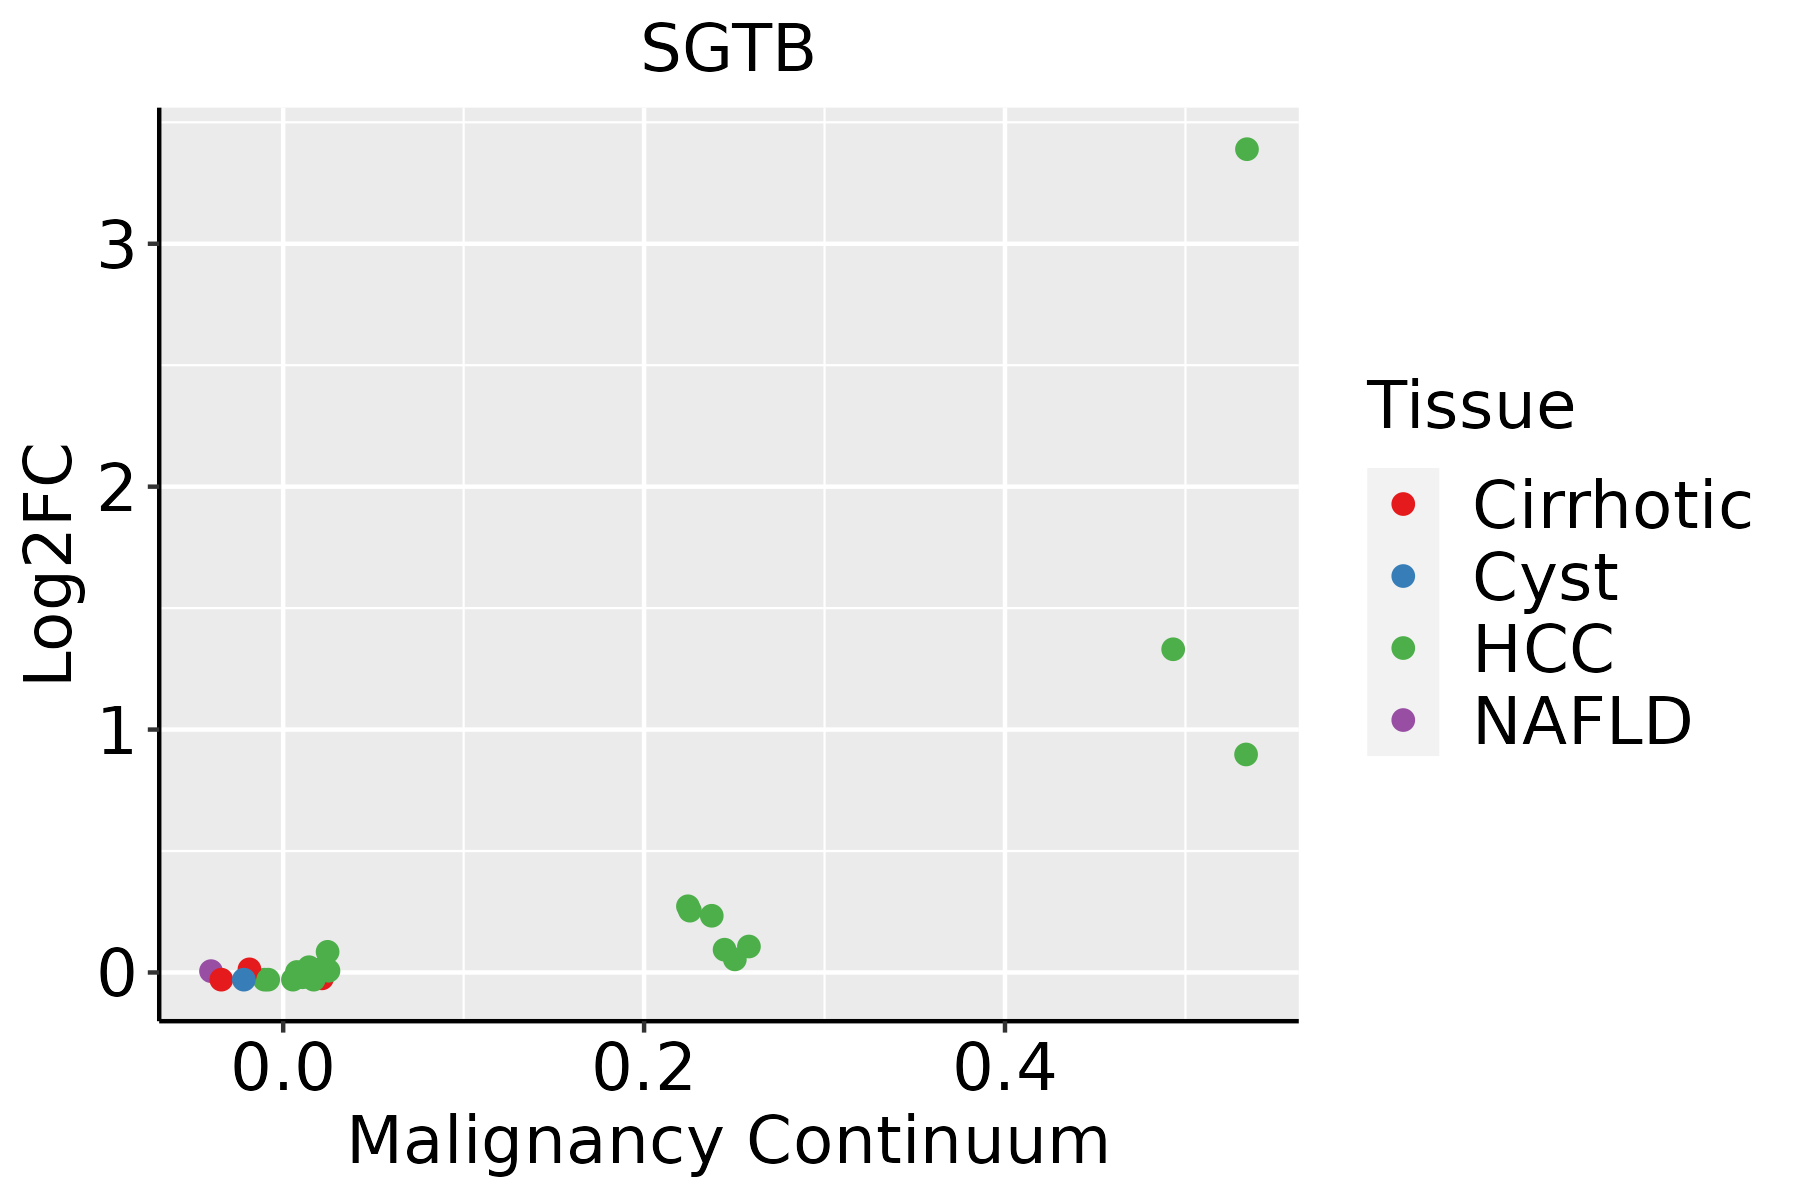 | HCC: Hepatocellular carcinoma |
| NAFLD: Non-alcoholic fatty liver disease | ||
| Thyroid |  | ATC: Anaplastic thyroid cancer |
| HT: Hashimoto's thyroiditis | ||
| PTC: Papillary thyroid cancer |
| ∗log2FC in expression of this searched gene in stem-like cells from each diseased tissue sample relative to stem-like cells in normal samples in each tissue plotted against the malignancy continuum. Samples are colored based on if they are from different disease stage. |
Top |
Malignant transformation related pathway analysis |
| Find out the enriched GO biological processes and KEGG pathways involved in transition from healthy to precancer to cancer |
| Tissue | Disease Stage | Enriched GO biological Processes |
| Colorectum | AD |  |
| Colorectum | SER |  |
| Colorectum | MSS |  |
| Colorectum | MSI-H |  |
| Colorectum | FAP |  |
| ∗Top 15 enriched GO BP terms are showed in the bar plot of each disease state in each tissue. Each row represents a significant GO biological process which is colored according to the -log10(p.adjust). |
| Page: 1 2 3 4 5 6 7 8 9 |
| GO ID | Tissue | Disease Stage | Description | Gene Ratio | Bg Ratio | pvalue | p.adjust | Count |
| GO:0010498111 | Esophagus | ESCC | proteasomal protein catabolic process | 369/8552 | 490/18723 | 1.13e-41 | 1.80e-38 | 369 |
| GO:0043161111 | Esophagus | ESCC | proteasome-mediated ubiquitin-dependent protein catabolic process | 312/8552 | 412/18723 | 3.53e-36 | 4.48e-33 | 312 |
| GO:0072594110 | Esophagus | ESCC | establishment of protein localization to organelle | 311/8552 | 422/18723 | 3.02e-32 | 2.13e-29 | 311 |
| GO:0006605111 | Esophagus | ESCC | protein targeting | 229/8552 | 314/18723 | 4.93e-23 | 1.01e-20 | 229 |
| GO:0034976111 | Esophagus | ESCC | response to endoplasmic reticulum stress | 192/8552 | 256/18723 | 7.15e-22 | 1.30e-19 | 192 |
| GO:0006457110 | Esophagus | ESCC | protein folding | 163/8552 | 212/18723 | 1.13e-20 | 1.74e-18 | 163 |
| GO:0090150110 | Esophagus | ESCC | establishment of protein localization to membrane | 182/8552 | 260/18723 | 1.27e-15 | 8.19e-14 | 182 |
| GO:003650315 | Esophagus | ESCC | ERAD pathway | 82/8552 | 107/18723 | 5.80e-11 | 1.84e-09 | 82 |
| GO:0061077110 | Esophagus | ESCC | chaperone-mediated protein folding | 56/8552 | 67/18723 | 1.52e-10 | 4.36e-09 | 56 |
| GO:003043314 | Esophagus | ESCC | ubiquitin-dependent ERAD pathway | 66/8552 | 85/18723 | 1.64e-09 | 3.78e-08 | 66 |
| GO:007097218 | Esophagus | ESCC | protein localization to endoplasmic reticulum | 52/8552 | 74/18723 | 1.58e-05 | 1.42e-04 | 52 |
| GO:00066124 | Esophagus | ESCC | protein targeting to membrane | 83/8552 | 131/18723 | 3.31e-05 | 2.73e-04 | 83 |
| GO:19033324 | Esophagus | ESCC | regulation of protein folding | 12/8552 | 12/18723 | 8.21e-05 | 6.01e-04 | 12 |
| GO:000662019 | Esophagus | ESCC | posttranslational protein targeting to endoplasmic reticulum membrane | 11/8552 | 12/18723 | 1.26e-03 | 6.06e-03 | 11 |
| GO:007259915 | Esophagus | ESCC | establishment of protein localization to endoplasmic reticulum | 31/8552 | 46/18723 | 2.42e-03 | 1.06e-02 | 31 |
| GO:004504715 | Esophagus | ESCC | protein targeting to ER | 28/8552 | 42/18723 | 4.90e-03 | 1.89e-02 | 28 |
| GO:001049822 | Liver | HCC | proteasomal protein catabolic process | 351/7958 | 490/18723 | 6.92e-40 | 1.46e-36 | 351 |
| GO:004316122 | Liver | HCC | proteasome-mediated ubiquitin-dependent protein catabolic process | 299/7958 | 412/18723 | 7.82e-36 | 8.27e-33 | 299 |
| GO:007259422 | Liver | HCC | establishment of protein localization to organelle | 299/7958 | 422/18723 | 1.06e-32 | 6.10e-30 | 299 |
| GO:003497612 | Liver | HCC | response to endoplasmic reticulum stress | 189/7958 | 256/18723 | 1.43e-24 | 4.06e-22 | 189 |
| Page: 1 2 3 4 |
| Pathway ID | Tissue | Disease Stage | Description | Gene Ratio | Bg Ratio | pvalue | p.adjust | qvalue | Count |
| Page: 1 |
Top |
Cell-cell communication analysis |
| Identification of potential cell-cell interactions between two cell types and their ligand-receptor pairs for different disease states |
| Ligand | Receptor | LRpair | Pathway | Tissue | Disease Stage |
| Page: 1 |
Top |
Single-cell gene regulatory network inference analysis |
| Find out the significant the regulons (TFs) and the target genes of each regulon across cell types for different disease states |
| TF | Cell Type | Tissue | Disease Stage | Target Gene | RSS | Regulon Activity |
| ∗The dot plots of a searched regulon are shown for all cell subpopulations in each disease state of each tissue based on the regulon specific score inferred using pySCENIC and by calculating the average expression. |
| Page: 1 |
Top |
Somatic mutation of malignant transformation related genes |
| Annotation of somatic variants for genes involved in malignant transformation |
| Hugo Symbol | Variant Class | Variant Classification | dbSNP RS | HGVSc | HGVSp | HGVSp Short | SWISSPROT | BIOTYPE | SIFT | PolyPhen | Tumor Sample Barcode | Tissue | Histology | Sex | Age | Stage | Therapy Types | Drugs | Outcome |
| SGTB | SNV | Missense_Mutation | rs756660344 | c.55N>G | p.Ser19Gly | p.S19G | Q96EQ0 | protein_coding | deleterious(0) | benign(0.01) | TCGA-D8-A73U-01 | Breast | breast invasive carcinoma | Female | >=65 | I/II | Hormone Therapy | tamoxiphen | SD |
| SGTB | insertion | Nonsense_Mutation | novel | c.830_831insAAGTTTTTA | p.Gln277_Gln278insSerPheTer | p.Q277_Q278insSF* | Q96EQ0 | protein_coding | TCGA-BH-A0HF-01 | Breast | breast invasive carcinoma | Female | >=65 | I/II | Hormone Therapy | arimidex | SD | ||
| SGTB | insertion | Nonsense_Mutation | novel | c.828_829insTTTGTTGGTAAGCTCTTTAGCTCCAATTTCCCTTAAG | p.Gln277PhefsTer12 | p.Q277Ffs*12 | Q96EQ0 | protein_coding | TCGA-BH-A0HF-01 | Breast | breast invasive carcinoma | Female | >=65 | I/II | Hormone Therapy | arimidex | SD | ||
| SGTB | SNV | Missense_Mutation | rs148762174 | c.38G>A | p.Arg13His | p.R13H | Q96EQ0 | protein_coding | tolerated(0.07) | benign(0.001) | TCGA-2W-A8YY-01 | Cervix | cervical & endocervical cancer | Female | <65 | I/II | Chemotherapy | cisplatin | CR |
| SGTB | SNV | Missense_Mutation | c.572N>T | p.Ser191Leu | p.S191L | Q96EQ0 | protein_coding | deleterious(0) | benign(0.093) | TCGA-JW-A5VL-01 | Cervix | cervical & endocervical cancer | Female | <65 | I/II | Unknown | Unknown | SD | |
| SGTB | SNV | Missense_Mutation | novel | c.256N>A | p.Asp86Asn | p.D86N | Q96EQ0 | protein_coding | tolerated(0.09) | benign(0.01) | TCGA-MA-AA42-01 | Cervix | cervical & endocervical cancer | Female | >=65 | I/II | Unknown | Unknown | SD |
| SGTB | SNV | Missense_Mutation | novel | c.461N>G | p.Lys154Arg | p.K154R | Q96EQ0 | protein_coding | deleterious(0) | probably_damaging(0.977) | TCGA-AA-A00N-01 | Colorectum | colon adenocarcinoma | Male | >=65 | I/II | Unknown | Unknown | PD |
| SGTB | SNV | Missense_Mutation | c.54N>C | p.Gln18His | p.Q18H | Q96EQ0 | protein_coding | deleterious(0) | probably_damaging(0.971) | TCGA-AA-A00N-01 | Colorectum | colon adenocarcinoma | Male | >=65 | I/II | Unknown | Unknown | PD | |
| SGTB | SNV | Missense_Mutation | c.874C>T | p.Arg292Trp | p.R292W | Q96EQ0 | protein_coding | deleterious(0) | probably_damaging(0.949) | TCGA-CM-5860-01 | Colorectum | colon adenocarcinoma | Male | <65 | I/II | Ancillary | leucovorin | SD | |
| SGTB | SNV | Missense_Mutation | novel | c.409G>T | p.Asp137Tyr | p.D137Y | Q96EQ0 | protein_coding | tolerated(0.17) | benign(0.436) | TCGA-AG-A002-01 | Colorectum | rectum adenocarcinoma | Male | <65 | I/II | Unknown | Unknown | SD |
| Page: 1 2 3 |
Top |
Related drugs of malignant transformation related genes |
| Identification of chemicals and drugs interact with genes involved in malignant transfromation |
| (DGIdb 4.0) |
| Entrez ID | Symbol | Category | Interaction Types | Drug Claim Name | Drug Name | PMIDs |
| Page: 1 |

Copyright 2023-Present -The University of Texas Health Science Center at Houston |