
|
|||||
|
 | |
| |
| |
| |
| |
| |
|
Gene: SGTA |
Gene summary for SGTA |
| Gene information | Species | Human | Gene symbol | SGTA | Gene ID | 6449 |
| Gene name | small glutamine rich tetratricopeptide repeat co-chaperone alpha | |
| Gene Alias | SGT | |
| Cytomap | 19p13.3 | |
| Gene Type | protein-coding | GO ID | GO:0006457 | UniProtAcc | O43765 |
Top |
Malignant transformation analysis |
| Identification of the aberrant gene expression in precancerous and cancerous lesions by comparing the gene expression of stem-like cells in diseased tissues with normal stem cells |
| Entrez ID | Symbol | Replicates | Species | Organ | Tissue | Adj P-value | Log2FC | Malignancy |
| 6449 | SGTA | LZE4T | Human | Esophagus | ESCC | 1.21e-02 | 2.22e-02 | 0.0811 |
| 6449 | SGTA | LZE7T | Human | Esophagus | ESCC | 2.72e-08 | 1.74e-01 | 0.0667 |
| 6449 | SGTA | LZE8T | Human | Esophagus | ESCC | 1.13e-07 | 2.36e-01 | 0.067 |
| 6449 | SGTA | LZE20T | Human | Esophagus | ESCC | 2.30e-03 | -1.83e-02 | 0.0662 |
| 6449 | SGTA | LZE24T | Human | Esophagus | ESCC | 2.11e-13 | 3.79e-01 | 0.0596 |
| 6449 | SGTA | LZE6T | Human | Esophagus | ESCC | 6.15e-06 | 4.06e-01 | 0.0845 |
| 6449 | SGTA | P1T-E | Human | Esophagus | ESCC | 2.29e-02 | 2.05e-01 | 0.0875 |
| 6449 | SGTA | P2T-E | Human | Esophagus | ESCC | 7.46e-18 | 2.43e-01 | 0.1177 |
| 6449 | SGTA | P4T-E | Human | Esophagus | ESCC | 1.85e-19 | 4.25e-01 | 0.1323 |
| 6449 | SGTA | P5T-E | Human | Esophagus | ESCC | 1.38e-10 | 1.25e-01 | 0.1327 |
| 6449 | SGTA | P8T-E | Human | Esophagus | ESCC | 3.24e-14 | 1.49e-01 | 0.0889 |
| 6449 | SGTA | P9T-E | Human | Esophagus | ESCC | 4.39e-11 | 1.96e-01 | 0.1131 |
| 6449 | SGTA | P10T-E | Human | Esophagus | ESCC | 4.14e-20 | 4.47e-01 | 0.116 |
| 6449 | SGTA | P11T-E | Human | Esophagus | ESCC | 2.40e-17 | 6.17e-01 | 0.1426 |
| 6449 | SGTA | P12T-E | Human | Esophagus | ESCC | 1.27e-26 | 5.05e-01 | 0.1122 |
| 6449 | SGTA | P15T-E | Human | Esophagus | ESCC | 1.41e-18 | 2.83e-01 | 0.1149 |
| 6449 | SGTA | P16T-E | Human | Esophagus | ESCC | 5.53e-21 | 3.43e-01 | 0.1153 |
| 6449 | SGTA | P17T-E | Human | Esophagus | ESCC | 3.55e-11 | 4.00e-01 | 0.1278 |
| 6449 | SGTA | P19T-E | Human | Esophagus | ESCC | 4.22e-07 | 7.39e-01 | 0.1662 |
| 6449 | SGTA | P20T-E | Human | Esophagus | ESCC | 2.84e-19 | 4.06e-01 | 0.1124 |
| Page: 1 2 3 4 5 6 |
| Tissue | Expression Dynamics | Abbreviation |
| Esophagus | 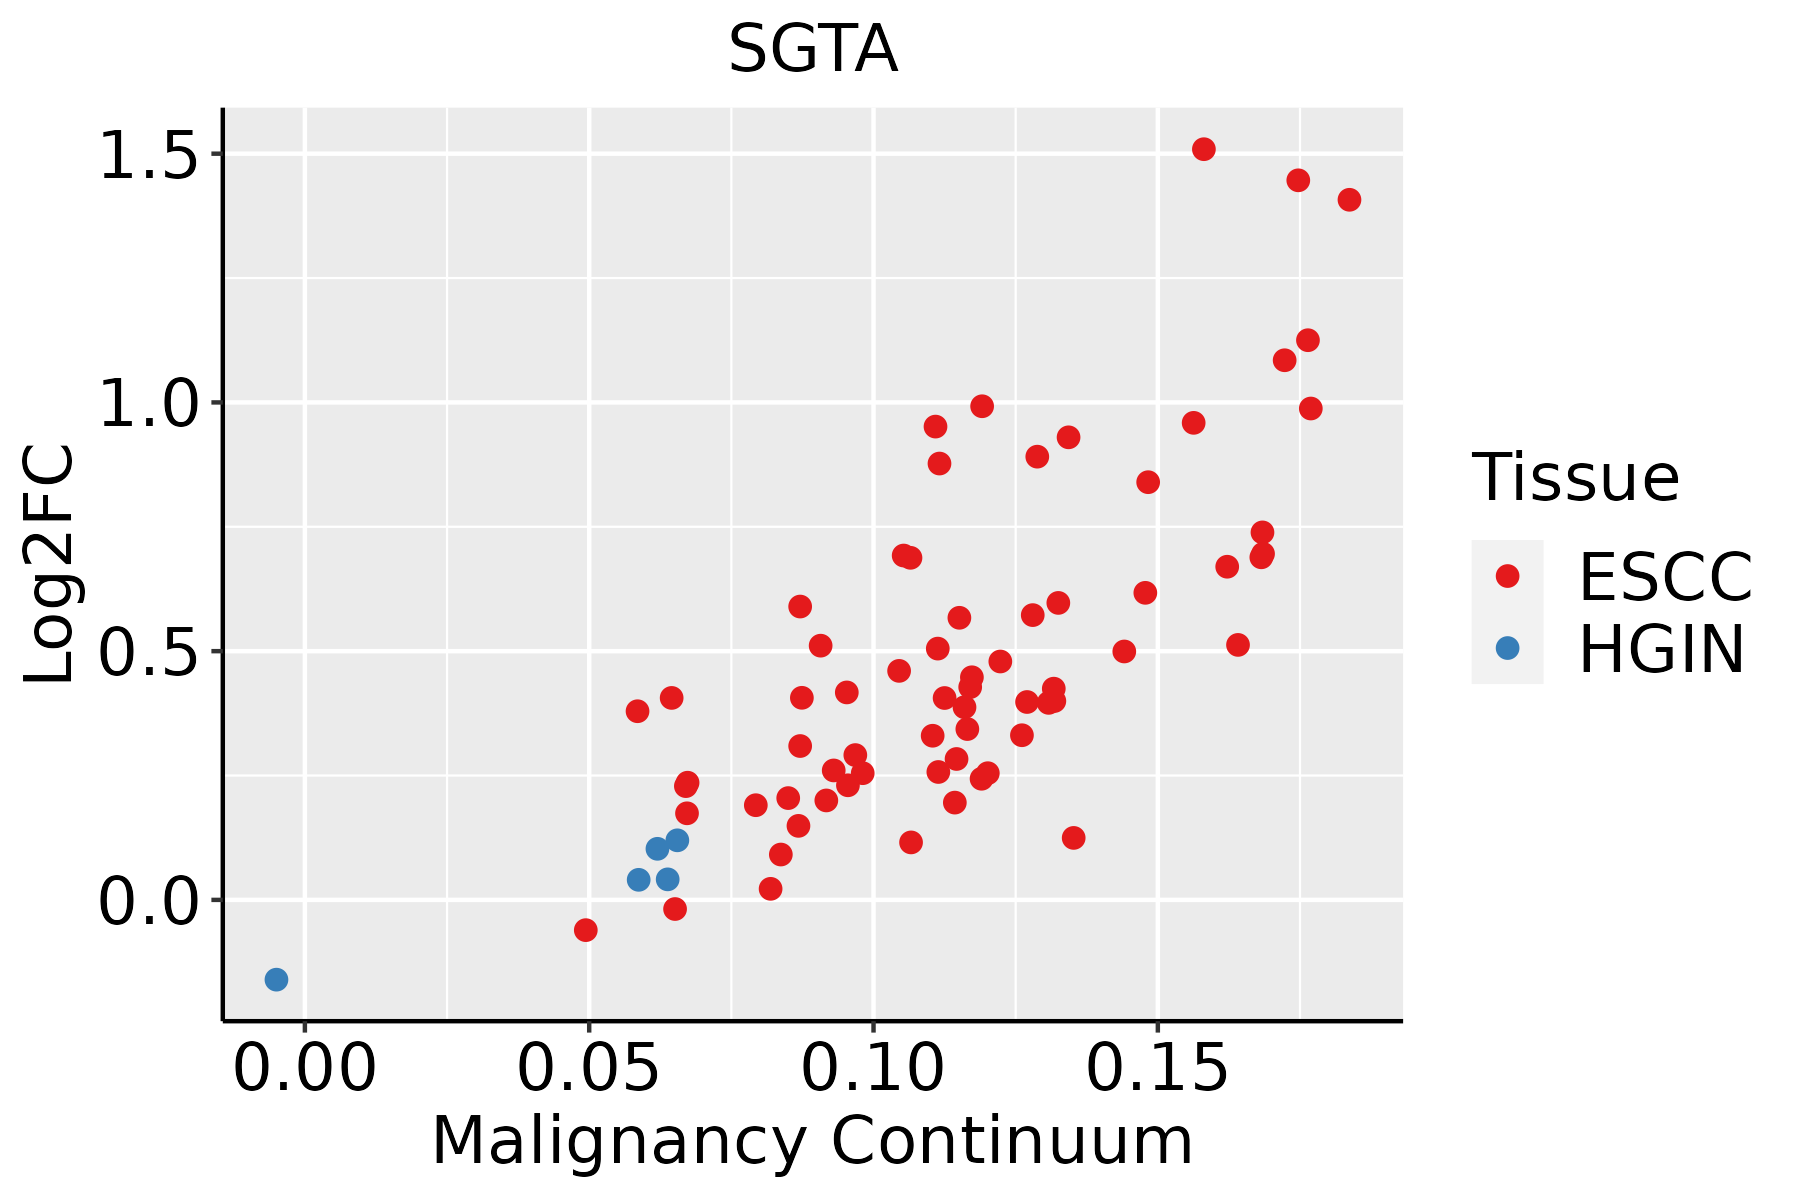 | ESCC: Esophageal squamous cell carcinoma |
| HGIN: High-grade intraepithelial neoplasias | ||
| LGIN: Low-grade intraepithelial neoplasias | ||
| Liver |  | HCC: Hepatocellular carcinoma |
| NAFLD: Non-alcoholic fatty liver disease | ||
| Oral Cavity | 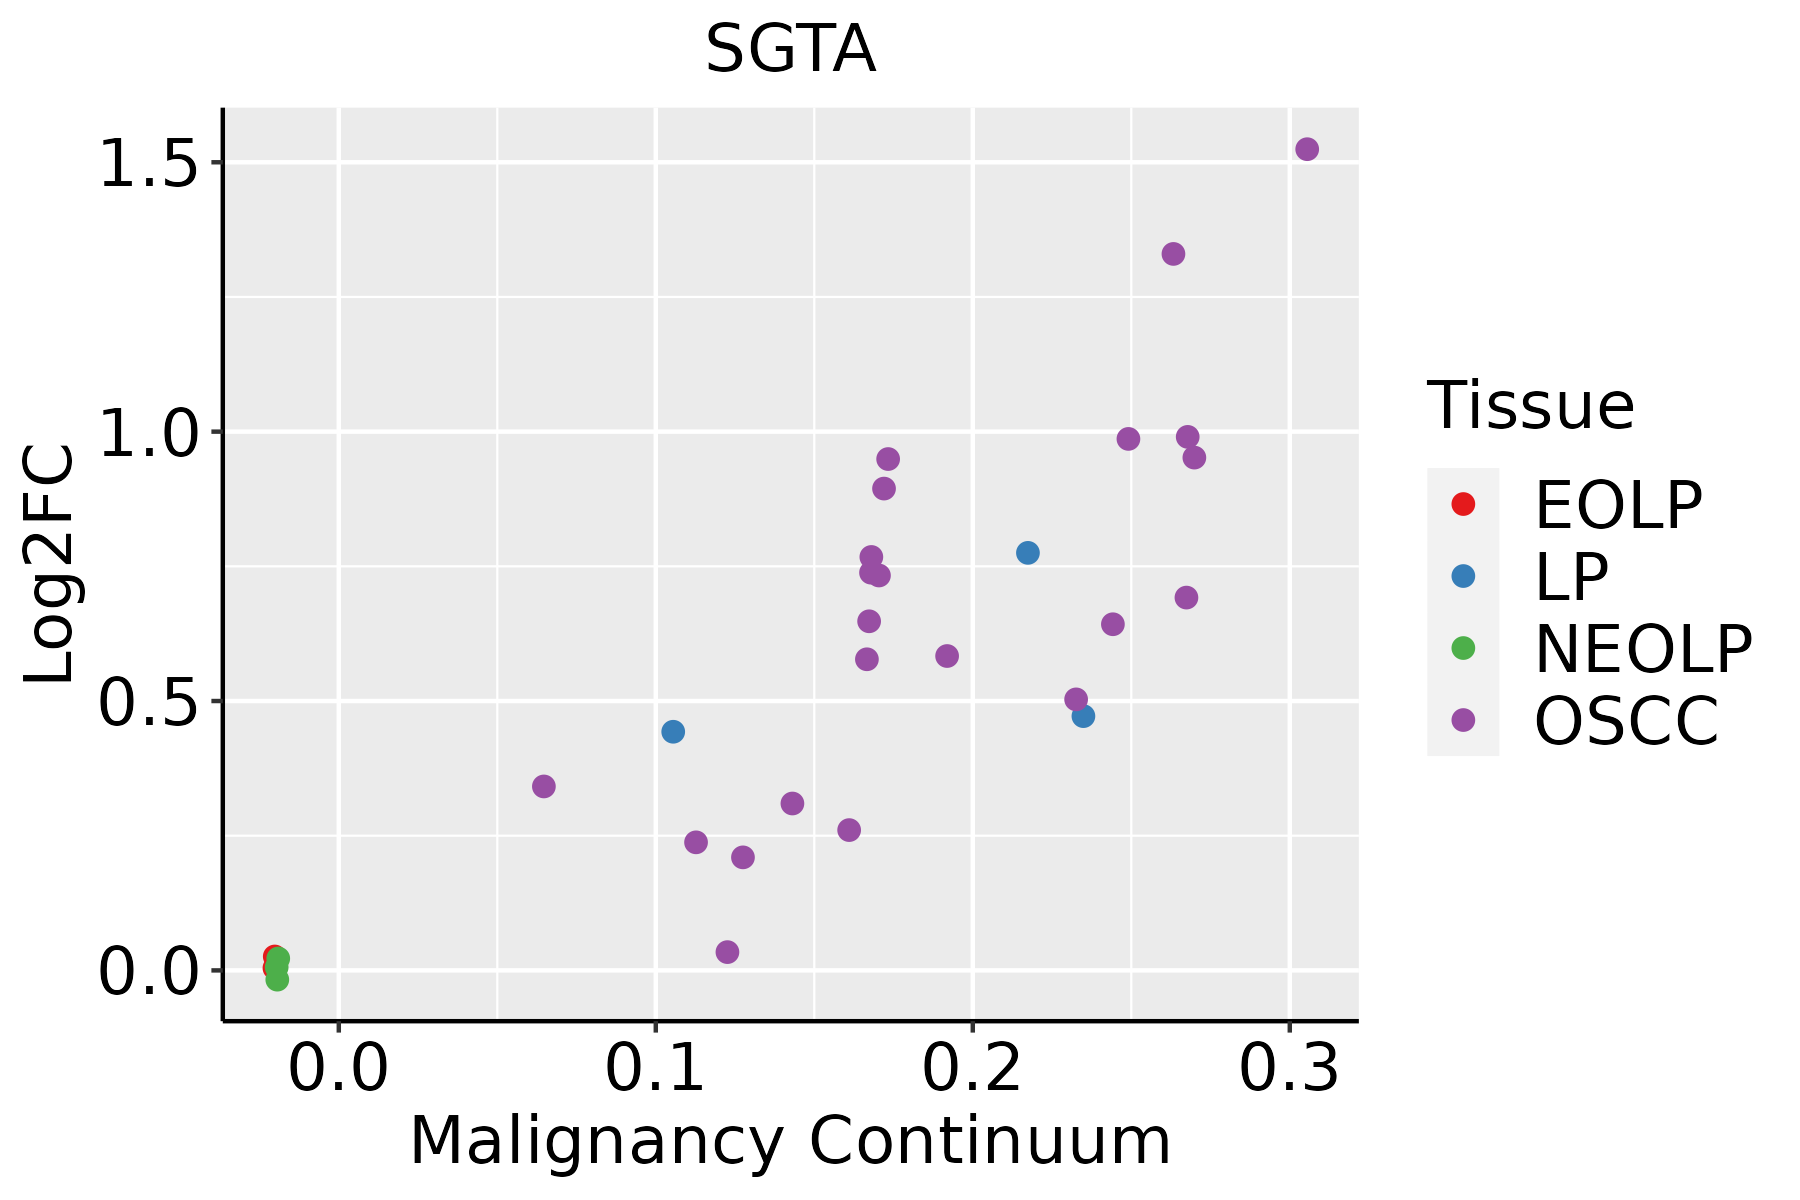 | EOLP: Erosive Oral lichen planus |
| LP: leukoplakia | ||
| NEOLP: Non-erosive oral lichen planus | ||
| OSCC: Oral squamous cell carcinoma | ||
| Skin |  | AK: Actinic keratosis |
| cSCC: Cutaneous squamous cell carcinoma | ||
| SCCIS:squamous cell carcinoma in situ | ||
| Thyroid |  | ATC: Anaplastic thyroid cancer |
| HT: Hashimoto's thyroiditis | ||
| PTC: Papillary thyroid cancer |
| ∗log2FC in expression of this searched gene in stem-like cells from each diseased tissue sample relative to stem-like cells in normal samples in each tissue plotted against the malignancy continuum. Samples are colored based on if they are from different disease stage. |
Top |
Malignant transformation related pathway analysis |
| Find out the enriched GO biological processes and KEGG pathways involved in transition from healthy to precancer to cancer |
| Tissue | Disease Stage | Enriched GO biological Processes |
| Colorectum | AD |  |
| Colorectum | SER |  |
| Colorectum | MSS |  |
| Colorectum | MSI-H |  |
| Colorectum | FAP |  |
| ∗Top 15 enriched GO BP terms are showed in the bar plot of each disease state in each tissue. Each row represents a significant GO biological process which is colored according to the -log10(p.adjust). |
| Page: 1 2 3 4 5 6 7 8 9 |
| GO ID | Tissue | Disease Stage | Description | Gene Ratio | Bg Ratio | pvalue | p.adjust | Count |
| GO:0010498111 | Esophagus | ESCC | proteasomal protein catabolic process | 369/8552 | 490/18723 | 1.13e-41 | 1.80e-38 | 369 |
| GO:0043161111 | Esophagus | ESCC | proteasome-mediated ubiquitin-dependent protein catabolic process | 312/8552 | 412/18723 | 3.53e-36 | 4.48e-33 | 312 |
| GO:0072594110 | Esophagus | ESCC | establishment of protein localization to organelle | 311/8552 | 422/18723 | 3.02e-32 | 2.13e-29 | 311 |
| GO:0042176111 | Esophagus | ESCC | regulation of protein catabolic process | 280/8552 | 391/18723 | 8.65e-26 | 2.39e-23 | 280 |
| GO:0009896111 | Esophagus | ESCC | positive regulation of catabolic process | 332/8552 | 492/18723 | 4.36e-23 | 9.22e-21 | 332 |
| GO:0006605111 | Esophagus | ESCC | protein targeting | 229/8552 | 314/18723 | 4.93e-23 | 1.01e-20 | 229 |
| GO:0034976111 | Esophagus | ESCC | response to endoplasmic reticulum stress | 192/8552 | 256/18723 | 7.15e-22 | 1.30e-19 | 192 |
| GO:0031331111 | Esophagus | ESCC | positive regulation of cellular catabolic process | 292/8552 | 427/18723 | 8.67e-22 | 1.53e-19 | 292 |
| GO:0006457110 | Esophagus | ESCC | protein folding | 163/8552 | 212/18723 | 1.13e-20 | 1.74e-18 | 163 |
| GO:1903362111 | Esophagus | ESCC | regulation of cellular protein catabolic process | 188/8552 | 255/18723 | 5.12e-20 | 6.62e-18 | 188 |
| GO:0045862111 | Esophagus | ESCC | positive regulation of proteolysis | 256/8552 | 372/18723 | 7.88e-20 | 9.43e-18 | 256 |
| GO:1903050111 | Esophagus | ESCC | regulation of proteolysis involved in cellular protein catabolic process | 163/8552 | 221/18723 | 1.44e-17 | 1.27e-15 | 163 |
| GO:0061136111 | Esophagus | ESCC | regulation of proteasomal protein catabolic process | 142/8552 | 187/18723 | 2.40e-17 | 2.00e-15 | 142 |
| GO:0045732111 | Esophagus | ESCC | positive regulation of protein catabolic process | 167/8552 | 231/18723 | 1.47e-16 | 1.14e-14 | 167 |
| GO:0032434111 | Esophagus | ESCC | regulation of proteasomal ubiquitin-dependent protein catabolic process | 107/8552 | 134/18723 | 4.06e-16 | 2.93e-14 | 107 |
| GO:2000058111 | Esophagus | ESCC | regulation of ubiquitin-dependent protein catabolic process | 125/8552 | 164/18723 | 1.17e-15 | 7.76e-14 | 125 |
| GO:0090150110 | Esophagus | ESCC | establishment of protein localization to membrane | 182/8552 | 260/18723 | 1.27e-15 | 8.19e-14 | 182 |
| GO:1903364111 | Esophagus | ESCC | positive regulation of cellular protein catabolic process | 117/8552 | 155/18723 | 3.25e-14 | 1.66e-12 | 117 |
| GO:1901800110 | Esophagus | ESCC | positive regulation of proteasomal protein catabolic process | 91/8552 | 114/18723 | 6.74e-14 | 3.34e-12 | 91 |
| GO:1903052110 | Esophagus | ESCC | positive regulation of proteolysis involved in cellular protein catabolic process | 101/8552 | 133/18723 | 9.58e-13 | 4.19e-11 | 101 |
| Page: 1 2 3 4 5 6 7 8 9 10 11 12 13 14 15 16 17 |
| Pathway ID | Tissue | Disease Stage | Description | Gene Ratio | Bg Ratio | pvalue | p.adjust | qvalue | Count |
| Page: 1 |
Top |
Cell-cell communication analysis |
| Identification of potential cell-cell interactions between two cell types and their ligand-receptor pairs for different disease states |
| Ligand | Receptor | LRpair | Pathway | Tissue | Disease Stage |
| Page: 1 |
Top |
Single-cell gene regulatory network inference analysis |
| Find out the significant the regulons (TFs) and the target genes of each regulon across cell types for different disease states |
| TF | Cell Type | Tissue | Disease Stage | Target Gene | RSS | Regulon Activity |
| ∗The dot plots of a searched regulon are shown for all cell subpopulations in each disease state of each tissue based on the regulon specific score inferred using pySCENIC and by calculating the average expression. |
| Page: 1 |
Top |
Somatic mutation of malignant transformation related genes |
| Annotation of somatic variants for genes involved in malignant transformation |
| Hugo Symbol | Variant Class | Variant Classification | dbSNP RS | HGVSc | HGVSp | HGVSp Short | SWISSPROT | BIOTYPE | SIFT | PolyPhen | Tumor Sample Barcode | Tissue | Histology | Sex | Age | Stage | Therapy Types | Drugs | Outcome |
| SGTA | insertion | Frame_Shift_Ins | novel | c.752_753insCAGCCGTGTGGCGGATCGTGTGGCTTCCAAAGCC | p.Gly253ArgfsTer133 | p.G253Rfs*133 | O43765 | protein_coding | TCGA-A2-A04Y-01 | Breast | breast invasive carcinoma | Female | <65 | I/II | Chemotherapy | cytoxan | SD | ||
| SGTA | SNV | Missense_Mutation | c.384N>G | p.Phe128Leu | p.F128L | O43765 | protein_coding | deleterious(0.01) | possibly_damaging(0.496) | TCGA-IR-A3LA-01 | Cervix | cervical & endocervical cancer | Female | <65 | I/II | Chemotherapy | cisplatin | CR | |
| SGTA | SNV | Missense_Mutation | c.575N>G | p.Asn192Ser | p.N192S | O43765 | protein_coding | deleterious(0) | probably_damaging(0.986) | TCGA-Q1-A73S-01 | Cervix | cervical & endocervical cancer | Female | <65 | I/II | Chemotherapy | cisplatin | SD | |
| SGTA | SNV | Missense_Mutation | c.704N>T | p.Ser235Leu | p.S235L | O43765 | protein_coding | deleterious(0.02) | benign(0.009) | TCGA-AZ-4315-01 | Colorectum | colon adenocarcinoma | Male | <65 | I/II | Unknown | Unknown | SD | |
| SGTA | SNV | Missense_Mutation | c.628N>A | p.Pro210Thr | p.P210T | O43765 | protein_coding | tolerated(0.15) | benign(0.015) | TCGA-CK-5916-01 | Colorectum | colon adenocarcinoma | Female | >=65 | I/II | Unknown | Unknown | PD | |
| SGTA | SNV | Missense_Mutation | c.235N>A | p.Ala79Thr | p.A79T | O43765 | protein_coding | tolerated(0.46) | benign(0) | TCGA-CK-5916-01 | Colorectum | colon adenocarcinoma | Female | >=65 | I/II | Unknown | Unknown | PD | |
| SGTA | SNV | Missense_Mutation | c.223N>A | p.Leu75Met | p.L75M | O43765 | protein_coding | tolerated(0.26) | benign(0.007) | TCGA-CM-4746-01 | Colorectum | colon adenocarcinoma | Male | <65 | I/II | Unknown | Unknown | SD | |
| SGTA | SNV | Missense_Mutation | c.158N>T | p.Ala53Val | p.A53V | O43765 | protein_coding | tolerated(0.1) | benign(0.091) | TCGA-NH-A6GC-01 | Colorectum | colon adenocarcinoma | Female | >=65 | I/II | Chemotherapy | fluorouracil | SD | |
| SGTA | SNV | Missense_Mutation | c.152N>G | p.Asp51Gly | p.D51G | O43765 | protein_coding | tolerated(0.47) | benign(0) | TCGA-AG-4005-01 | Colorectum | rectum adenocarcinoma | Male | <65 | III/IV | Chemotherapy | folinic | CR | |
| SGTA | SNV | Missense_Mutation | novel | c.40T>G | p.Phe14Val | p.F14V | O43765 | protein_coding | deleterious(0) | possibly_damaging(0.77) | TCGA-AJ-A3EL-01 | Endometrium | uterine corpus endometrioid carcinoma | Female | <65 | I/II | Unknown | Unknown | SD |
| Page: 1 2 3 4 |
Top |
Related drugs of malignant transformation related genes |
| Identification of chemicals and drugs interact with genes involved in malignant transfromation |
| (DGIdb 4.0) |
| Entrez ID | Symbol | Category | Interaction Types | Drug Claim Name | Drug Name | PMIDs |
| Page: 1 |

Copyright 2023-Present -The University of Texas Health Science Center at Houston |