| Tissue | Expression Dynamics | Abbreviation |
| Colorectum (GSE201348) |  | FAP: Familial adenomatous polyposis |
| CRC: Colorectal cancer |
| Colorectum (HTA11) | 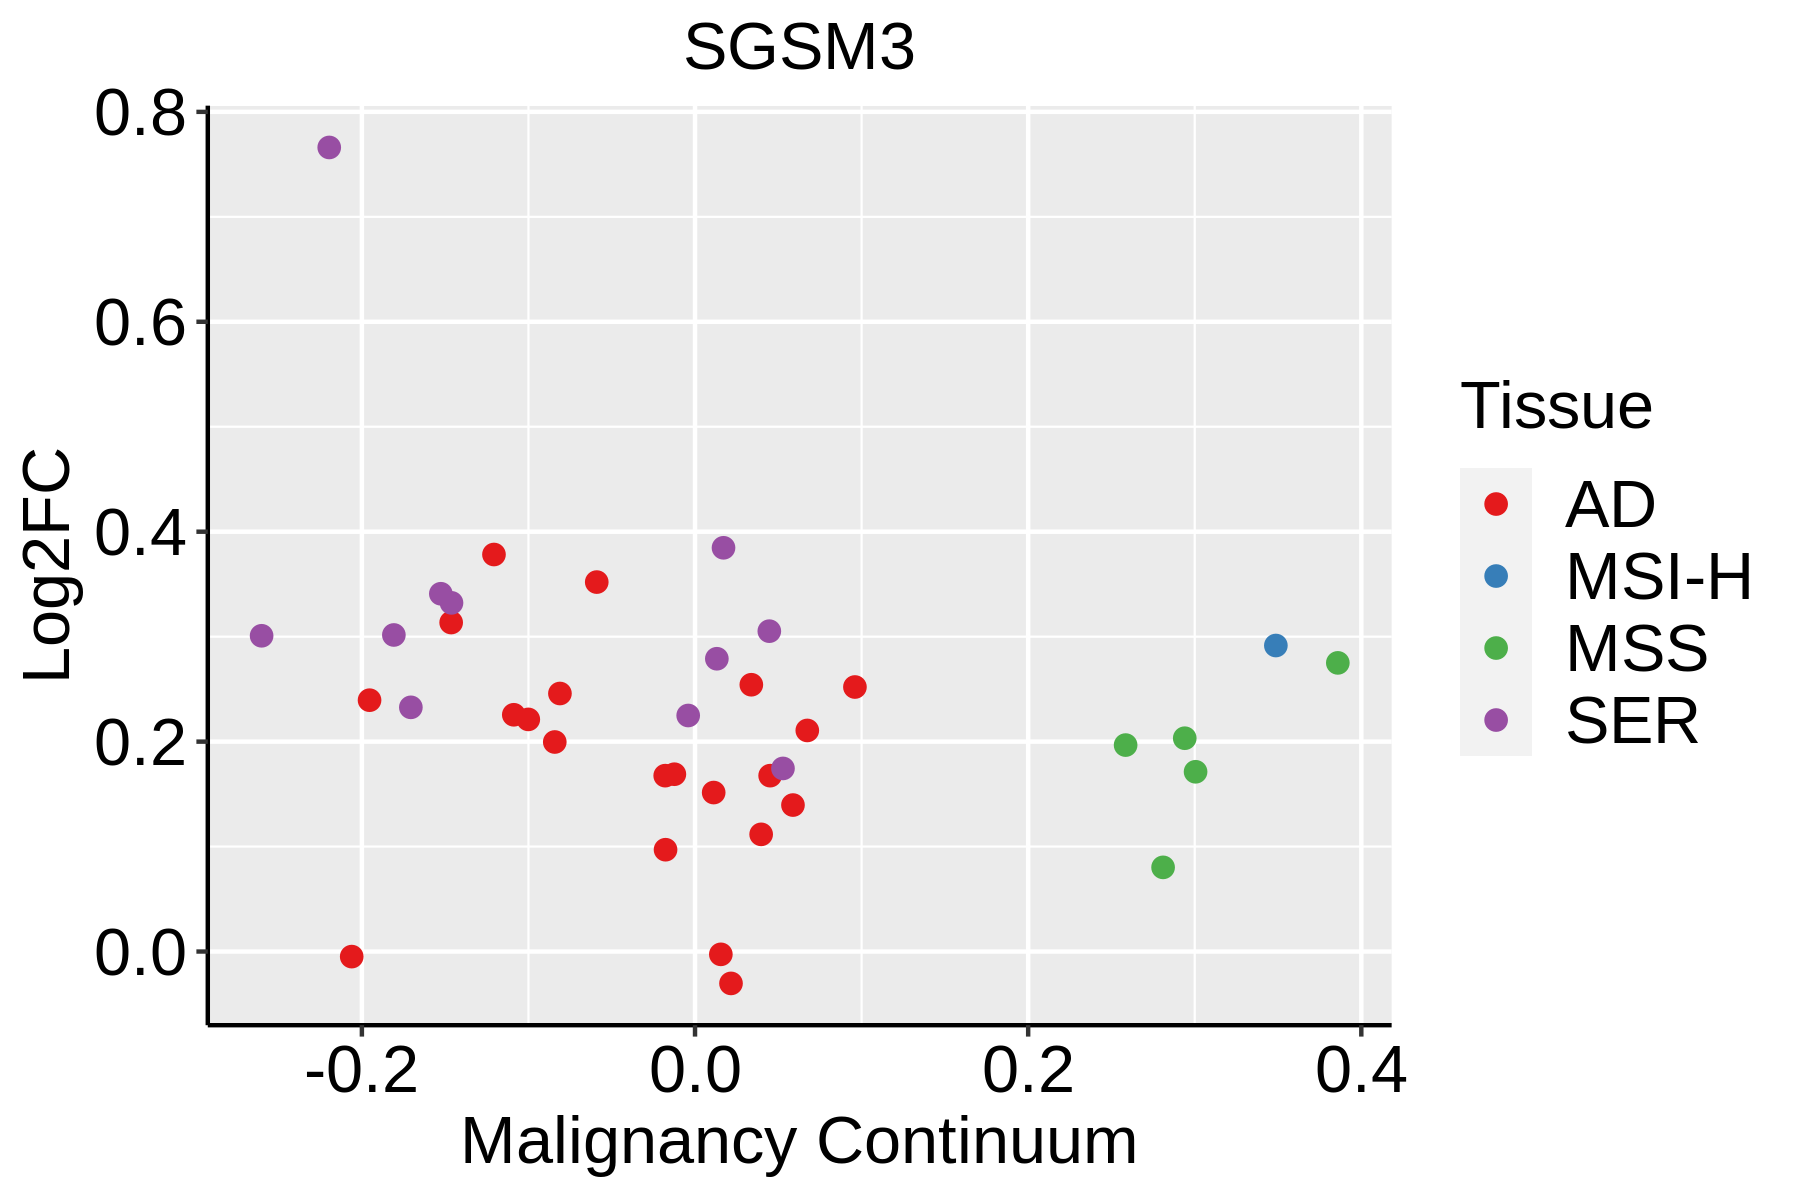 | AD: Adenomas |
| SER: Sessile serrated lesions |
| MSI-H: Microsatellite-high colorectal cancer |
| MSS: Microsatellite stable colorectal cancer |
| Esophagus | 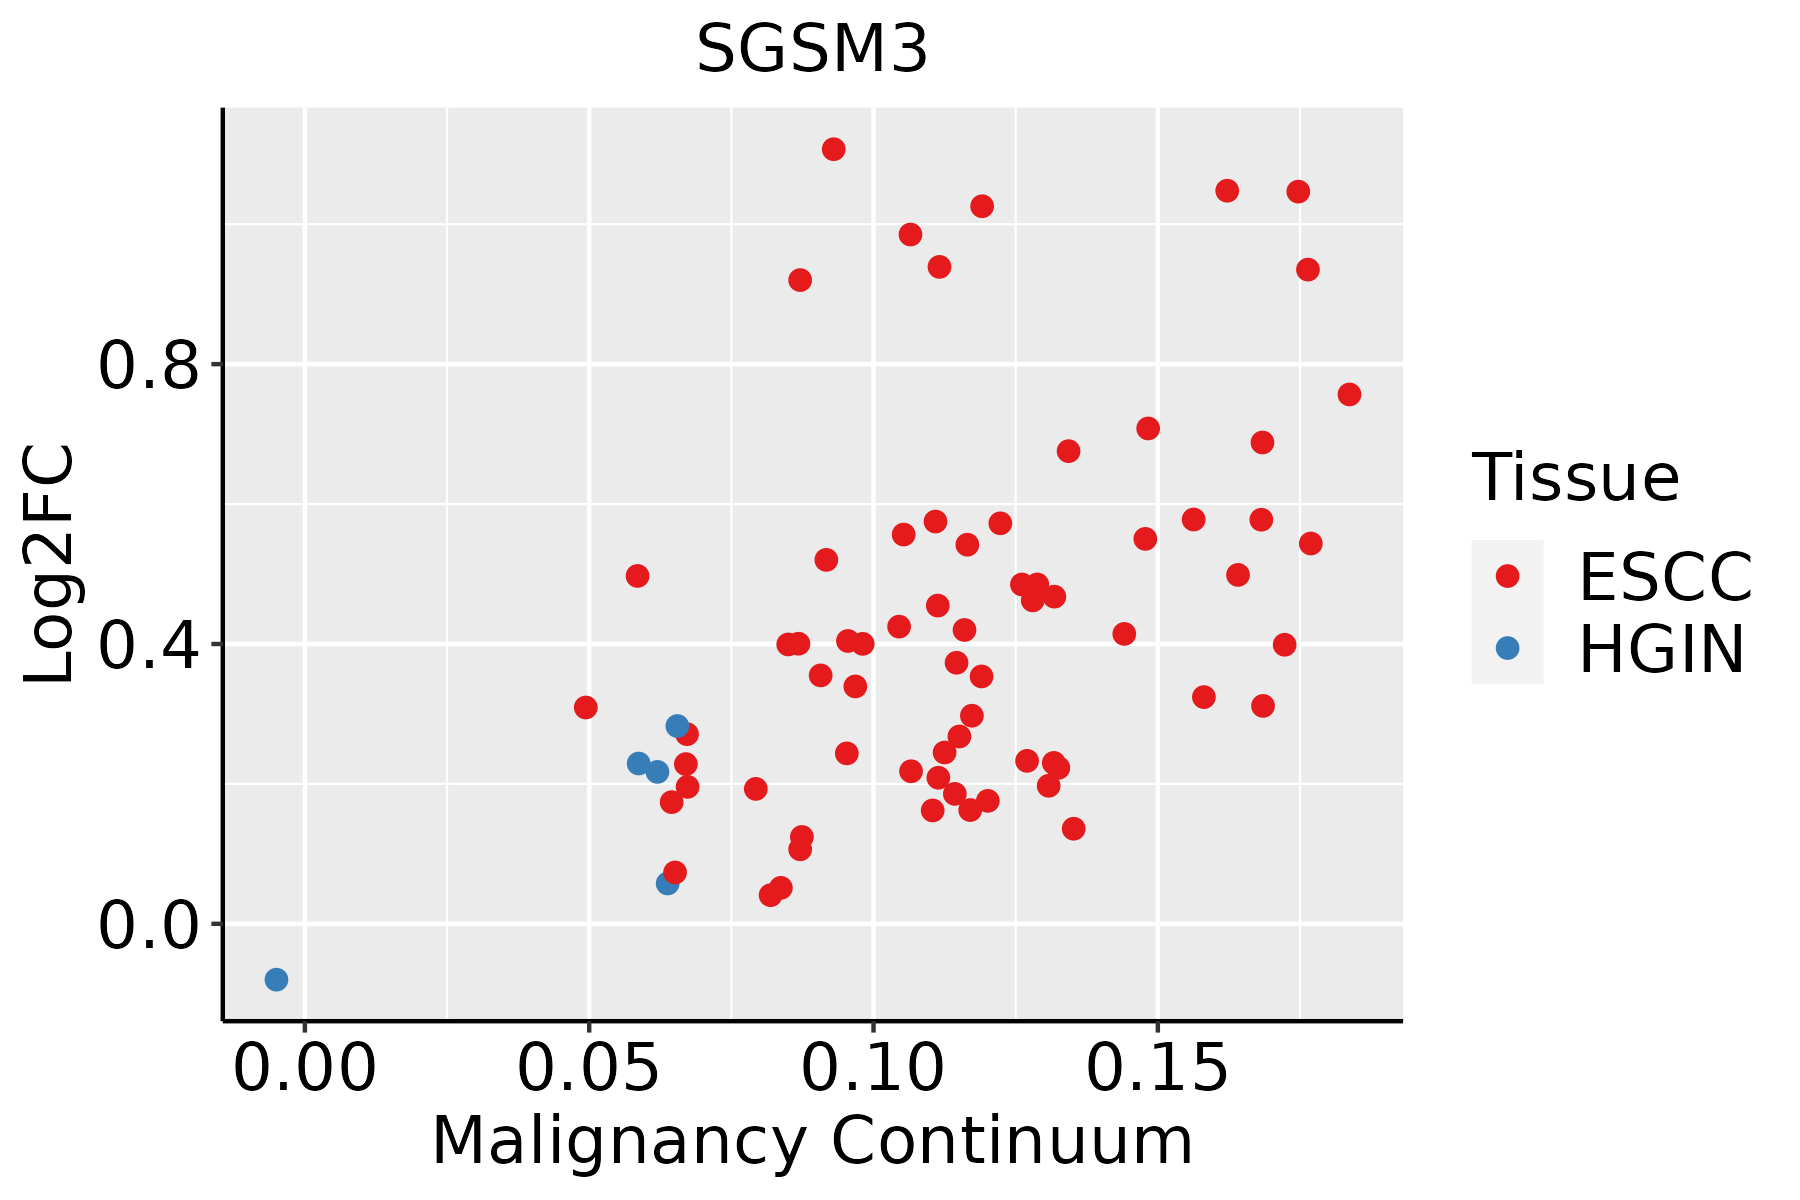 | ESCC: Esophageal squamous cell carcinoma |
| HGIN: High-grade intraepithelial neoplasias |
| LGIN: Low-grade intraepithelial neoplasias |
| Oral Cavity | 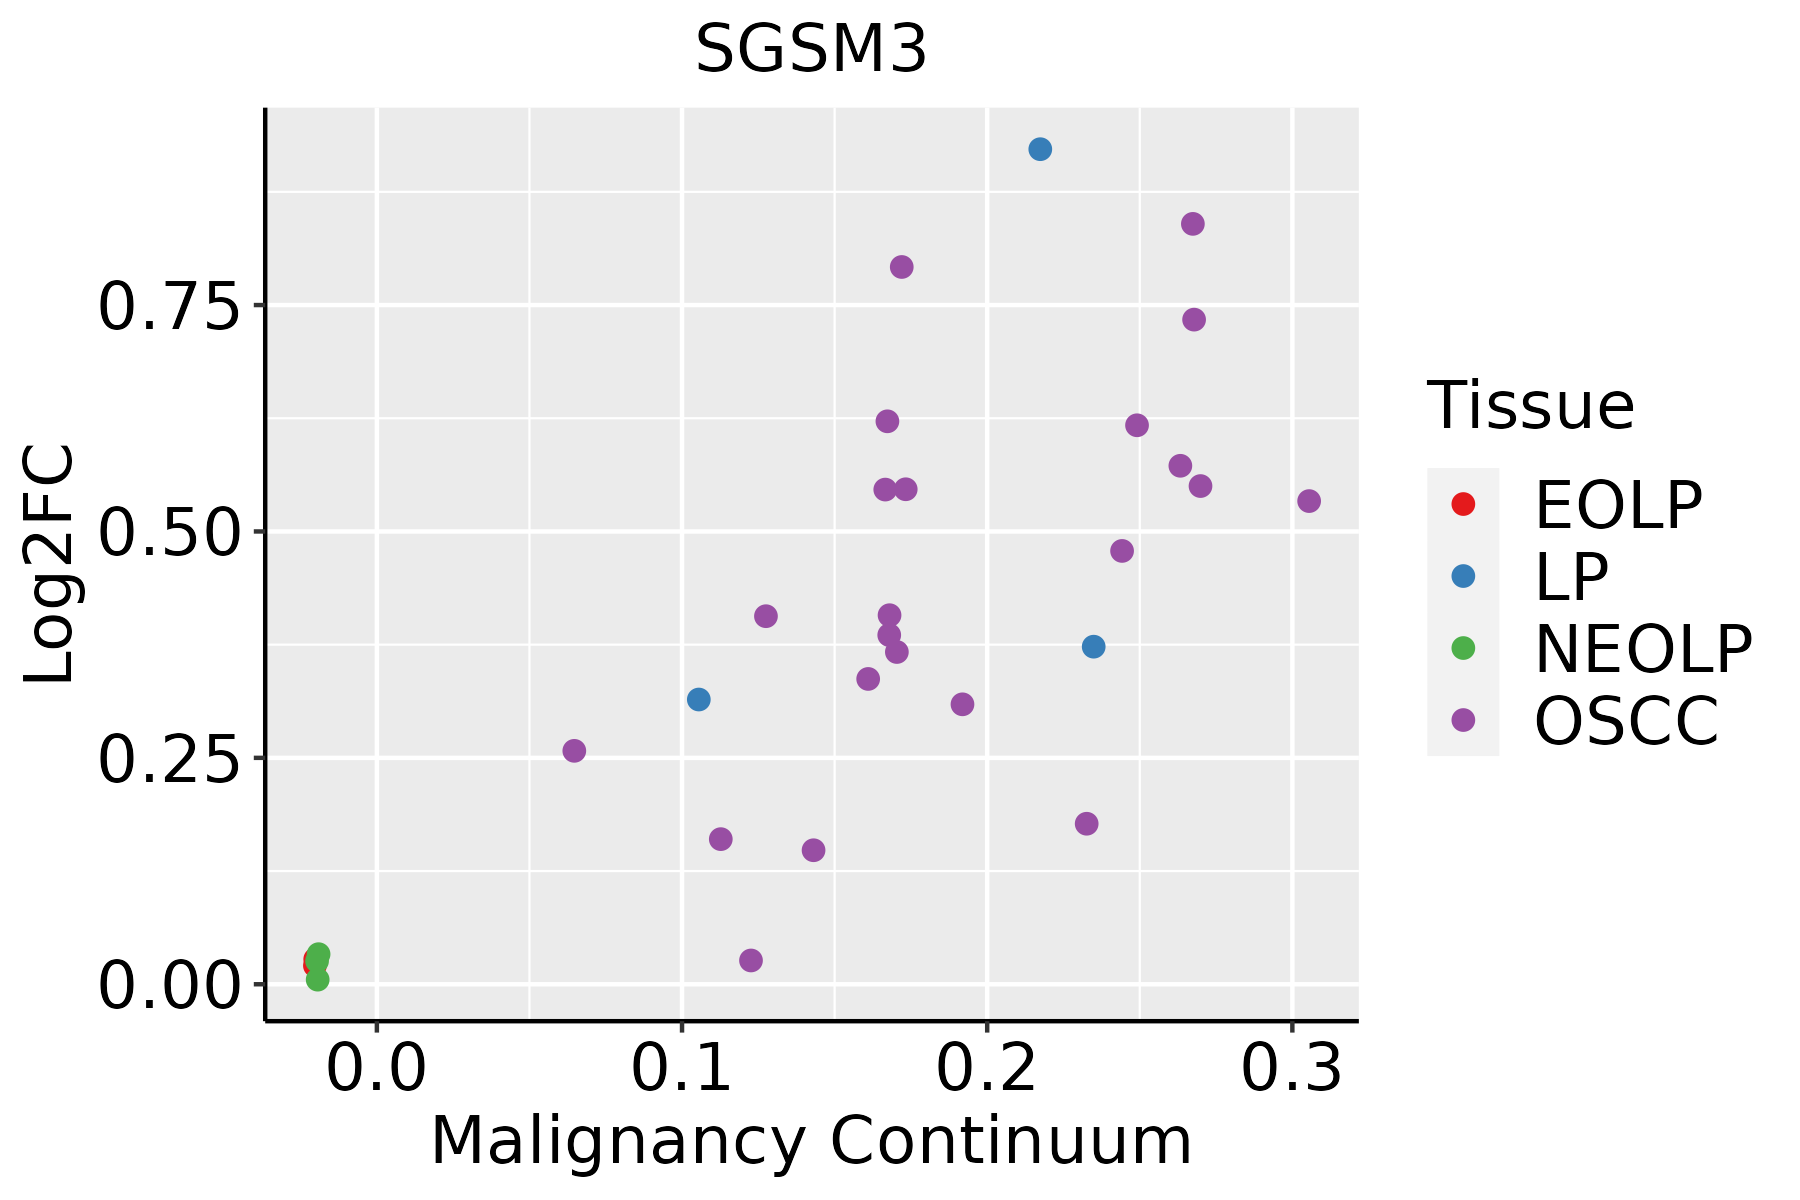 | EOLP: Erosive Oral lichen planus |
| LP: leukoplakia |
| NEOLP: Non-erosive oral lichen planus |
| OSCC: Oral squamous cell carcinoma |
| Prostate | 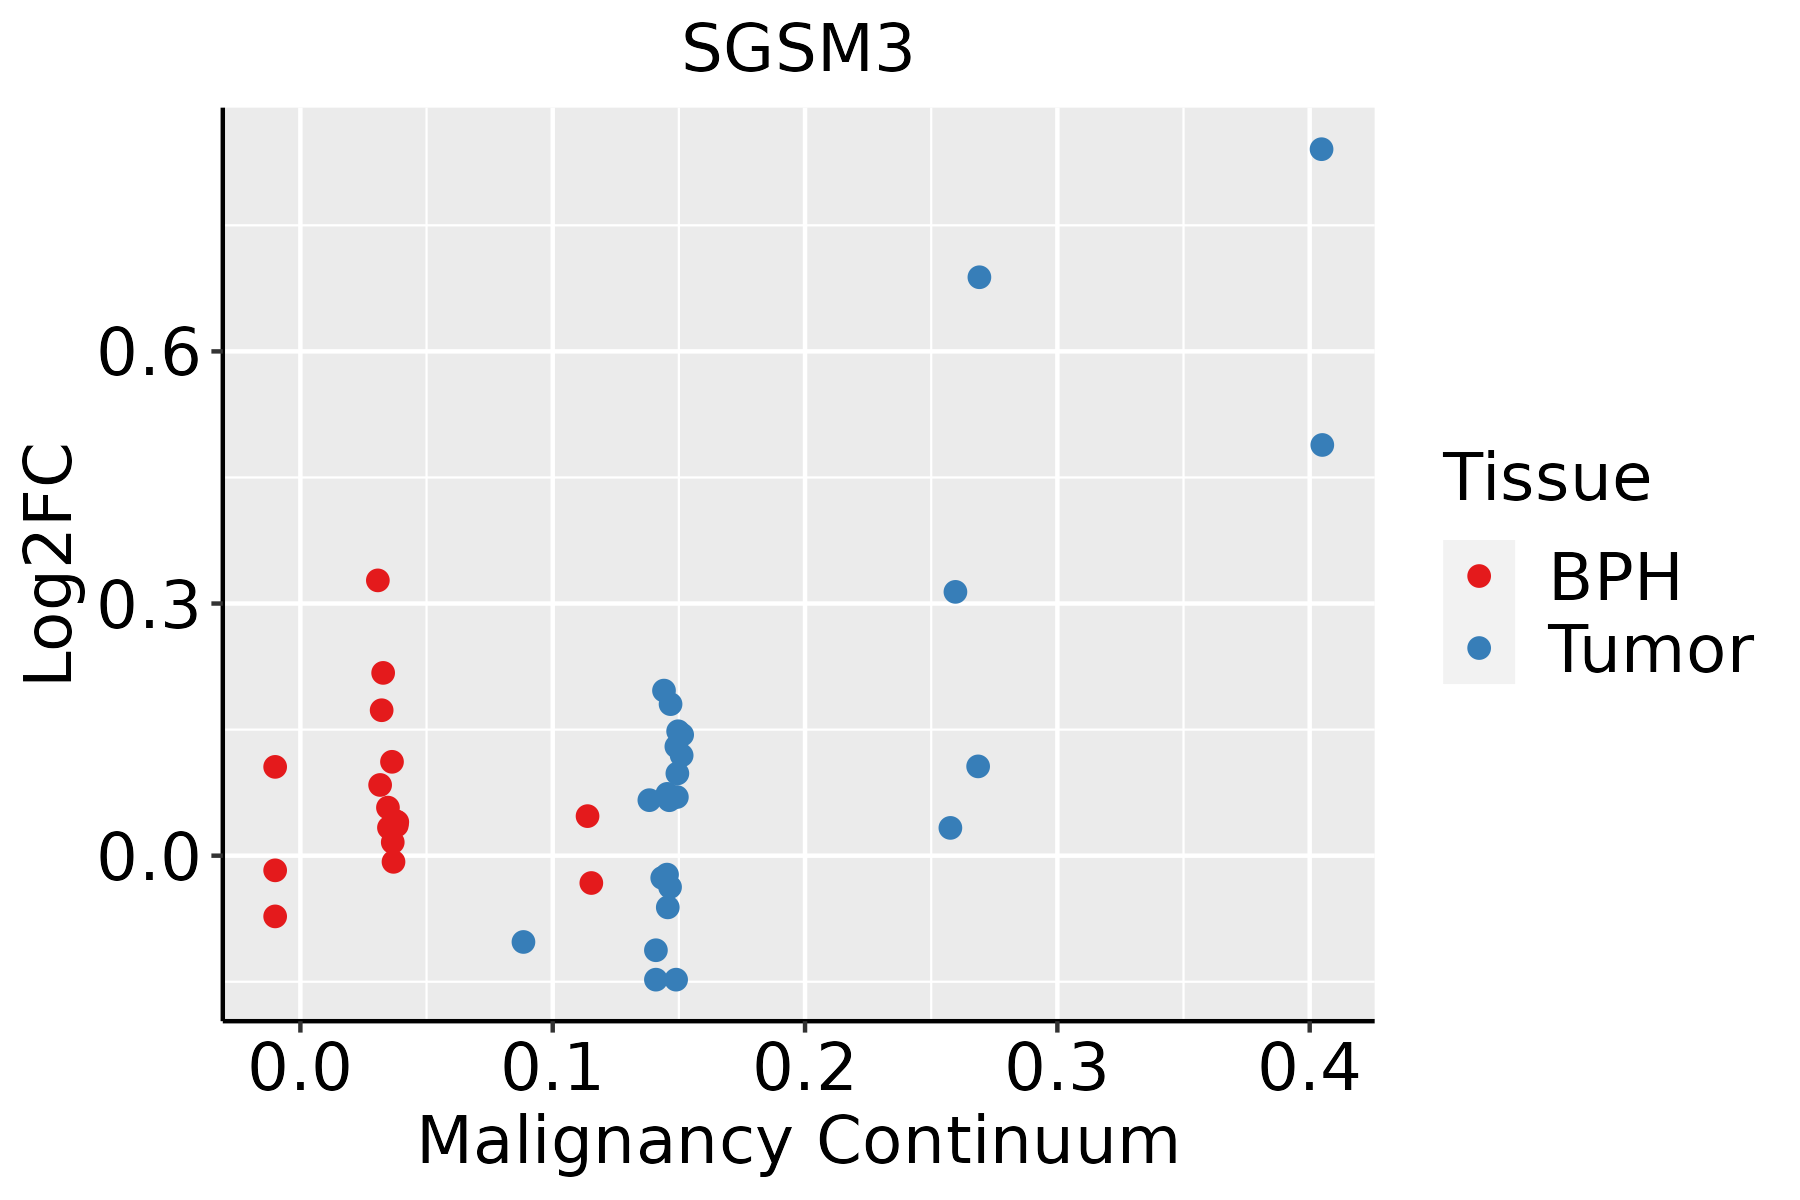 | BPH: Benign Prostatic Hyperplasia |
| Skin |  | AK: Actinic keratosis |
| cSCC: Cutaneous squamous cell carcinoma |
| SCCIS:squamous cell carcinoma in situ |
| GO ID | Tissue | Disease Stage | Description | Gene Ratio | Bg Ratio | pvalue | p.adjust | Count |
| GO:0042176 | Colorectum | AD | regulation of protein catabolic process | 160/3918 | 391/18723 | 1.06e-19 | 7.34e-17 | 160 |
| GO:0009896 | Colorectum | AD | positive regulation of catabolic process | 180/3918 | 492/18723 | 4.33e-16 | 1.94e-13 | 180 |
| GO:0045732 | Colorectum | AD | positive regulation of protein catabolic process | 92/3918 | 231/18723 | 3.85e-11 | 4.47e-09 | 92 |
| GO:0043087 | Colorectum | AD | regulation of GTPase activity | 110/3918 | 348/18723 | 1.64e-06 | 5.03e-05 | 110 |
| GO:0007265 | Colorectum | AD | Ras protein signal transduction | 104/3918 | 337/18723 | 1.01e-05 | 2.35e-04 | 104 |
| GO:0051056 | Colorectum | AD | regulation of small GTPase mediated signal transduction | 94/3918 | 302/18723 | 1.81e-05 | 3.76e-04 | 94 |
| GO:0043547 | Colorectum | AD | positive regulation of GTPase activity | 75/3918 | 255/18723 | 7.95e-04 | 7.91e-03 | 75 |
| GO:0046578 | Colorectum | AD | regulation of Ras protein signal transduction | 56/3918 | 189/18723 | 2.85e-03 | 2.14e-02 | 56 |
| GO:00421761 | Colorectum | SER | regulation of protein catabolic process | 126/2897 | 391/18723 | 5.33e-17 | 2.52e-14 | 126 |
| GO:00457321 | Colorectum | SER | positive regulation of protein catabolic process | 77/2897 | 231/18723 | 9.91e-12 | 1.90e-09 | 77 |
| GO:00098961 | Colorectum | SER | positive regulation of catabolic process | 132/2897 | 492/18723 | 4.16e-11 | 6.72e-09 | 132 |
| GO:00430871 | Colorectum | SER | regulation of GTPase activity | 77/2897 | 348/18723 | 5.90e-04 | 8.07e-03 | 77 |
| GO:00421762 | Colorectum | MSS | regulation of protein catabolic process | 145/3467 | 391/18723 | 2.03e-18 | 1.17e-15 | 145 |
| GO:00098962 | Colorectum | MSS | positive regulation of catabolic process | 163/3467 | 492/18723 | 3.10e-15 | 9.22e-13 | 163 |
| GO:00457322 | Colorectum | MSS | positive regulation of protein catabolic process | 85/3467 | 231/18723 | 3.66e-11 | 4.57e-09 | 85 |
| GO:00430872 | Colorectum | MSS | regulation of GTPase activity | 101/3467 | 348/18723 | 1.00e-06 | 3.46e-05 | 101 |
| GO:00072651 | Colorectum | MSS | Ras protein signal transduction | 91/3467 | 337/18723 | 7.20e-05 | 1.21e-03 | 91 |
| GO:00510561 | Colorectum | MSS | regulation of small GTPase mediated signal transduction | 82/3467 | 302/18723 | 1.31e-04 | 1.99e-03 | 82 |
| GO:00435471 | Colorectum | MSS | positive regulation of GTPase activity | 68/3467 | 255/18723 | 7.97e-04 | 8.38e-03 | 68 |
| GO:004217627 | Esophagus | HGIN | regulation of protein catabolic process | 119/2587 | 391/18723 | 8.09e-18 | 2.43e-15 | 119 |
| Hugo Symbol | Variant Class | Variant Classification | dbSNP RS | HGVSc | HGVSp | HGVSp Short | SWISSPROT | BIOTYPE | SIFT | PolyPhen | Tumor Sample Barcode | Tissue | Histology | Sex | Age | Stage | Therapy Types | Drugs | Outcome |
| SGSM3 | SNV | Missense_Mutation | rs763175054 | c.1964N>A | p.Arg655His | p.R655H | Q96HU1 | protein_coding | deleterious(0) | probably_damaging(0.987) | TCGA-A7-A0CJ-01 | Breast | breast invasive carcinoma | Female | <65 | I/II | Chemotherapy | cytoxan | SD |
| SGSM3 | SNV | Missense_Mutation | | c.241C>G | p.Leu81Val | p.L81V | Q96HU1 | protein_coding | deleterious(0.02) | possibly_damaging(0.49) | TCGA-A7-A3J0-01 | Breast | breast invasive carcinoma | Female | <65 | I/II | Hormone Therapy | anastrazole | SD |
| SGSM3 | SNV | Missense_Mutation | novel | c.2204N>G | p.Asp735Gly | p.D735G | Q96HU1 | protein_coding | deleterious(0) | probably_damaging(0.945) | TCGA-A8-A09Z-01 | Breast | breast invasive carcinoma | Female | >=65 | I/II | Unknown | Unknown | SD |
| SGSM3 | SNV | Missense_Mutation | rs201620185 | c.1066N>T | p.Arg356Trp | p.R356W | Q96HU1 | protein_coding | deleterious(0.01) | possibly_damaging(0.453) | TCGA-C8-A1HG-01 | Breast | breast invasive carcinoma | Female | <65 | I/II | Unknown | Unknown | SD |
| SGSM3 | SNV | Missense_Mutation | | c.1054G>C | p.Gly352Arg | p.G352R | Q96HU1 | protein_coding | tolerated(0.33) | benign(0) | TCGA-C8-A26W-01 | Breast | breast invasive carcinoma | Female | <65 | I/II | Chemotherapy | doxorubicin | CR |
| SGSM3 | SNV | Missense_Mutation | novel | c.1183N>G | p.Gln395Glu | p.Q395E | Q96HU1 | protein_coding | deleterious(0.03) | benign(0.003) | TCGA-PE-A5DE-01 | Breast | breast invasive carcinoma | Female | <65 | I/II | Chemotherapy | taxotere | CR |
| SGSM3 | SNV | Missense_Mutation | novel | c.796N>T | p.Leu266Phe | p.L266F | Q96HU1 | protein_coding | deleterious(0.02) | possibly_damaging(0.897) | TCGA-2W-A8YY-01 | Cervix | cervical & endocervical cancer | Female | <65 | I/II | Chemotherapy | cisplatin | CR |
| SGSM3 | SNV | Missense_Mutation | rs781040855 | c.1414G>A | p.Glu472Lys | p.E472K | Q96HU1 | protein_coding | deleterious(0.03) | benign(0.221) | TCGA-DS-A0VL-01 | Cervix | cervical & endocervical cancer | Female | <65 | I/II | Unknown | Unknown | SD |
| SGSM3 | SNV | Missense_Mutation | rs376746554 | c.862N>A | p.Val288Met | p.V288M | Q96HU1 | protein_coding | deleterious(0) | possibly_damaging(0.862) | TCGA-EA-A3HS-01 | Cervix | cervical & endocervical cancer | Female | <65 | I/II | Unknown | Unknown | SD |
| SGSM3 | SNV | Missense_Mutation | rs547805871 | c.655N>A | p.Asp219Asn | p.D219N | Q96HU1 | protein_coding | tolerated(0.11) | benign(0.111) | TCGA-EK-A2PG-01 | Cervix | cervical & endocervical cancer | Female | >=65 | I/II | Unknown | Unknown | SD |


