
|
|||||
|
 | |
| |
| |
| |
| |
| |
|
Gene: SGSH |
Gene summary for SGSH |
| Gene information | Species | Human | Gene symbol | SGSH | Gene ID | 6448 |
| Gene name | N-sulfoglucosamine sulfohydrolase | |
| Gene Alias | HSS | |
| Cytomap | 17q25.3 | |
| Gene Type | protein-coding | GO ID | GO:0006022 | UniProtAcc | P51688 |
Top |
Malignant transformation analysis |
| Identification of the aberrant gene expression in precancerous and cancerous lesions by comparing the gene expression of stem-like cells in diseased tissues with normal stem cells |
| Entrez ID | Symbol | Replicates | Species | Organ | Tissue | Adj P-value | Log2FC | Malignancy |
| 6448 | SGSH | LZE24T | Human | Esophagus | ESCC | 1.27e-07 | 1.16e-01 | 0.0596 |
| 6448 | SGSH | P1T-E | Human | Esophagus | ESCC | 9.80e-04 | 1.43e-01 | 0.0875 |
| 6448 | SGSH | P2T-E | Human | Esophagus | ESCC | 2.23e-09 | 4.25e-02 | 0.1177 |
| 6448 | SGSH | P4T-E | Human | Esophagus | ESCC | 1.11e-03 | 4.64e-02 | 0.1323 |
| 6448 | SGSH | P8T-E | Human | Esophagus | ESCC | 4.03e-16 | 1.66e-01 | 0.0889 |
| 6448 | SGSH | P9T-E | Human | Esophagus | ESCC | 3.16e-02 | 8.07e-02 | 0.1131 |
| 6448 | SGSH | P10T-E | Human | Esophagus | ESCC | 3.97e-09 | 1.39e-01 | 0.116 |
| 6448 | SGSH | P11T-E | Human | Esophagus | ESCC | 5.29e-06 | 2.81e-01 | 0.1426 |
| 6448 | SGSH | P12T-E | Human | Esophagus | ESCC | 3.45e-20 | 2.16e-01 | 0.1122 |
| 6448 | SGSH | P15T-E | Human | Esophagus | ESCC | 1.85e-14 | 2.69e-01 | 0.1149 |
| 6448 | SGSH | P16T-E | Human | Esophagus | ESCC | 1.08e-16 | 2.44e-01 | 0.1153 |
| 6448 | SGSH | P17T-E | Human | Esophagus | ESCC | 2.54e-02 | 9.98e-02 | 0.1278 |
| 6448 | SGSH | P20T-E | Human | Esophagus | ESCC | 2.48e-24 | 4.32e-01 | 0.1124 |
| 6448 | SGSH | P21T-E | Human | Esophagus | ESCC | 3.30e-15 | 1.99e-01 | 0.1617 |
| 6448 | SGSH | P22T-E | Human | Esophagus | ESCC | 3.21e-05 | 3.08e-02 | 0.1236 |
| 6448 | SGSH | P23T-E | Human | Esophagus | ESCC | 6.38e-12 | 2.01e-01 | 0.108 |
| 6448 | SGSH | P26T-E | Human | Esophagus | ESCC | 8.83e-09 | 1.29e-01 | 0.1276 |
| 6448 | SGSH | P27T-E | Human | Esophagus | ESCC | 3.40e-15 | 1.39e-01 | 0.1055 |
| 6448 | SGSH | P28T-E | Human | Esophagus | ESCC | 1.13e-05 | 1.18e-01 | 0.1149 |
| 6448 | SGSH | P30T-E | Human | Esophagus | ESCC | 2.37e-04 | 2.27e-01 | 0.137 |
| Page: 1 2 3 |
| Tissue | Expression Dynamics | Abbreviation |
| Esophagus | 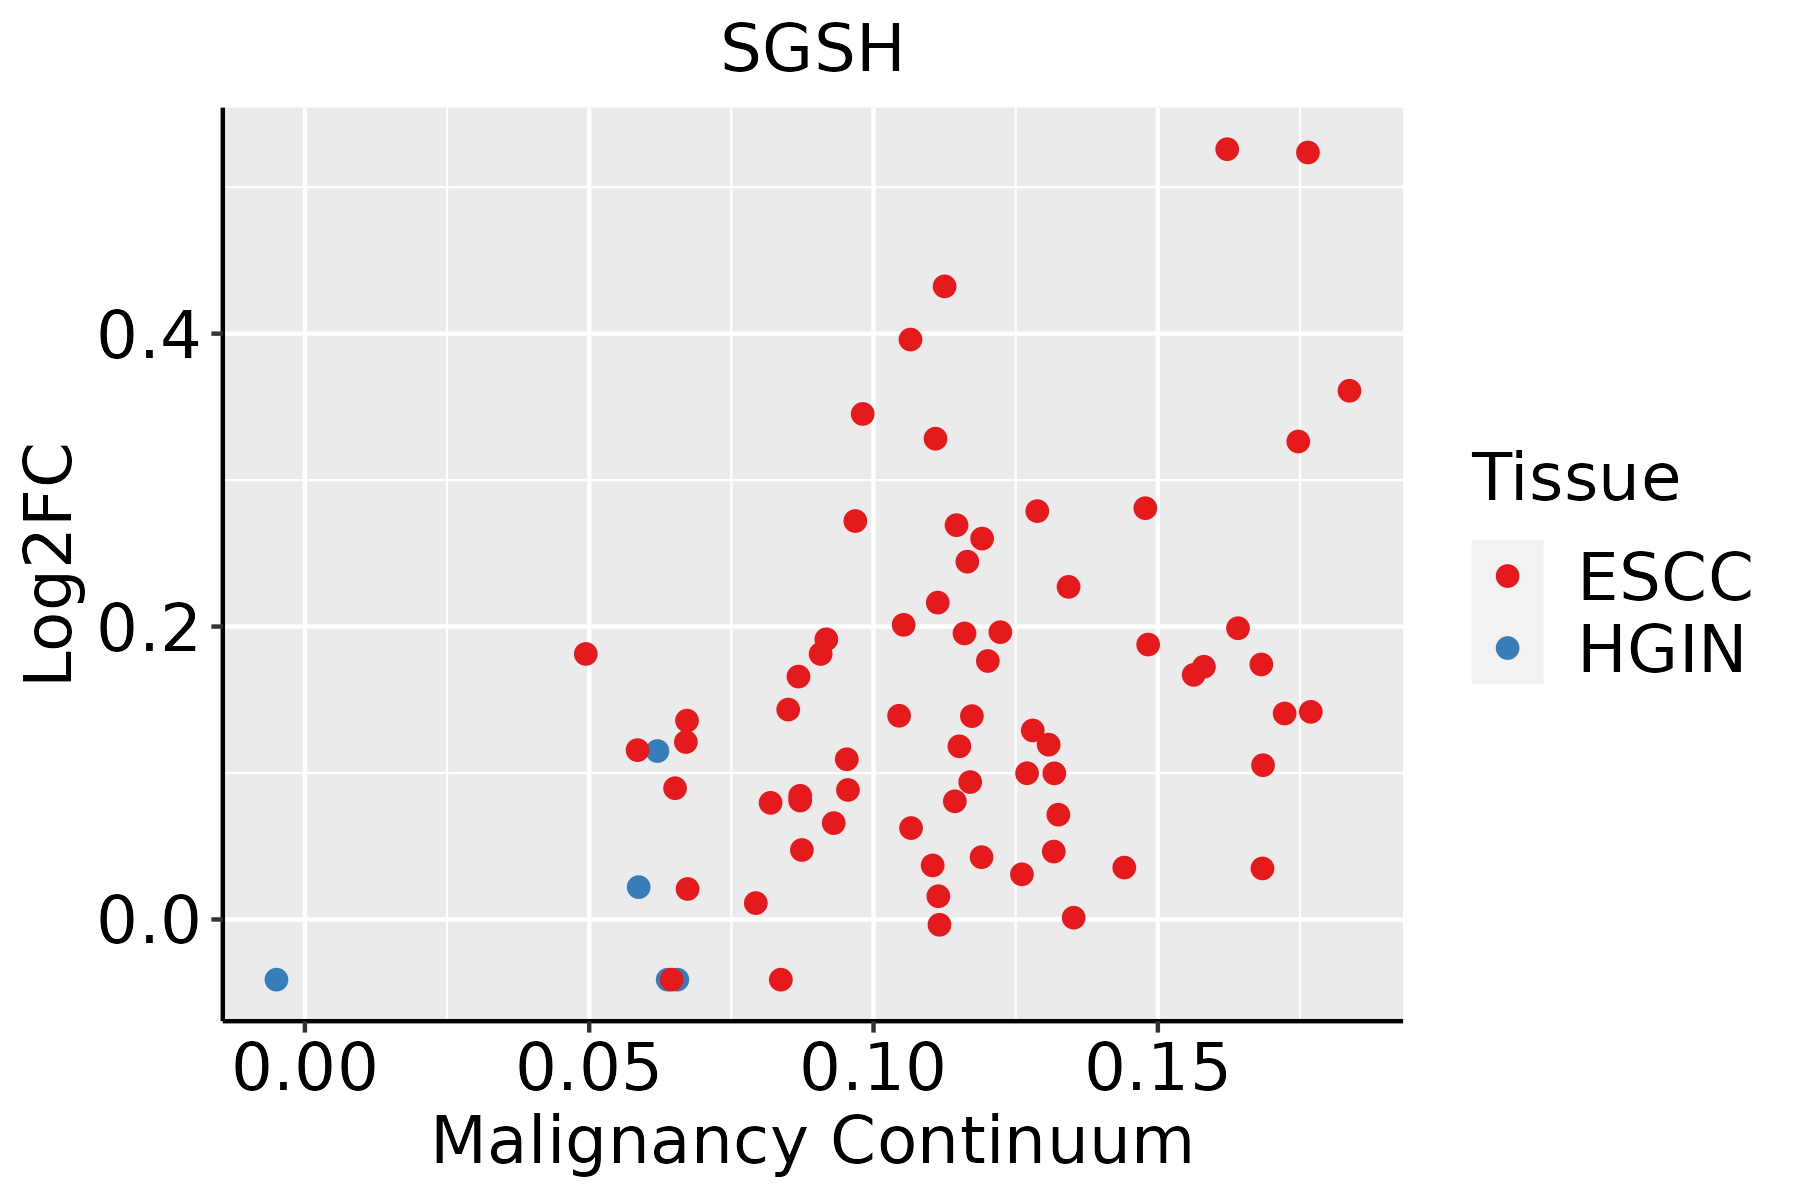 | ESCC: Esophageal squamous cell carcinoma |
| HGIN: High-grade intraepithelial neoplasias | ||
| LGIN: Low-grade intraepithelial neoplasias | ||
| Liver | 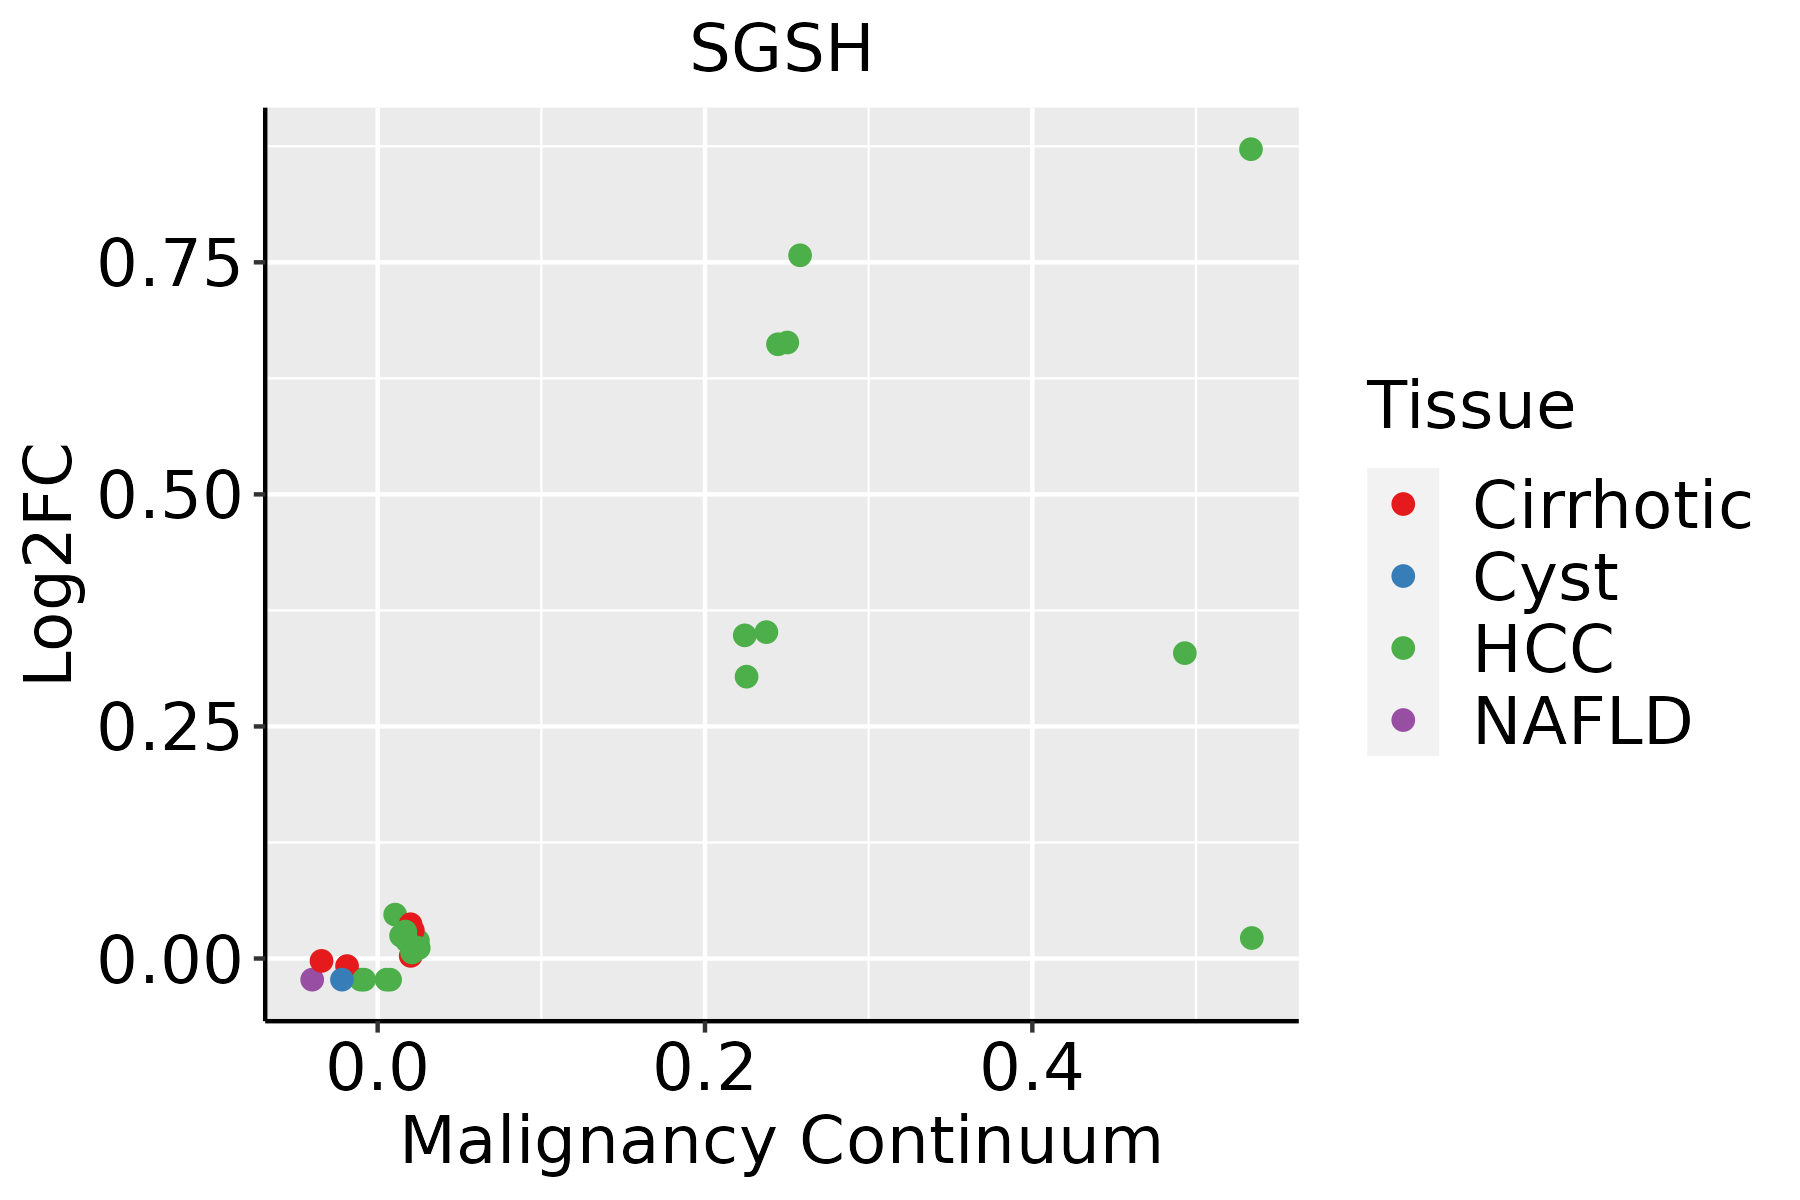 | HCC: Hepatocellular carcinoma |
| NAFLD: Non-alcoholic fatty liver disease |
| ∗log2FC in expression of this searched gene in stem-like cells from each diseased tissue sample relative to stem-like cells in normal samples in each tissue plotted against the malignancy continuum. Samples are colored based on if they are from different disease stage. |
Top |
Malignant transformation related pathway analysis |
| Find out the enriched GO biological processes and KEGG pathways involved in transition from healthy to precancer to cancer |
| Tissue | Disease Stage | Enriched GO biological Processes |
| Colorectum | AD |  |
| Colorectum | SER |  |
| Colorectum | MSS |  |
| Colorectum | MSI-H |  |
| Colorectum | FAP |  |
| ∗Top 15 enriched GO BP terms are showed in the bar plot of each disease state in each tissue. Each row represents a significant GO biological process which is colored according to the -log10(p.adjust). |
| Page: 1 2 3 4 5 6 7 8 9 |
| GO ID | Tissue | Disease Stage | Description | Gene Ratio | Bg Ratio | pvalue | p.adjust | Count |
| GO:00091002 | Esophagus | ESCC | glycoprotein metabolic process | 226/8552 | 387/18723 | 2.64e-07 | 3.94e-06 | 226 |
| GO:19011362 | Esophagus | ESCC | carbohydrate derivative catabolic process | 99/8552 | 172/18723 | 1.11e-03 | 5.54e-03 | 99 |
| GO:0006029 | Esophagus | ESCC | proteoglycan metabolic process | 48/8552 | 79/18723 | 4.93e-03 | 1.89e-02 | 48 |
| GO:0030201 | Esophagus | ESCC | heparan sulfate proteoglycan metabolic process | 21/8552 | 31/18723 | 1.10e-02 | 3.70e-02 | 21 |
| GO:0006516 | Esophagus | ESCC | glycoprotein catabolic process | 19/8552 | 28/18723 | 1.49e-02 | 4.84e-02 | 19 |
| GO:1901136 | Liver | HCC | carbohydrate derivative catabolic process | 98/7958 | 172/18723 | 8.71e-05 | 7.62e-04 | 98 |
| GO:0009100 | Liver | HCC | glycoprotein metabolic process | 193/7958 | 387/18723 | 1.89e-03 | 9.62e-03 | 193 |
| Page: 1 |
| Pathway ID | Tissue | Disease Stage | Description | Gene Ratio | Bg Ratio | pvalue | p.adjust | qvalue | Count |
| hsa0414222 | Esophagus | ESCC | Lysosome | 102/4205 | 132/8465 | 5.11e-11 | 7.13e-10 | 3.65e-10 | 102 |
| hsa0414232 | Esophagus | ESCC | Lysosome | 102/4205 | 132/8465 | 5.11e-11 | 7.13e-10 | 3.65e-10 | 102 |
| hsa041422 | Liver | HCC | Lysosome | 100/4020 | 132/8465 | 2.32e-11 | 4.31e-10 | 2.40e-10 | 100 |
| hsa041423 | Liver | HCC | Lysosome | 100/4020 | 132/8465 | 2.32e-11 | 4.31e-10 | 2.40e-10 | 100 |
| Page: 1 |
Top |
Cell-cell communication analysis |
| Identification of potential cell-cell interactions between two cell types and their ligand-receptor pairs for different disease states |
| Ligand | Receptor | LRpair | Pathway | Tissue | Disease Stage |
| Page: 1 |
Top |
Single-cell gene regulatory network inference analysis |
| Find out the significant the regulons (TFs) and the target genes of each regulon across cell types for different disease states |
| TF | Cell Type | Tissue | Disease Stage | Target Gene | RSS | Regulon Activity |
| ∗The dot plots of a searched regulon are shown for all cell subpopulations in each disease state of each tissue based on the regulon specific score inferred using pySCENIC and by calculating the average expression. |
| Page: 1 |
Top |
Somatic mutation of malignant transformation related genes |
| Annotation of somatic variants for genes involved in malignant transformation |
| Hugo Symbol | Variant Class | Variant Classification | dbSNP RS | HGVSc | HGVSp | HGVSp Short | SWISSPROT | BIOTYPE | SIFT | PolyPhen | Tumor Sample Barcode | Tissue | Histology | Sex | Age | Stage | Therapy Types | Drugs | Outcome |
| SGSH | SNV | Missense_Mutation | c.496N>G | p.Gln166Glu | p.Q166E | P51688 | protein_coding | tolerated(0.43) | benign(0.014) | TCGA-A7-A13D-01 | Breast | breast invasive carcinoma | Female | <65 | I/II | Chemotherapy | cytoxan | SD | |
| SGSH | SNV | Missense_Mutation | c.926N>T | p.Ser309Ile | p.S309I | P51688 | protein_coding | deleterious(0) | probably_damaging(0.972) | TCGA-D8-A1X8-01 | Breast | breast invasive carcinoma | Female | <65 | III/IV | Chemotherapy | adrimicin+cyclophosphamide | SD | |
| SGSH | SNV | Missense_Mutation | rs777267343 | c.1297N>T | p.Arg433Trp | p.R433W | P51688 | protein_coding | deleterious(0) | probably_damaging(1) | TCGA-2W-A8YY-01 | Cervix | cervical & endocervical cancer | Female | <65 | I/II | Chemotherapy | cisplatin | CR |
| SGSH | SNV | Missense_Mutation | rs780969693 | c.1444N>A | p.Ala482Thr | p.A482T | P51688 | protein_coding | tolerated(0.06) | benign(0.382) | TCGA-CM-6171-01 | Colorectum | colon adenocarcinoma | Female | >=65 | I/II | Unknown | Unknown | SD |
| SGSH | SNV | Missense_Mutation | rs767834681 | c.598G>A | p.Gly200Arg | p.G200R | P51688 | protein_coding | tolerated(0.18) | probably_damaging(0.999) | TCGA-G4-6588-01 | Colorectum | colon adenocarcinoma | Female | <65 | I/II | Unknown | Unknown | SD |
| SGSH | SNV | Missense_Mutation | c.691N>A | p.Ala231Thr | p.A231T | P51688 | protein_coding | tolerated(0.11) | benign(0.209) | TCGA-QG-A5Z2-01 | Colorectum | colon adenocarcinoma | Male | <65 | I/II | Unknown | Unknown | SD | |
| SGSH | SNV | Missense_Mutation | c.919C>G | p.Gln307Glu | p.Q307E | P51688 | protein_coding | tolerated(0.47) | benign(0.013) | TCGA-AG-A026-01 | Colorectum | rectum adenocarcinoma | Male | >=65 | I/II | Unknown | Unknown | PD | |
| SGSH | SNV | Missense_Mutation | novel | c.893N>T | p.Ser298Phe | p.S298F | P51688 | protein_coding | deleterious(0) | probably_damaging(0.995) | TCGA-F5-6814-01 | Colorectum | rectum adenocarcinoma | Male | <65 | I/II | Unknown | Unknown | SD |
| SGSH | insertion | Frame_Shift_Ins | novel | c.493_494insG | p.Thr165SerfsTer4 | p.T165Sfs*4 | P51688 | protein_coding | TCGA-A6-5665-01 | Colorectum | colon adenocarcinoma | Female | >=65 | I/II | Unknown | Unknown | PD | ||
| SGSH | SNV | Missense_Mutation | novel | c.207N>A | p.Ser69Arg | p.S69R | P51688 | protein_coding | deleterious(0) | probably_damaging(1) | TCGA-A5-A0G1-01 | Endometrium | uterine corpus endometrioid carcinoma | Female | >=65 | I/II | Unknown | Unknown | SD |
| Page: 1 2 3 4 |
Top |
Related drugs of malignant transformation related genes |
| Identification of chemicals and drugs interact with genes involved in malignant transfromation |
| (DGIdb 4.0) |
| Entrez ID | Symbol | Category | Interaction Types | Drug Claim Name | Drug Name | PMIDs |
| 6448 | SGSH | DRUGGABLE GENOME, ENZYME | HGT-1410 | N-SULFOGLUCOSAMINE SULFOHYDROLASE RECOMBINANT |
| Page: 1 |

Copyright 2023-Present -The University of Texas Health Science Center at Houston |