
|
|||||
|
 | |
| |
| |
| |
| |
| |
|
Gene: SGPP2 |
Gene summary for SGPP2 |
| Gene information | Species | Human | Gene symbol | SGPP2 | Gene ID | 130367 |
| Gene name | sphingosine-1-phosphate phosphatase 2 | |
| Gene Alias | SPP2 | |
| Cytomap | 2q36.1 | |
| Gene Type | protein-coding | GO ID | GO:0006066 | UniProtAcc | Q8IWX5 |
Top |
Malignant transformation analysis |
| Identification of the aberrant gene expression in precancerous and cancerous lesions by comparing the gene expression of stem-like cells in diseased tissues with normal stem cells |
| Entrez ID | Symbol | Replicates | Species | Organ | Tissue | Adj P-value | Log2FC | Malignancy |
| 130367 | SGPP2 | CCI_2 | Human | Cervix | CC | 5.84e-12 | 1.24e+00 | 0.5249 |
| 130367 | SGPP2 | CCI_3 | Human | Cervix | CC | 1.98e-11 | 8.98e-01 | 0.516 |
| 130367 | SGPP2 | sample3 | Human | Cervix | CC | 2.05e-05 | 6.60e-02 | 0.1387 |
| 130367 | SGPP2 | H2 | Human | Cervix | HSIL_HPV | 1.50e-03 | 2.58e-01 | 0.0632 |
| 130367 | SGPP2 | HTA11_3410_2000001011 | Human | Colorectum | AD | 4.85e-02 | -2.80e-01 | 0.0155 |
| 130367 | SGPP2 | HTA11_347_2000001011 | Human | Colorectum | AD | 1.90e-10 | 5.44e-01 | -0.1954 |
| 130367 | SGPP2 | HTA11_99999965062_69753 | Human | Colorectum | MSI-H | 7.92e-04 | 9.45e-01 | 0.3487 |
| 130367 | SGPP2 | HTA11_99999974143_84620 | Human | Colorectum | MSS | 7.42e-10 | -4.01e-01 | 0.3005 |
| 130367 | SGPP2 | A015-C-203 | Human | Colorectum | FAP | 6.22e-25 | -4.94e-01 | -0.1294 |
| 130367 | SGPP2 | A015-C-204 | Human | Colorectum | FAP | 5.00e-04 | -3.04e-01 | -0.0228 |
| 130367 | SGPP2 | A002-C-201 | Human | Colorectum | FAP | 4.88e-12 | -4.27e-01 | 0.0324 |
| 130367 | SGPP2 | A002-C-203 | Human | Colorectum | FAP | 1.33e-03 | -2.02e-01 | 0.2786 |
| 130367 | SGPP2 | A001-C-119 | Human | Colorectum | FAP | 4.89e-05 | -3.74e-01 | -0.1557 |
| 130367 | SGPP2 | A001-C-108 | Human | Colorectum | FAP | 6.23e-18 | -3.57e-01 | -0.0272 |
| 130367 | SGPP2 | A002-C-205 | Human | Colorectum | FAP | 7.35e-16 | -4.84e-01 | -0.1236 |
| 130367 | SGPP2 | A001-C-104 | Human | Colorectum | FAP | 1.17e-05 | -2.87e-01 | 0.0184 |
| 130367 | SGPP2 | A015-C-005 | Human | Colorectum | FAP | 2.59e-03 | -3.34e-01 | -0.0336 |
| 130367 | SGPP2 | A015-C-006 | Human | Colorectum | FAP | 3.78e-08 | -3.96e-01 | -0.0994 |
| 130367 | SGPP2 | A015-C-106 | Human | Colorectum | FAP | 3.17e-10 | -2.92e-01 | -0.0511 |
| 130367 | SGPP2 | A002-C-114 | Human | Colorectum | FAP | 3.58e-13 | -4.71e-01 | -0.1561 |
| Page: 1 2 3 4 5 6 7 8 |
| Tissue | Expression Dynamics | Abbreviation |
| Cervix |  | CC: Cervix cancer |
| HSIL_HPV: HPV-infected high-grade squamous intraepithelial lesions | ||
| N_HPV: HPV-infected normal cervix | ||
| Colorectum (GSE201348) | 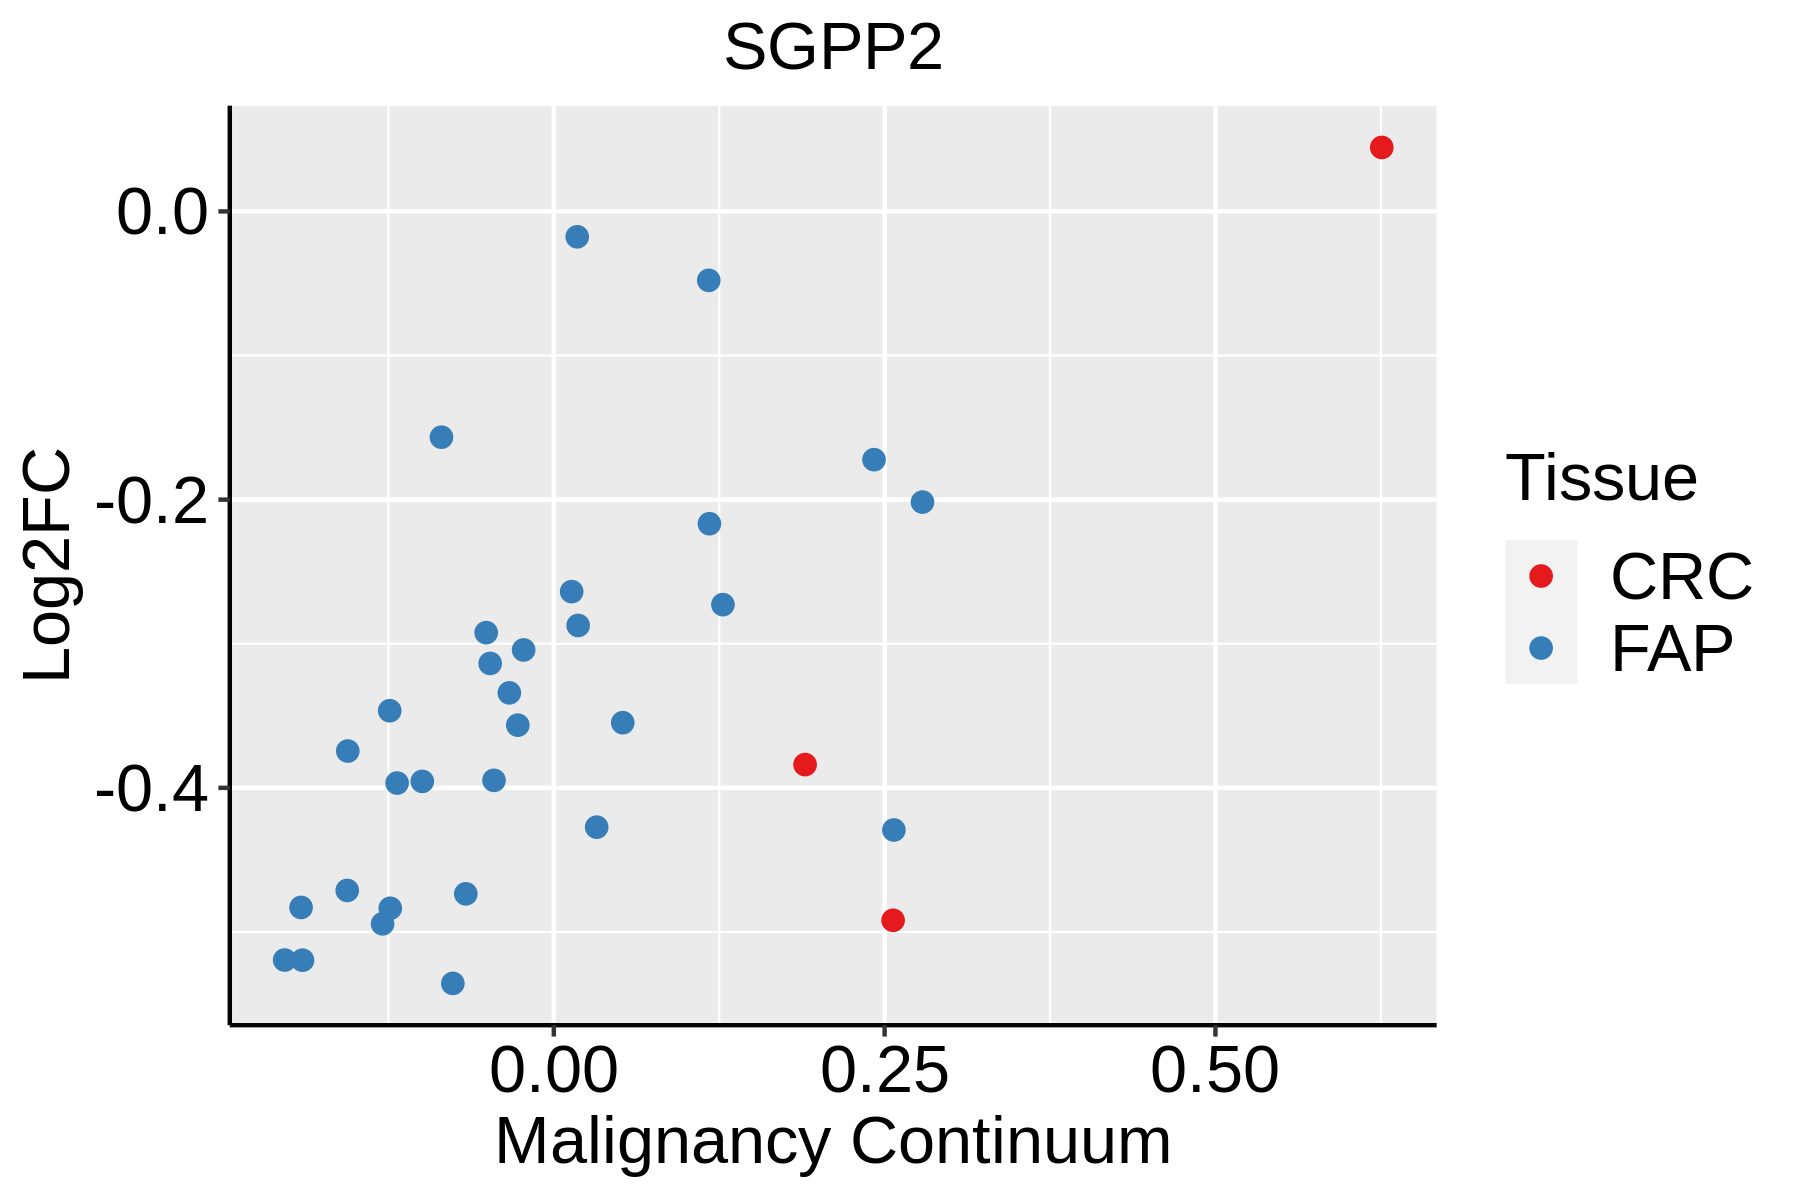 | FAP: Familial adenomatous polyposis |
| CRC: Colorectal cancer | ||
| Colorectum (HTA11) |  | AD: Adenomas |
| SER: Sessile serrated lesions | ||
| MSI-H: Microsatellite-high colorectal cancer | ||
| MSS: Microsatellite stable colorectal cancer | ||
| Endometrium | 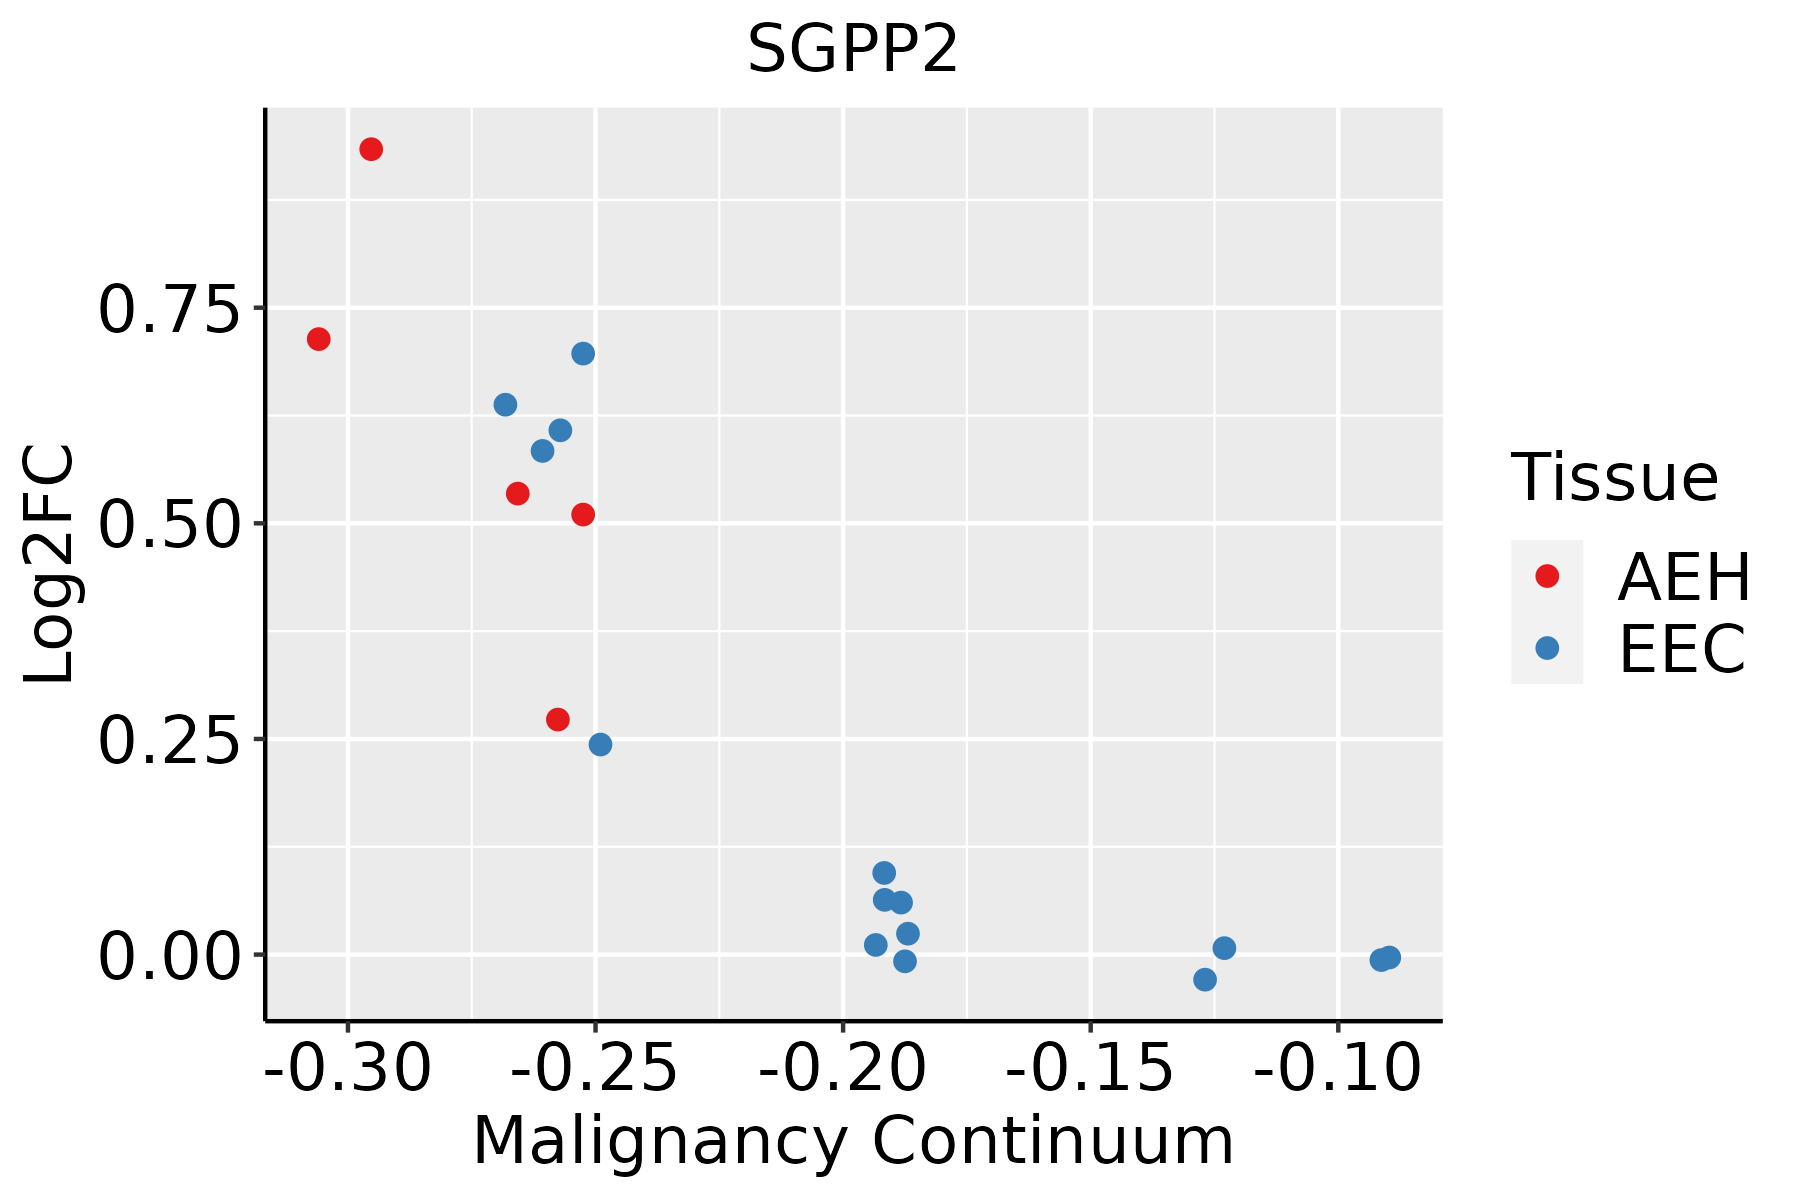 | AEH: Atypical endometrial hyperplasia |
| EEC: Endometrioid Cancer | ||
| Esophagus |  | ESCC: Esophageal squamous cell carcinoma |
| HGIN: High-grade intraepithelial neoplasias | ||
| LGIN: Low-grade intraepithelial neoplasias | ||
| Liver | 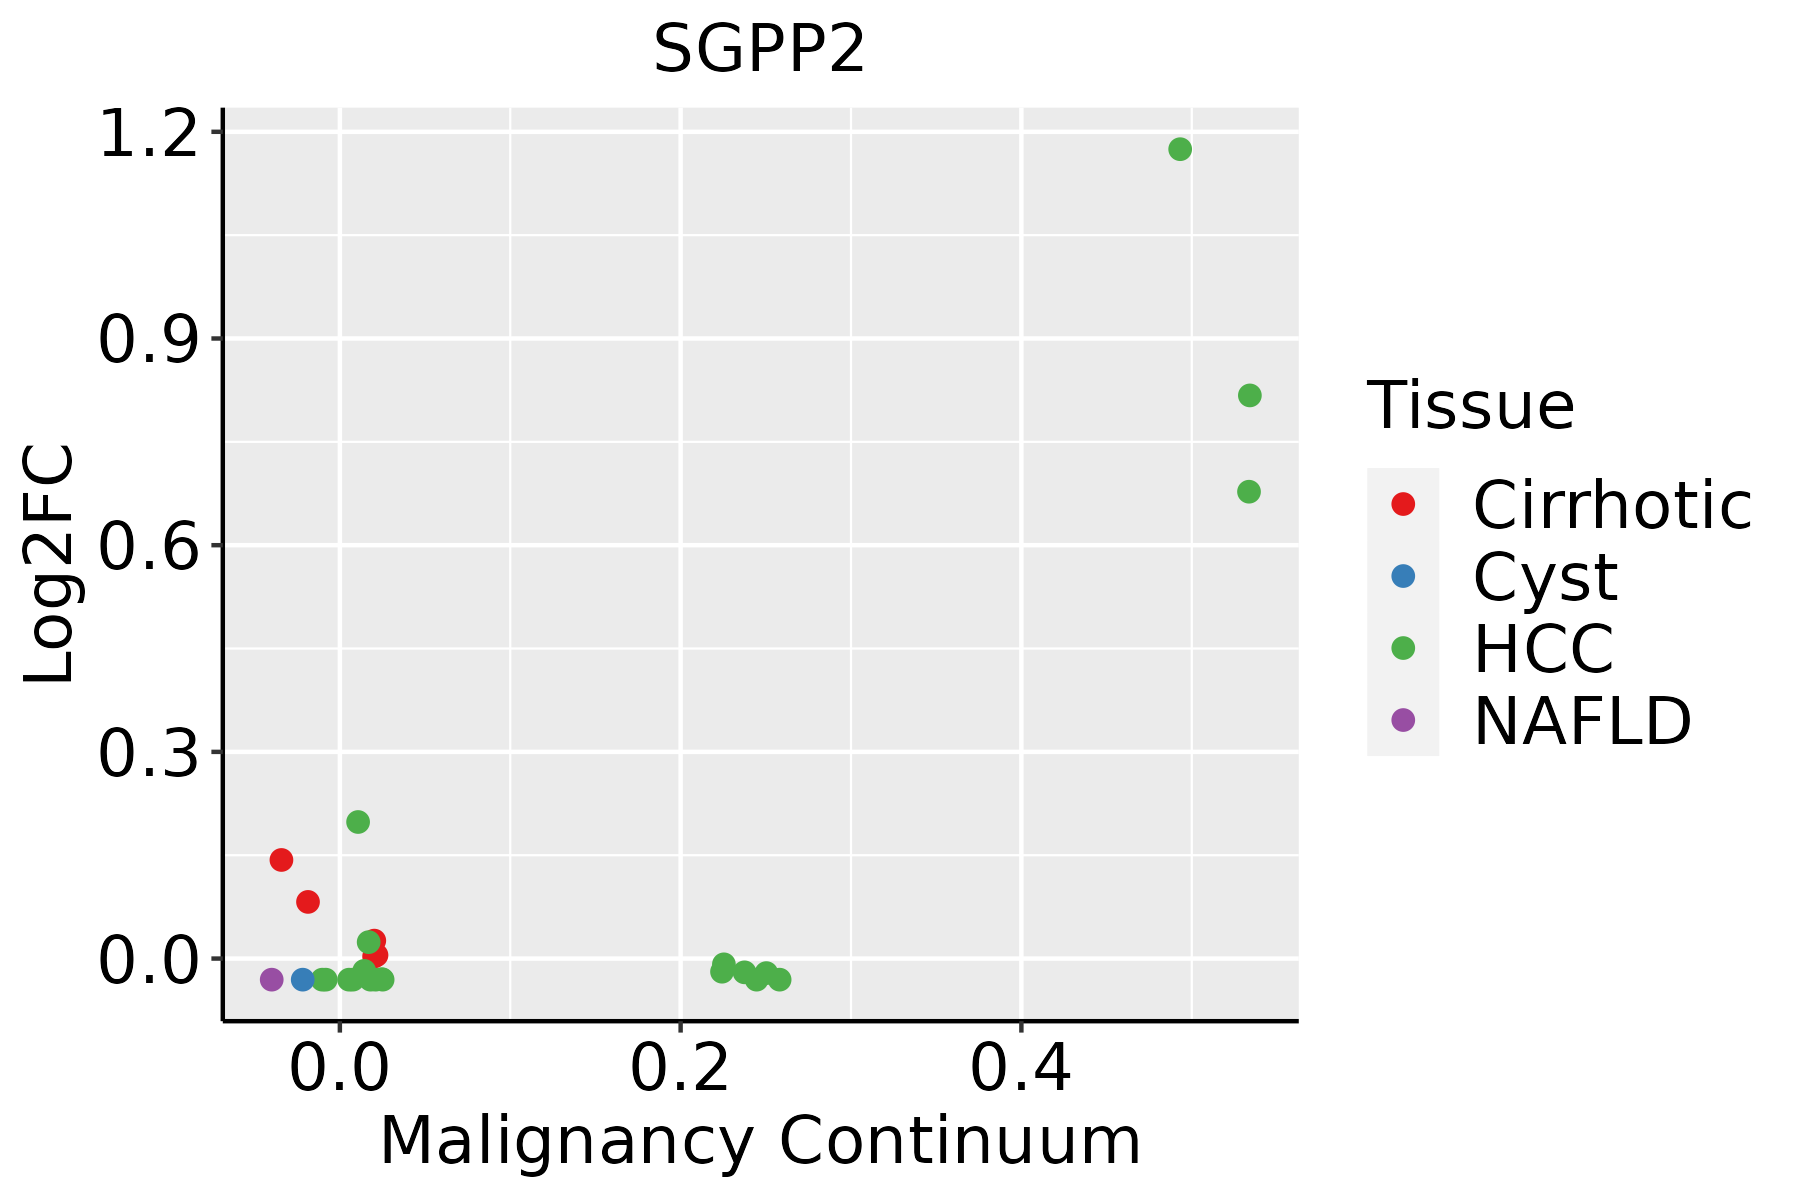 | HCC: Hepatocellular carcinoma |
| NAFLD: Non-alcoholic fatty liver disease | ||
| Lung |  | AAH: Atypical adenomatous hyperplasia |
| AIS: Adenocarcinoma in situ | ||
| IAC: Invasive lung adenocarcinoma | ||
| MIA: Minimally invasive adenocarcinoma | ||
| Oral Cavity | 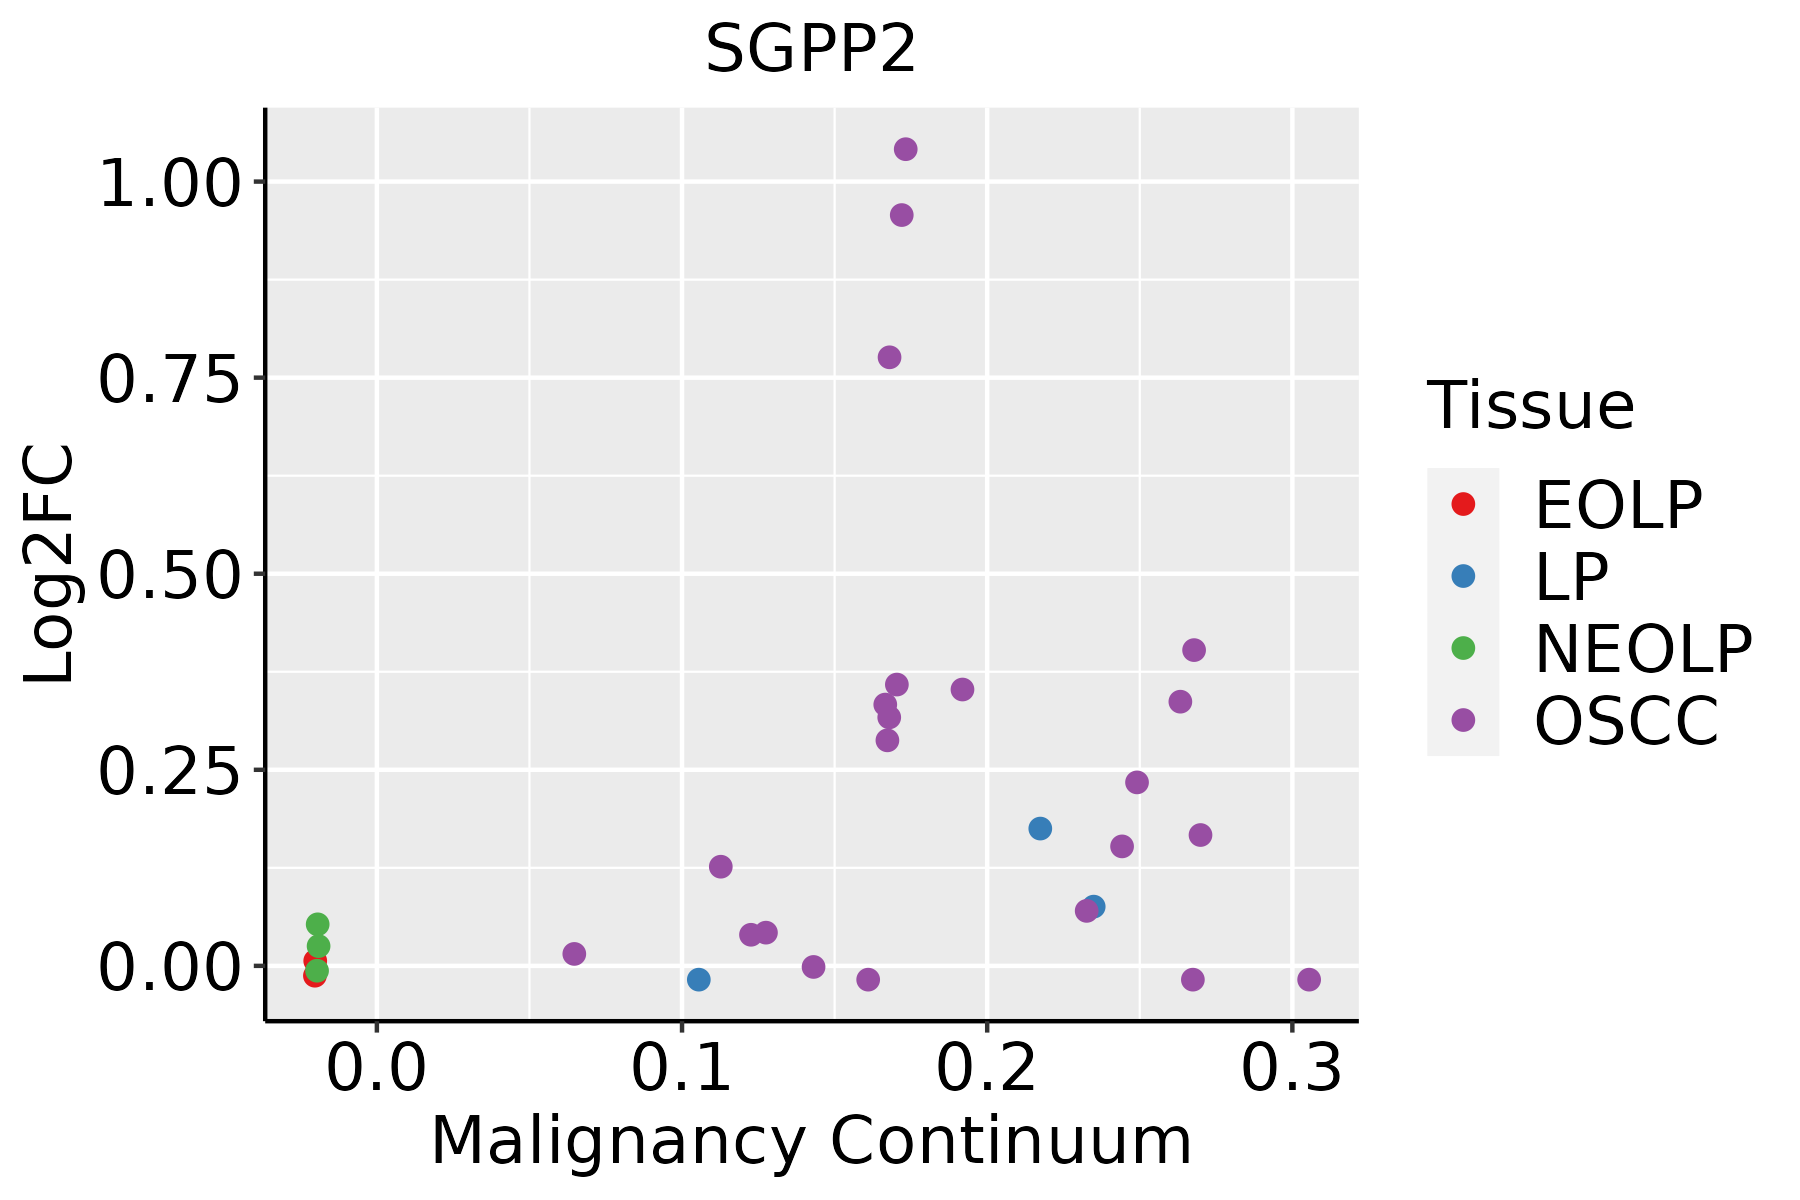 | EOLP: Erosive Oral lichen planus |
| LP: leukoplakia | ||
| NEOLP: Non-erosive oral lichen planus | ||
| OSCC: Oral squamous cell carcinoma |
| ∗log2FC in expression of this searched gene in stem-like cells from each diseased tissue sample relative to stem-like cells in normal samples in each tissue plotted against the malignancy continuum. Samples are colored based on if they are from different disease stage. |
Top |
Malignant transformation related pathway analysis |
| Find out the enriched GO biological processes and KEGG pathways involved in transition from healthy to precancer to cancer |
| Tissue | Disease Stage | Enriched GO biological Processes |
| Colorectum | AD |  |
| Colorectum | SER |  |
| Colorectum | MSS |  |
| Colorectum | MSI-H |  |
| Colorectum | FAP |  |
| ∗Top 15 enriched GO BP terms are showed in the bar plot of each disease state in each tissue. Each row represents a significant GO biological process which is colored according to the -log10(p.adjust). |
| Page: 1 2 3 4 5 6 7 8 9 |
| GO ID | Tissue | Disease Stage | Description | Gene Ratio | Bg Ratio | pvalue | p.adjust | Count |
| GO:00506737 | Cervix | CC | epithelial cell proliferation | 98/2311 | 437/18723 | 2.01e-09 | 2.15e-07 | 98 |
| GO:00506787 | Cervix | CC | regulation of epithelial cell proliferation | 83/2311 | 381/18723 | 1.31e-07 | 6.42e-06 | 83 |
| GO:00163117 | Cervix | CC | dephosphorylation | 73/2311 | 417/18723 | 1.23e-03 | 9.87e-03 | 73 |
| GO:005067314 | Cervix | HSIL_HPV | epithelial cell proliferation | 34/737 | 437/18723 | 1.31e-04 | 2.61e-03 | 34 |
| GO:005067813 | Cervix | HSIL_HPV | regulation of epithelial cell proliferation | 30/737 | 381/18723 | 2.61e-04 | 4.50e-03 | 30 |
| GO:0016311 | Colorectum | AD | dephosphorylation | 123/3918 | 417/18723 | 1.84e-05 | 3.82e-04 | 123 |
| GO:0006066 | Colorectum | AD | alcohol metabolic process | 106/3918 | 353/18723 | 3.02e-05 | 5.57e-04 | 106 |
| GO:0030258 | Colorectum | AD | lipid modification | 67/3918 | 212/18723 | 1.66e-04 | 2.27e-03 | 67 |
| GO:0050673 | Colorectum | AD | epithelial cell proliferation | 119/3918 | 437/18723 | 8.75e-04 | 8.51e-03 | 119 |
| GO:00060662 | Colorectum | MSS | alcohol metabolic process | 92/3467 | 353/18723 | 2.57e-04 | 3.46e-03 | 92 |
| GO:00506731 | Colorectum | MSS | epithelial cell proliferation | 108/3467 | 437/18723 | 6.76e-04 | 7.30e-03 | 108 |
| GO:00302582 | Colorectum | MSS | lipid modification | 57/3467 | 212/18723 | 1.64e-03 | 1.49e-02 | 57 |
| GO:00163112 | Colorectum | MSS | dephosphorylation | 101/3467 | 417/18723 | 1.98e-03 | 1.70e-02 | 101 |
| GO:0050678 | Colorectum | MSS | regulation of epithelial cell proliferation | 90/3467 | 381/18723 | 6.92e-03 | 4.45e-02 | 90 |
| GO:0034311 | Colorectum | MSI-H | diol metabolic process | 7/1319 | 29/18723 | 3.34e-03 | 4.05e-02 | 7 |
| GO:00163113 | Colorectum | FAP | dephosphorylation | 95/2622 | 417/18723 | 7.07e-07 | 3.32e-05 | 95 |
| GO:00302583 | Colorectum | FAP | lipid modification | 52/2622 | 212/18723 | 2.84e-05 | 6.49e-04 | 52 |
| GO:00506732 | Colorectum | FAP | epithelial cell proliferation | 84/2622 | 437/18723 | 1.39e-03 | 1.25e-02 | 84 |
| GO:00060663 | Colorectum | FAP | alcohol metabolic process | 69/2622 | 353/18723 | 2.29e-03 | 1.85e-02 | 69 |
| GO:0046519 | Colorectum | FAP | sphingoid metabolic process | 8/2622 | 21/18723 | 5.43e-03 | 3.53e-02 | 8 |
| Page: 1 2 3 4 |
| Pathway ID | Tissue | Disease Stage | Description | Gene Ratio | Bg Ratio | pvalue | p.adjust | qvalue | Count |
| hsa0407110 | Cervix | CC | Sphingolipid signaling pathway | 35/1267 | 121/8465 | 5.70e-05 | 3.93e-04 | 2.32e-04 | 35 |
| hsa0407113 | Cervix | CC | Sphingolipid signaling pathway | 35/1267 | 121/8465 | 5.70e-05 | 3.93e-04 | 2.32e-04 | 35 |
| hsa04071 | Colorectum | AD | Sphingolipid signaling pathway | 43/2092 | 121/8465 | 4.83e-03 | 2.28e-02 | 1.45e-02 | 43 |
| hsa040711 | Colorectum | AD | Sphingolipid signaling pathway | 43/2092 | 121/8465 | 4.83e-03 | 2.28e-02 | 1.45e-02 | 43 |
| hsa040712 | Colorectum | MSS | Sphingolipid signaling pathway | 40/1875 | 121/8465 | 3.56e-03 | 1.64e-02 | 1.01e-02 | 40 |
| hsa040713 | Colorectum | MSS | Sphingolipid signaling pathway | 40/1875 | 121/8465 | 3.56e-03 | 1.64e-02 | 1.01e-02 | 40 |
| hsa040714 | Colorectum | FAP | Sphingolipid signaling pathway | 34/1404 | 121/8465 | 9.53e-04 | 5.22e-03 | 3.17e-03 | 34 |
| hsa040715 | Colorectum | FAP | Sphingolipid signaling pathway | 34/1404 | 121/8465 | 9.53e-04 | 5.22e-03 | 3.17e-03 | 34 |
| hsa040716 | Colorectum | CRC | Sphingolipid signaling pathway | 30/1091 | 121/8465 | 2.49e-04 | 3.09e-03 | 2.09e-03 | 30 |
| hsa040717 | Colorectum | CRC | Sphingolipid signaling pathway | 30/1091 | 121/8465 | 2.49e-04 | 3.09e-03 | 2.09e-03 | 30 |
| hsa0407116 | Esophagus | ESCC | Sphingolipid signaling pathway | 85/4205 | 121/8465 | 3.04e-06 | 1.73e-05 | 8.84e-06 | 85 |
| hsa006003 | Esophagus | ESCC | Sphingolipid metabolism | 36/4205 | 53/8465 | 5.41e-03 | 1.36e-02 | 6.99e-03 | 36 |
| hsa0407117 | Esophagus | ESCC | Sphingolipid signaling pathway | 85/4205 | 121/8465 | 3.04e-06 | 1.73e-05 | 8.84e-06 | 85 |
| hsa0060012 | Esophagus | ESCC | Sphingolipid metabolism | 36/4205 | 53/8465 | 5.41e-03 | 1.36e-02 | 6.99e-03 | 36 |
| hsa040718 | Liver | HCC | Sphingolipid signaling pathway | 72/4020 | 121/8465 | 5.01e-03 | 1.47e-02 | 8.18e-03 | 72 |
| hsa0407111 | Liver | HCC | Sphingolipid signaling pathway | 72/4020 | 121/8465 | 5.01e-03 | 1.47e-02 | 8.18e-03 | 72 |
| hsa040719 | Lung | IAC | Sphingolipid signaling pathway | 28/1053 | 121/8465 | 7.30e-04 | 6.08e-03 | 4.04e-03 | 28 |
| hsa0407112 | Lung | IAC | Sphingolipid signaling pathway | 28/1053 | 121/8465 | 7.30e-04 | 6.08e-03 | 4.04e-03 | 28 |
| hsa0407121 | Lung | AIS | Sphingolipid signaling pathway | 25/961 | 121/8465 | 2.03e-03 | 1.29e-02 | 8.24e-03 | 25 |
| hsa0407131 | Lung | AIS | Sphingolipid signaling pathway | 25/961 | 121/8465 | 2.03e-03 | 1.29e-02 | 8.24e-03 | 25 |
| Page: 1 2 |
Top |
Cell-cell communication analysis |
| Identification of potential cell-cell interactions between two cell types and their ligand-receptor pairs for different disease states |
| Ligand | Receptor | LRpair | Pathway | Tissue | Disease Stage |
| Page: 1 |
Top |
Single-cell gene regulatory network inference analysis |
| Find out the significant the regulons (TFs) and the target genes of each regulon across cell types for different disease states |
| TF | Cell Type | Tissue | Disease Stage | Target Gene | RSS | Regulon Activity |
| ∗The dot plots of a searched regulon are shown for all cell subpopulations in each disease state of each tissue based on the regulon specific score inferred using pySCENIC and by calculating the average expression. |
| Page: 1 |
Top |
Somatic mutation of malignant transformation related genes |
| Annotation of somatic variants for genes involved in malignant transformation |
| Hugo Symbol | Variant Class | Variant Classification | dbSNP RS | HGVSc | HGVSp | HGVSp Short | SWISSPROT | BIOTYPE | SIFT | PolyPhen | Tumor Sample Barcode | Tissue | Histology | Sex | Age | Stage | Therapy Types | Drugs | Outcome |
| SGPP2 | SNV | Missense_Mutation | rs201625866 | c.1016N>A | p.Arg339His | p.R339H | Q8IWX5 | protein_coding | deleterious(0) | probably_damaging(0.999) | TCGA-C8-A135-01 | Breast | breast invasive carcinoma | Female | <65 | I/II | Chemotherapy | 5-fluorouracil | CR |
| SGPP2 | insertion | Frame_Shift_Ins | novel | c.644_645insCCAGTGTGGGGTCCCACCTCTACCACTGAAGCCTTCTA | p.Leu216GlnfsTer21 | p.L216Qfs*21 | Q8IWX5 | protein_coding | TCGA-AN-A04D-01 | Breast | breast invasive carcinoma | Female | <65 | I/II | Unknown | Unknown | SD | ||
| SGPP2 | deletion | Frame_Shift_Del | novel | c.492delC | p.Thr165ProfsTer30 | p.T165Pfs*30 | Q8IWX5 | protein_coding | TCGA-D8-A27V-01 | Breast | breast invasive carcinoma | Female | <65 | I/II | Hormone Therapy | tamoxiphen | SD | ||
| SGPP2 | SNV | Missense_Mutation | c.499N>A | p.Ala167Thr | p.A167T | Q8IWX5 | protein_coding | deleterious(0) | probably_damaging(1) | TCGA-A6-6781-01 | Colorectum | colon adenocarcinoma | Male | <65 | III/IV | Chemotherapy | oxaliplatin | SD | |
| SGPP2 | SNV | Missense_Mutation | rs138702204 | c.241N>A | p.Val81Met | p.V81M | Q8IWX5 | protein_coding | deleterious(0) | probably_damaging(0.987) | TCGA-AA-3870-01 | Colorectum | colon adenocarcinoma | Female | >=65 | III/IV | Chemotherapy | folinic | CR |
| SGPP2 | SNV | Missense_Mutation | novel | c.923C>A | p.Pro308His | p.P308H | Q8IWX5 | protein_coding | deleterious(0.02) | probably_damaging(0.927) | TCGA-AA-3947-01 | Colorectum | colon adenocarcinoma | Female | <65 | I/II | Unknown | Unknown | SD |
| SGPP2 | SNV | Missense_Mutation | rs371268936 | c.1015N>T | p.Arg339Cys | p.R339C | Q8IWX5 | protein_coding | deleterious(0) | probably_damaging(1) | TCGA-AZ-4315-01 | Colorectum | colon adenocarcinoma | Male | <65 | I/II | Unknown | Unknown | SD |
| SGPP2 | SNV | Missense_Mutation | novel | c.436N>C | p.Ser146Pro | p.S146P | Q8IWX5 | protein_coding | deleterious(0.01) | probably_damaging(0.925) | TCGA-AG-A002-01 | Colorectum | rectum adenocarcinoma | Male | <65 | I/II | Unknown | Unknown | SD |
| SGPP2 | SNV | Missense_Mutation | rs371268936 | c.1015N>T | p.Arg339Cys | p.R339C | Q8IWX5 | protein_coding | deleterious(0) | probably_damaging(1) | TCGA-AG-A002-01 | Colorectum | rectum adenocarcinoma | Male | <65 | I/II | Unknown | Unknown | SD |
| SGPP2 | deletion | Frame_Shift_Del | c.427delC | p.Arg143ValfsTer8 | p.R143Vfs*8 | Q8IWX5 | protein_coding | TCGA-EI-6507-01 | Colorectum | rectum adenocarcinoma | Male | <65 | I/II | Unknown | Unknown | SD |
| Page: 1 2 3 4 |
Top |
Related drugs of malignant transformation related genes |
| Identification of chemicals and drugs interact with genes involved in malignant transfromation |
| (DGIdb 4.0) |
| Entrez ID | Symbol | Category | Interaction Types | Drug Claim Name | Drug Name | PMIDs |
| Page: 1 |

Copyright 2023-Present -The University of Texas Health Science Center at Houston |