
|
|||||
|
 | |
| |
| |
| |
| |
| |
|
Gene: SGO1 |
Gene summary for SGO1 |
| Gene information | Species | Human | Gene symbol | SGO1 | Gene ID | 151648 |
| Gene name | shugoshin 1 | |
| Gene Alias | CAID | |
| Cytomap | 3p24.3 | |
| Gene Type | protein-coding | GO ID | GO:0000003 | UniProtAcc | B5BUA4 |
Top |
Malignant transformation analysis |
| Identification of the aberrant gene expression in precancerous and cancerous lesions by comparing the gene expression of stem-like cells in diseased tissues with normal stem cells |
| Entrez ID | Symbol | Replicates | Species | Organ | Tissue | Adj P-value | Log2FC | Malignancy |
| 151648 | SGO1 | HCC2 | Human | Liver | HCC | 2.50e-06 | 1.46e+00 | 0.5341 |
| 151648 | SGO1 | S014 | Human | Liver | HCC | 9.31e-08 | 4.06e-01 | 0.2254 |
| 151648 | SGO1 | S015 | Human | Liver | HCC | 6.11e-04 | 2.70e-01 | 0.2375 |
| 151648 | SGO1 | S016 | Human | Liver | HCC | 1.96e-07 | 3.74e-01 | 0.2243 |
| 151648 | SGO1 | S027 | Human | Liver | HCC | 2.57e-02 | 2.79e-01 | 0.2446 |
| 151648 | SGO1 | S028 | Human | Liver | HCC | 1.83e-12 | 7.99e-01 | 0.2503 |
| 151648 | SGO1 | S029 | Human | Liver | HCC | 4.44e-04 | 3.83e-01 | 0.2581 |
| 151648 | SGO1 | ATC12 | Human | Thyroid | ATC | 2.29e-02 | 1.49e-01 | 0.34 |
| 151648 | SGO1 | ATC13 | Human | Thyroid | ATC | 2.42e-03 | 1.25e-01 | 0.34 |
| 151648 | SGO1 | ATC2 | Human | Thyroid | ATC | 9.94e-09 | 8.49e-01 | 0.34 |
| 151648 | SGO1 | ATC4 | Human | Thyroid | ATC | 3.08e-07 | 2.76e-01 | 0.34 |
| 151648 | SGO1 | ATC5 | Human | Thyroid | ATC | 5.67e-05 | 2.64e-01 | 0.34 |
| Page: 1 |
| Tissue | Expression Dynamics | Abbreviation |
| Liver | 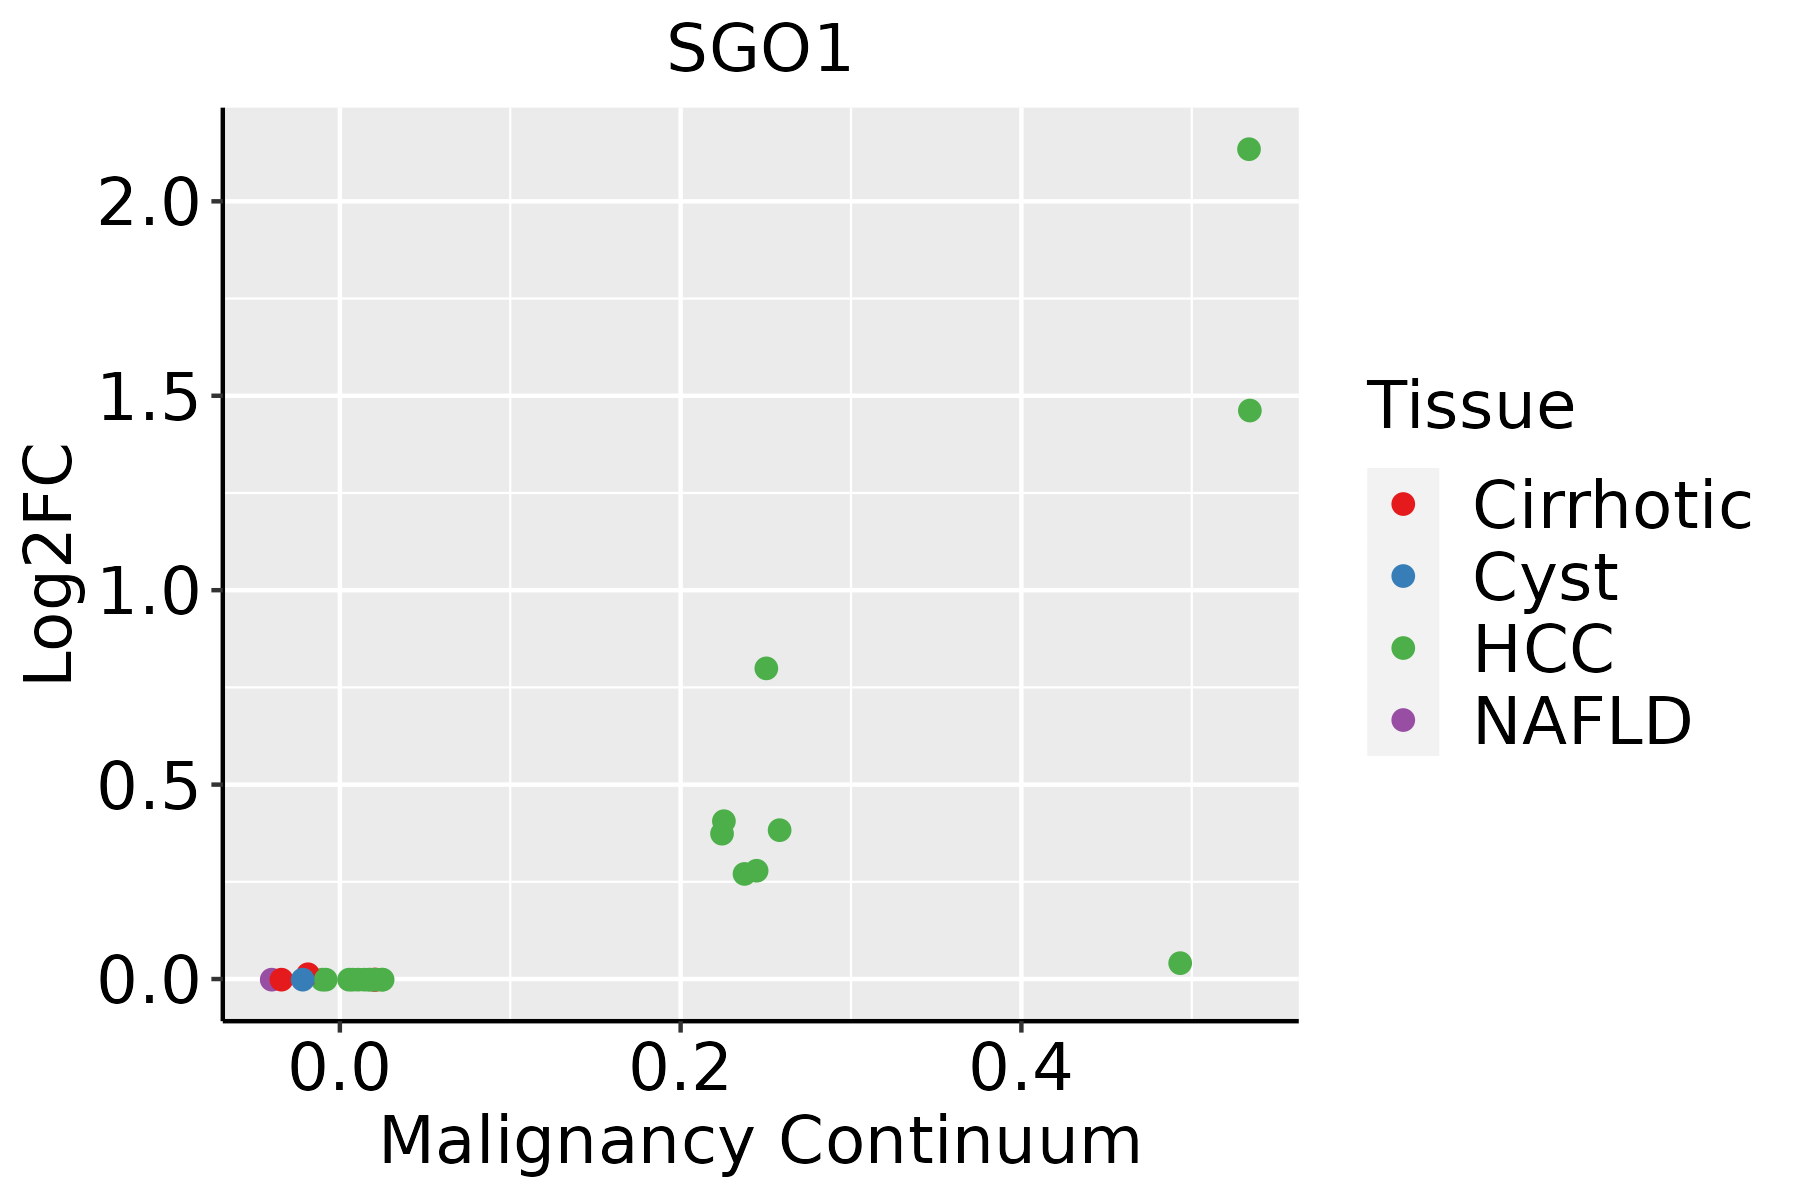 | HCC: Hepatocellular carcinoma |
| NAFLD: Non-alcoholic fatty liver disease | ||
| Thyroid | 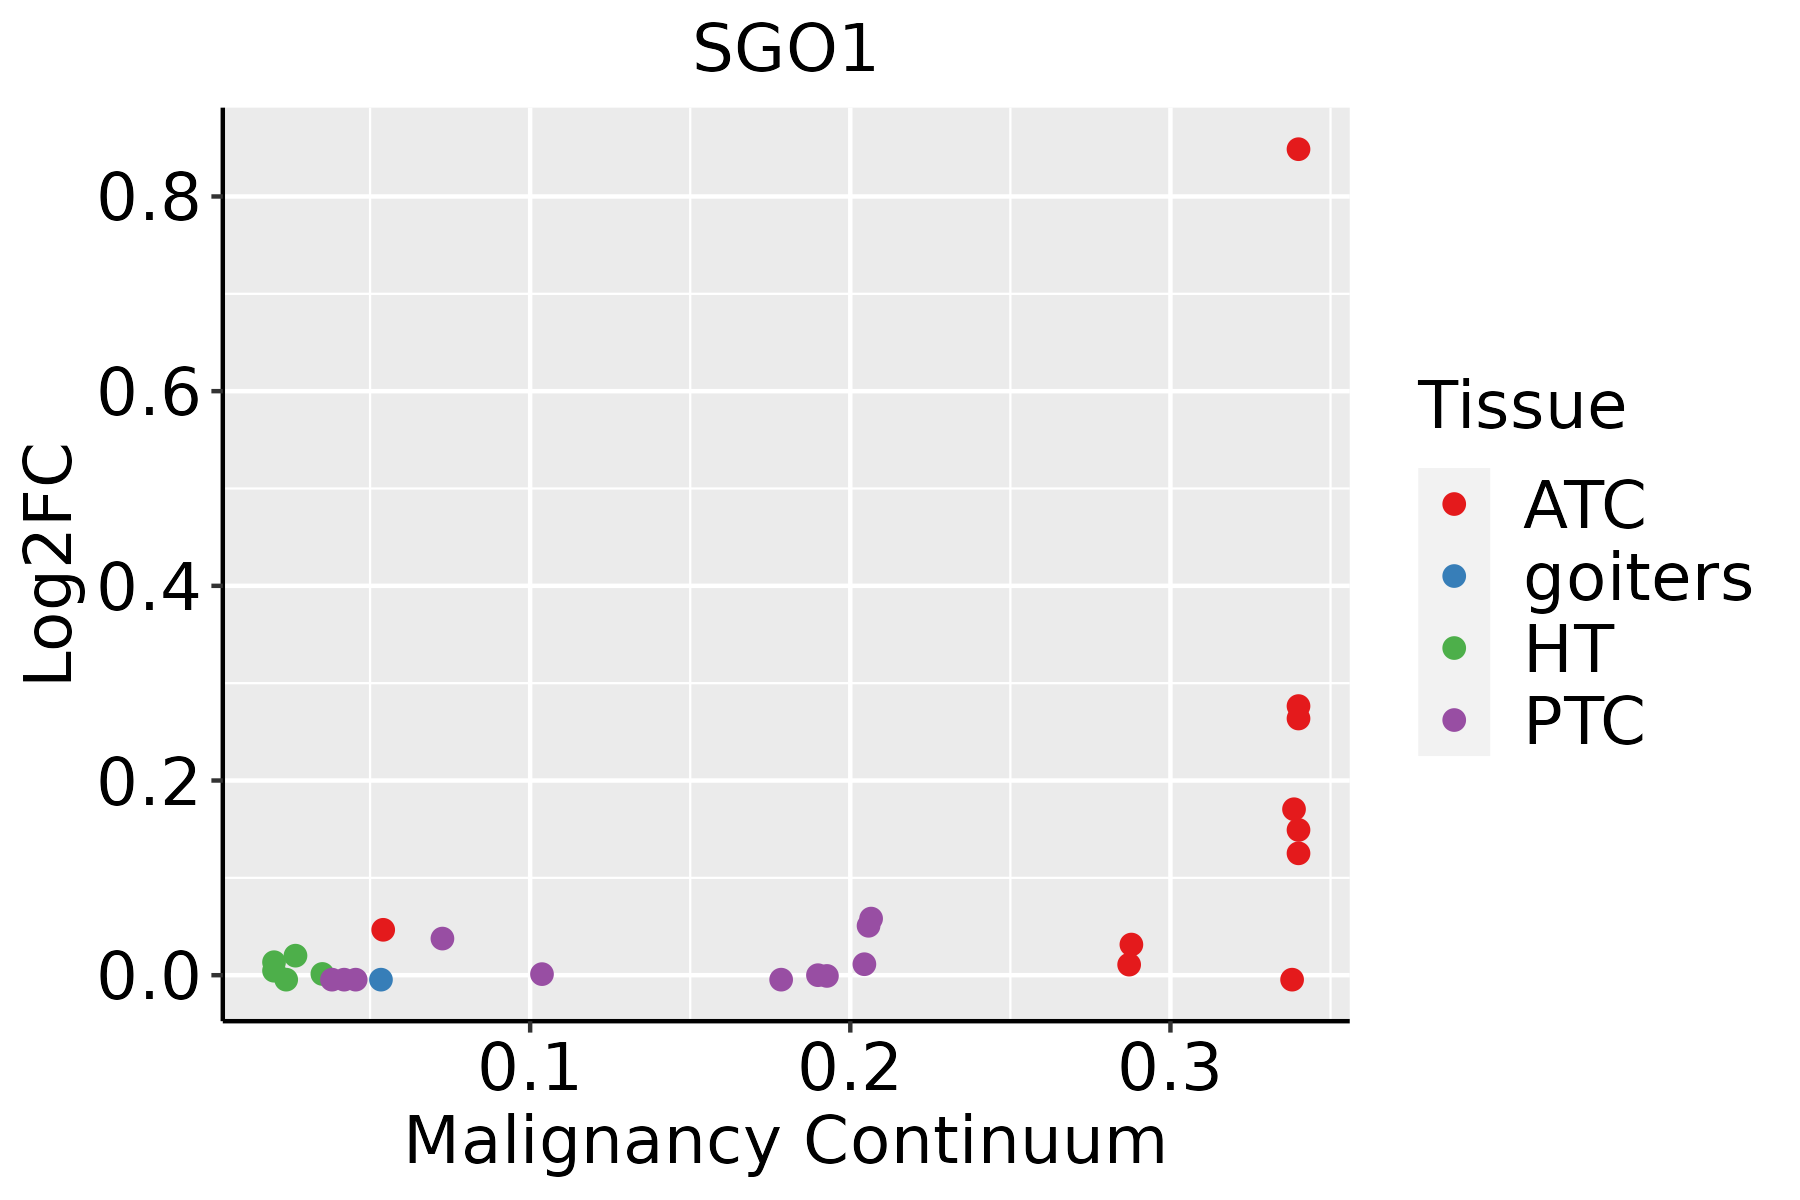 | ATC: Anaplastic thyroid cancer |
| HT: Hashimoto's thyroiditis | ||
| PTC: Papillary thyroid cancer |
| ∗log2FC in expression of this searched gene in stem-like cells from each diseased tissue sample relative to stem-like cells in normal samples in each tissue plotted against the malignancy continuum. Samples are colored based on if they are from different disease stage. |
Top |
Malignant transformation related pathway analysis |
| Find out the enriched GO biological processes and KEGG pathways involved in transition from healthy to precancer to cancer |
| Tissue | Disease Stage | Enriched GO biological Processes |
| Colorectum | AD |  |
| Colorectum | SER |  |
| Colorectum | MSS |  |
| Colorectum | MSI-H |  |
| Colorectum | FAP |  |
| ∗Top 15 enriched GO BP terms are showed in the bar plot of each disease state in each tissue. Each row represents a significant GO biological process which is colored according to the -log10(p.adjust). |
| Page: 1 2 3 4 5 6 7 8 9 |
| GO ID | Tissue | Disease Stage | Description | Gene Ratio | Bg Ratio | pvalue | p.adjust | Count |
| GO:014001411 | Liver | HCC | mitotic nuclear division | 174/7958 | 287/18723 | 3.74e-10 | 1.23e-08 | 174 |
| GO:0000070 | Liver | HCC | mitotic sister chromatid segregation | 110/7958 | 168/18723 | 1.42e-09 | 4.25e-08 | 110 |
| GO:00008191 | Liver | HCC | sister chromatid segregation | 128/7958 | 202/18723 | 1.59e-09 | 4.73e-08 | 128 |
| GO:0007059 | Liver | HCC | chromosome segregation | 197/7958 | 346/18723 | 3.57e-08 | 7.87e-07 | 197 |
| GO:0098813 | Liver | HCC | nuclear chromosome segregation | 157/7958 | 281/18723 | 3.82e-06 | 4.95e-05 | 157 |
| GO:0048285 | Liver | HCC | organelle fission | 254/7958 | 488/18723 | 1.07e-05 | 1.23e-04 | 254 |
| GO:0031023 | Liver | HCC | microtubule organizing center organization | 82/7958 | 143/18723 | 2.38e-04 | 1.79e-03 | 82 |
| GO:0007098 | Liver | HCC | centrosome cycle | 75/7958 | 130/18723 | 3.33e-04 | 2.34e-03 | 75 |
| GO:0000280 | Liver | HCC | nuclear division | 220/7958 | 439/18723 | 6.90e-04 | 4.25e-03 | 220 |
| GO:000706411 | Liver | HCC | mitotic sister chromatid cohesion | 20/7958 | 28/18723 | 1.86e-03 | 9.50e-03 | 20 |
| GO:00070624 | Liver | HCC | sister chromatid cohesion | 38/7958 | 62/18723 | 2.18e-03 | 1.09e-02 | 38 |
| GO:014001416 | Thyroid | ATC | mitotic nuclear division | 171/6293 | 287/18723 | 1.13e-19 | 1.66e-17 | 171 |
| GO:000007013 | Thyroid | ATC | mitotic sister chromatid segregation | 108/6293 | 168/18723 | 3.53e-16 | 2.90e-14 | 108 |
| GO:000081913 | Thyroid | ATC | sister chromatid segregation | 122/6293 | 202/18723 | 4.71e-15 | 3.17e-13 | 122 |
| GO:000705913 | Thyroid | ATC | chromosome segregation | 183/6293 | 346/18723 | 8.03e-14 | 4.23e-12 | 183 |
| GO:009881312 | Thyroid | ATC | nuclear chromosome segregation | 145/6293 | 281/18723 | 3.06e-10 | 8.61e-09 | 145 |
| GO:004828512 | Thyroid | ATC | organelle fission | 229/6293 | 488/18723 | 4.79e-10 | 1.29e-08 | 229 |
| GO:000028011 | Thyroid | ATC | nuclear division | 207/6293 | 439/18723 | 1.98e-09 | 4.80e-08 | 207 |
| GO:003102311 | Thyroid | ATC | microtubule organizing center organization | 71/6293 | 143/18723 | 5.11e-05 | 3.99e-04 | 71 |
| GO:000709811 | Thyroid | ATC | centrosome cycle | 65/6293 | 130/18723 | 7.95e-05 | 5.97e-04 | 65 |
| Page: 1 2 |
| Pathway ID | Tissue | Disease Stage | Description | Gene Ratio | Bg Ratio | pvalue | p.adjust | qvalue | Count |
| hsa041102 | Liver | HCC | Cell cycle | 106/4020 | 157/8465 | 2.54e-07 | 3.04e-06 | 1.69e-06 | 106 |
| hsa041103 | Liver | HCC | Cell cycle | 106/4020 | 157/8465 | 2.54e-07 | 3.04e-06 | 1.69e-06 | 106 |
| Page: 1 |
Top |
Cell-cell communication analysis |
| Identification of potential cell-cell interactions between two cell types and their ligand-receptor pairs for different disease states |
| Ligand | Receptor | LRpair | Pathway | Tissue | Disease Stage |
| Page: 1 |
Top |
Single-cell gene regulatory network inference analysis |
| Find out the significant the regulons (TFs) and the target genes of each regulon across cell types for different disease states |
| TF | Cell Type | Tissue | Disease Stage | Target Gene | RSS | Regulon Activity |
| ∗The dot plots of a searched regulon are shown for all cell subpopulations in each disease state of each tissue based on the regulon specific score inferred using pySCENIC and by calculating the average expression. |
| Page: 1 |
Top |
Somatic mutation of malignant transformation related genes |
| Annotation of somatic variants for genes involved in malignant transformation |
| Hugo Symbol | Variant Class | Variant Classification | dbSNP RS | HGVSc | HGVSp | HGVSp Short | SWISSPROT | BIOTYPE | SIFT | PolyPhen | Tumor Sample Barcode | Tissue | Histology | Sex | Age | Stage | Therapy Types | Drugs | Outcome |
| SGO1 | SNV | Missense_Mutation | c.1469C>T | p.Ala490Val | p.A490V | Q5FBB7 | protein_coding | tolerated(0.05) | benign(0.017) | TCGA-A7-A0CJ-01 | Breast | breast invasive carcinoma | Female | <65 | I/II | Chemotherapy | cytoxan | SD | |
| SGO1 | SNV | Missense_Mutation | c.650N>T | p.Ala217Val | p.A217V | Q5FBB7 | protein_coding | tolerated(0.28) | benign(0) | TCGA-BH-A0BR-01 | Breast | breast invasive carcinoma | Female | <65 | I/II | Unknown | Unknown | SD | |
| SGO1 | insertion | Nonsense_Mutation | novel | c.1642_1643insGGTAAGAAAAGATGGAGAGAGCCTAAAATGCAGCAGAAACAAAGC | p.Asp548delinsGlyTerGluLysMetGluArgAlaTerAsnAlaAlaGluThrLysHis | p.D548delinsG*EKMERA*NAAETKH | Q5FBB7 | protein_coding | TCGA-A8-A06P-01 | Breast | breast invasive carcinoma | Female | <65 | III/IV | Unspecific | SD | |||
| SGO1 | insertion | Nonsense_Mutation | novel | c.942_943insTACTTCAATTCAACCTAAGTCTACAAAAAAGTCCCTCTGTCCCCTTGGGAGTCCTAATTTACT | p.Ser314_Glu315insTyrPheAsnSerThrTerValTyrLysLysValProLeuSerProTrpGluSerTerPheThr | p.S314_E315insYFNST*VYKKVPLSPWES*FT | Q5FBB7 | protein_coding | TCGA-AO-A128-01 | Breast | breast invasive carcinoma | Female | <65 | I/II | Chemotherapy | doxorubicin | SD | ||
| SGO1 | insertion | Frame_Shift_Ins | novel | c.942_943insCTCTGTCCCCTTGGGAGTCCTAATTTACT | p.Glu315LeufsTer48 | p.E315Lfs*48 | Q5FBB7 | protein_coding | TCGA-AR-A0TU-01 | Breast | breast invasive carcinoma | Female | <65 | I/II | Unspecific | Doxorubicin | SD | ||
| SGO1 | insertion | Frame_Shift_Ins | novel | c.513_514insACTTTTAGTTTGTTCA | p.Asp172ThrfsTer8 | p.D172Tfs*8 | Q5FBB7 | protein_coding | TCGA-AR-A0TU-01 | Breast | breast invasive carcinoma | Female | <65 | I/II | Unspecific | Doxorubicin | SD | ||
| SGO1 | insertion | Frame_Shift_Ins | novel | c.942_943insTCTGTCCCCTTGGGAGTCCTAATTTACT | p.Glu315SerfsTer10 | p.E315Sfs*10 | Q5FBB7 | protein_coding | TCGA-AR-A0U2-01 | Breast | breast invasive carcinoma | Female | <65 | III/IV | Hormone Therapy | tamoxiphen | PD | ||
| SGO1 | SNV | Missense_Mutation | novel | c.628G>A | p.Asp210Asn | p.D210N | Q5FBB7 | protein_coding | tolerated(0.39) | benign(0.003) | TCGA-C5-A8XJ-01 | Cervix | cervical & endocervical cancer | Female | >=65 | I/II | Chemotherapy | cisplatin | SD |
| SGO1 | SNV | Missense_Mutation | c.107N>A | p.Arg36His | p.R36H | Q5FBB7 | protein_coding | deleterious(0.02) | benign(0.288) | TCGA-EA-A410-01 | Cervix | cervical & endocervical cancer | Female | <65 | I/II | Unknown | Unknown | SD | |
| SGO1 | SNV | Missense_Mutation | c.113N>G | p.Ser38Cys | p.S38C | Q5FBB7 | protein_coding | deleterious(0) | probably_damaging(0.961) | TCGA-LP-A4AV-01 | Cervix | cervical & endocervical cancer | Female | <65 | I/II | Unknown | Unknown | SD |
| Page: 1 2 3 4 5 6 7 8 9 10 11 12 |
Top |
Related drugs of malignant transformation related genes |
| Identification of chemicals and drugs interact with genes involved in malignant transfromation |
| (DGIdb 4.0) |
| Entrez ID | Symbol | Category | Interaction Types | Drug Claim Name | Drug Name | PMIDs |
| Page: 1 |

Copyright 2023-Present -The University of Texas Health Science Center at Houston |