
|
|||||
|
 | |
| |
| |
| |
| |
| |
|
Gene: SGMS2 |
Gene summary for SGMS2 |
| Gene information | Species | Human | Gene symbol | SGMS2 | Gene ID | 166929 |
| Gene name | sphingomyelin synthase 2 | |
| Gene Alias | CDL | |
| Cytomap | 4q25 | |
| Gene Type | protein-coding | GO ID | GO:0001503 | UniProtAcc | A0A024RDH4 |
Top |
Malignant transformation analysis |
| Identification of the aberrant gene expression in precancerous and cancerous lesions by comparing the gene expression of stem-like cells in diseased tissues with normal stem cells |
| Entrez ID | Symbol | Replicates | Species | Organ | Tissue | Adj P-value | Log2FC | Malignancy |
| 166929 | SGMS2 | AEH-subject1 | Human | Endometrium | AEH | 5.42e-13 | 5.16e-01 | -0.3059 |
| 166929 | SGMS2 | AEH-subject2 | Human | Endometrium | AEH | 1.82e-05 | 3.55e-01 | -0.2525 |
| 166929 | SGMS2 | AEH-subject3 | Human | Endometrium | AEH | 7.88e-06 | 3.59e-01 | -0.2576 |
| 166929 | SGMS2 | AEH-subject4 | Human | Endometrium | AEH | 5.99e-12 | 5.30e-01 | -0.2657 |
| 166929 | SGMS2 | AEH-subject5 | Human | Endometrium | AEH | 3.30e-33 | 7.44e-01 | -0.2953 |
| 166929 | SGMS2 | EEC-subject1 | Human | Endometrium | EEC | 2.03e-08 | 4.96e-01 | -0.2682 |
| 166929 | SGMS2 | EEC-subject2 | Human | Endometrium | EEC | 9.05e-06 | 3.85e-01 | -0.2607 |
| 166929 | SGMS2 | EEC-subject4 | Human | Endometrium | EEC | 3.06e-07 | 3.49e-01 | -0.2571 |
| 166929 | SGMS2 | EEC-subject5 | Human | Endometrium | EEC | 9.34e-10 | 4.41e-01 | -0.249 |
| 166929 | SGMS2 | TD9 | Human | Lung | IAC | 5.04e-10 | 1.56e+00 | 0.088 |
| 166929 | SGMS2 | RNA-P10T1-P10T1-2 | Human | Lung | AIS | 1.57e-02 | 1.25e+00 | -0.1028 |
| 166929 | SGMS2 | RNA-P17T-P17T-2 | Human | Lung | IAC | 1.34e-03 | 4.82e-01 | 0.3371 |
| 166929 | SGMS2 | RNA-P17T-P17T-4 | Human | Lung | IAC | 8.35e-06 | 7.32e-01 | 0.343 |
| 166929 | SGMS2 | RNA-P17T-P17T-6 | Human | Lung | IAC | 2.30e-02 | 6.17e-01 | 0.3385 |
| 166929 | SGMS2 | RNA-P17T-P17T-8 | Human | Lung | IAC | 4.85e-08 | 7.26e-01 | 0.3329 |
| 166929 | SGMS2 | RNA-P25T1-P25T1-1 | Human | Lung | AIS | 9.61e-12 | 6.00e-01 | -0.2116 |
| 166929 | SGMS2 | RNA-P25T1-P25T1-2 | Human | Lung | AIS | 2.30e-03 | 7.30e-01 | -0.1941 |
| 166929 | SGMS2 | RNA-P25T1-P25T1-3 | Human | Lung | AIS | 4.23e-02 | 5.86e-01 | -0.2107 |
| 166929 | SGMS2 | RNA-P25T1-P25T1-4 | Human | Lung | AIS | 6.11e-06 | 5.88e-01 | -0.2119 |
| 166929 | SGMS2 | RNA-P6T1-P6T1-1 | Human | Lung | MIAC | 3.20e-05 | 1.16e+00 | -0.0238 |
| Page: 1 2 3 4 5 |
| Tissue | Expression Dynamics | Abbreviation |
| Endometrium |  | AEH: Atypical endometrial hyperplasia |
| EEC: Endometrioid Cancer | ||
| GC |  | CAG: Chronic atrophic gastritis |
| CAG with IM: Chronic atrophic gastritis with intestinal metaplasia | ||
| CSG: Chronic superficial gastritis | ||
| GC: Gastric cancer | ||
| SIM: Severe intestinal metaplasia | ||
| WIM: Wild intestinal metaplasia | ||
| Lung | 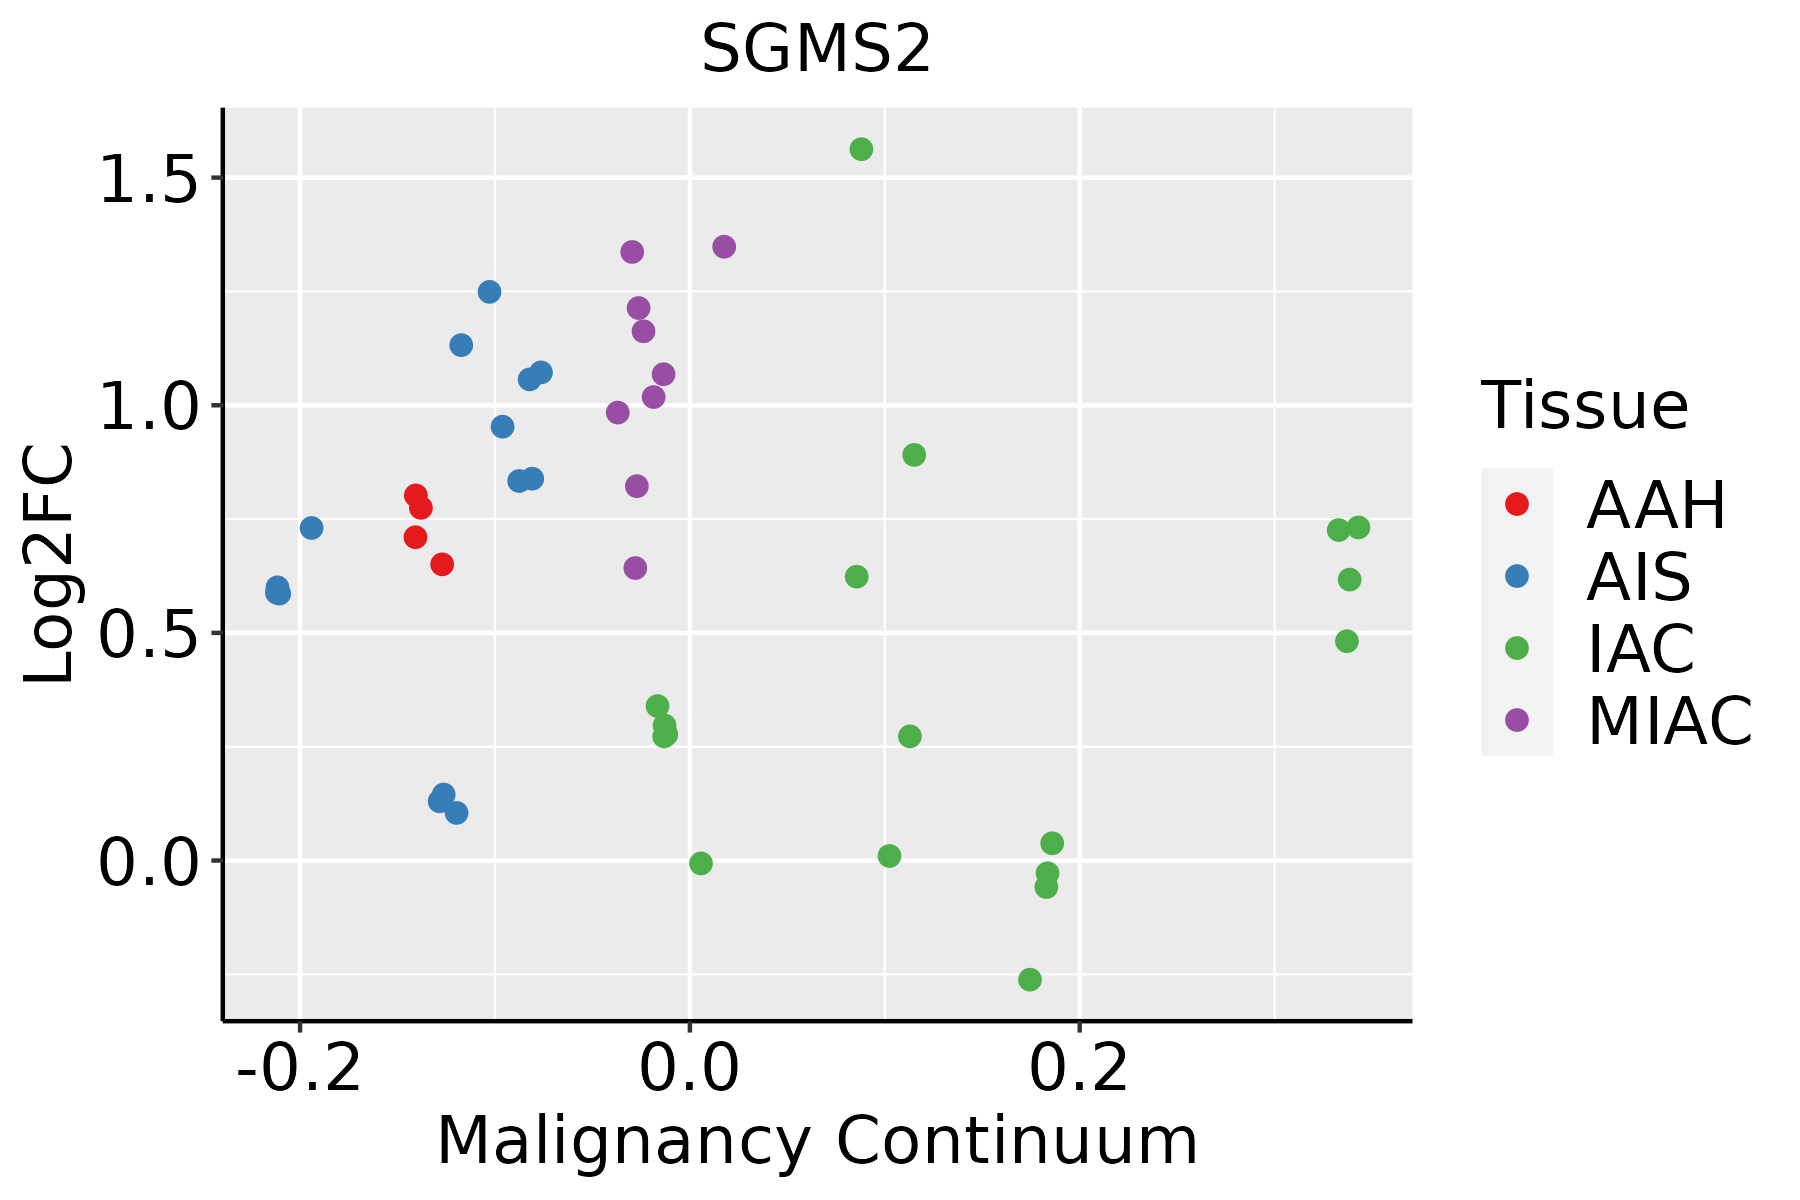 | AAH: Atypical adenomatous hyperplasia |
| AIS: Adenocarcinoma in situ | ||
| IAC: Invasive lung adenocarcinoma | ||
| MIA: Minimally invasive adenocarcinoma | ||
| Prostate | 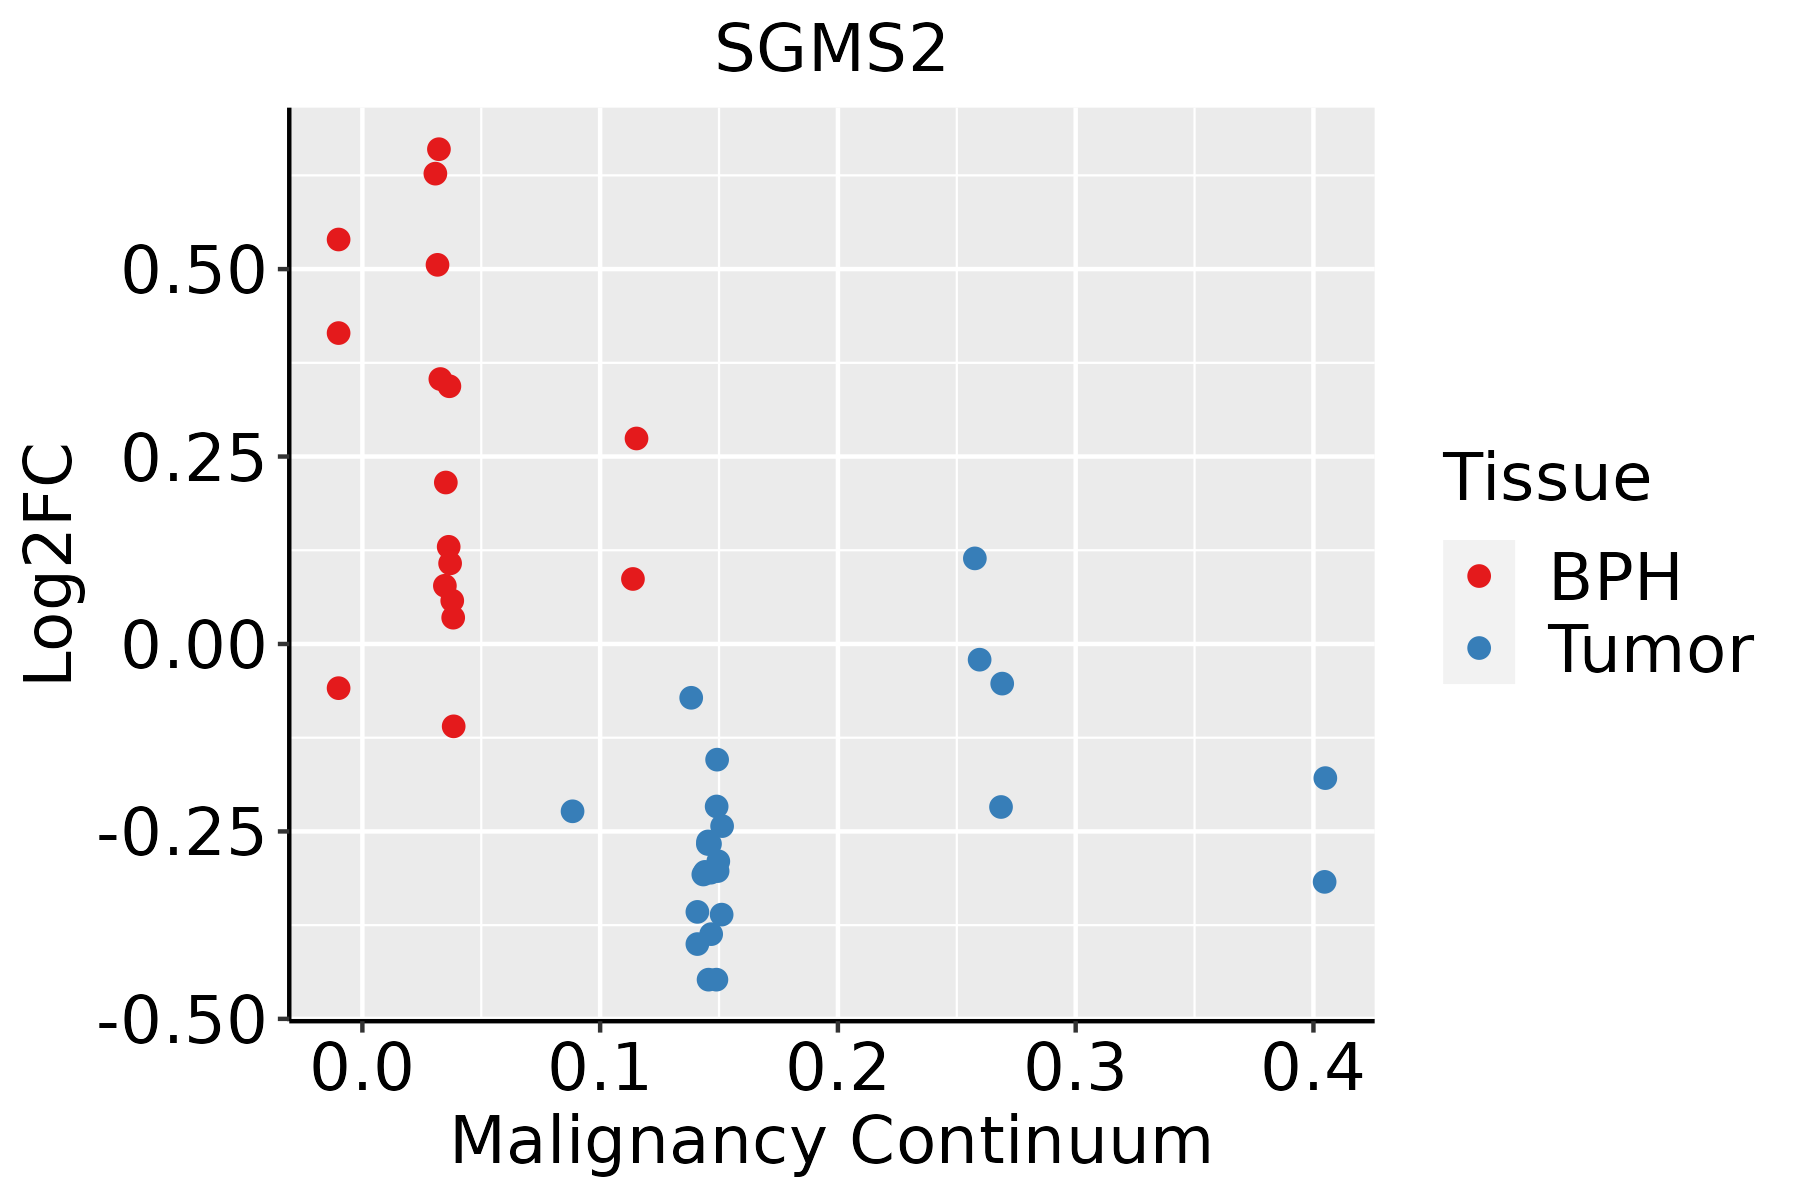 | BPH: Benign Prostatic Hyperplasia |
| Thyroid |  | ATC: Anaplastic thyroid cancer |
| HT: Hashimoto's thyroiditis | ||
| PTC: Papillary thyroid cancer |
| ∗log2FC in expression of this searched gene in stem-like cells from each diseased tissue sample relative to stem-like cells in normal samples in each tissue plotted against the malignancy continuum. Samples are colored based on if they are from different disease stage. |
Top |
Malignant transformation related pathway analysis |
| Find out the enriched GO biological processes and KEGG pathways involved in transition from healthy to precancer to cancer |
| Tissue | Disease Stage | Enriched GO biological Processes |
| Colorectum | AD |  |
| Colorectum | SER |  |
| Colorectum | MSS |  |
| Colorectum | MSI-H |  |
| Colorectum | FAP |  |
| ∗Top 15 enriched GO BP terms are showed in the bar plot of each disease state in each tissue. Each row represents a significant GO biological process which is colored according to the -log10(p.adjust). |
| Page: 1 2 3 4 5 6 7 8 9 |
| GO ID | Tissue | Disease Stage | Description | Gene Ratio | Bg Ratio | pvalue | p.adjust | Count |
| GO:00015038 | Endometrium | AEH | ossification | 78/2100 | 408/18723 | 1.54e-06 | 4.85e-05 | 78 |
| GO:0070167 | Endometrium | AEH | regulation of biomineral tissue development | 20/2100 | 97/18723 | 5.00e-03 | 3.14e-02 | 20 |
| GO:00302822 | Endometrium | AEH | bone mineralization | 23/2100 | 119/18723 | 6.32e-03 | 3.75e-02 | 23 |
| GO:0110149 | Endometrium | AEH | regulation of biomineralization | 20/2100 | 99/18723 | 6.34e-03 | 3.76e-02 | 20 |
| GO:00312141 | Endometrium | AEH | biomineral tissue development | 30/2100 | 169/18723 | 7.31e-03 | 4.18e-02 | 30 |
| GO:01101481 | Endometrium | AEH | biomineralization | 30/2100 | 171/18723 | 8.63e-03 | 4.71e-02 | 30 |
| GO:000150313 | Endometrium | EEC | ossification | 79/2168 | 408/18723 | 2.72e-06 | 7.67e-05 | 79 |
| GO:00701671 | Endometrium | EEC | regulation of biomineral tissue development | 20/2168 | 97/18723 | 7.11e-03 | 4.07e-02 | 20 |
| GO:01101491 | Endometrium | EEC | regulation of biomineralization | 20/2168 | 99/18723 | 8.95e-03 | 4.81e-02 | 20 |
| GO:00302821 | Endometrium | EEC | bone mineralization | 23/2168 | 119/18723 | 9.19e-03 | 4.94e-02 | 23 |
| GO:00015039 | Prostate | BPH | ossification | 107/3107 | 408/18723 | 4.31e-07 | 8.83e-06 | 107 |
| GO:00302782 | Prostate | BPH | regulation of ossification | 29/3107 | 115/18723 | 1.18e-02 | 4.76e-02 | 29 |
| GO:000150314 | Prostate | Tumor | ossification | 109/3246 | 408/18723 | 1.13e-06 | 2.14e-05 | 109 |
| GO:003027811 | Prostate | Tumor | regulation of ossification | 32/3246 | 115/18723 | 3.39e-03 | 1.75e-02 | 32 |
| GO:000150320 | Thyroid | HT | ossification | 51/1272 | 408/18723 | 1.81e-05 | 4.29e-04 | 51 |
| GO:0001503110 | Thyroid | PTC | ossification | 176/5968 | 408/18723 | 9.26e-07 | 1.40e-05 | 176 |
| GO:00302785 | Thyroid | PTC | regulation of ossification | 51/5968 | 115/18723 | 3.30e-03 | 1.61e-02 | 51 |
| GO:0006684 | Thyroid | PTC | sphingomyelin metabolic process | 10/5968 | 15/18723 | 5.94e-03 | 2.64e-02 | 10 |
| GO:000150324 | Thyroid | goiters | ossification | 25/497 | 408/18723 | 1.00e-04 | 3.16e-03 | 25 |
| GO:000150332 | Thyroid | ATC | ossification | 206/6293 | 408/18723 | 9.23e-13 | 3.95e-11 | 206 |
| Page: 1 2 |
| Pathway ID | Tissue | Disease Stage | Description | Gene Ratio | Bg Ratio | pvalue | p.adjust | qvalue | Count |
| hsa040719 | Lung | IAC | Sphingolipid signaling pathway | 28/1053 | 121/8465 | 7.30e-04 | 6.08e-03 | 4.04e-03 | 28 |
| hsa0407112 | Lung | IAC | Sphingolipid signaling pathway | 28/1053 | 121/8465 | 7.30e-04 | 6.08e-03 | 4.04e-03 | 28 |
| Page: 1 |
Top |
Cell-cell communication analysis |
| Identification of potential cell-cell interactions between two cell types and their ligand-receptor pairs for different disease states |
| Ligand | Receptor | LRpair | Pathway | Tissue | Disease Stage |
| Page: 1 |
Top |
Single-cell gene regulatory network inference analysis |
| Find out the significant the regulons (TFs) and the target genes of each regulon across cell types for different disease states |
| TF | Cell Type | Tissue | Disease Stage | Target Gene | RSS | Regulon Activity |
| ∗The dot plots of a searched regulon are shown for all cell subpopulations in each disease state of each tissue based on the regulon specific score inferred using pySCENIC and by calculating the average expression. |
| Page: 1 |
Top |
Somatic mutation of malignant transformation related genes |
| Annotation of somatic variants for genes involved in malignant transformation |
| Hugo Symbol | Variant Class | Variant Classification | dbSNP RS | HGVSc | HGVSp | HGVSp Short | SWISSPROT | BIOTYPE | SIFT | PolyPhen | Tumor Sample Barcode | Tissue | Histology | Sex | Age | Stage | Therapy Types | Drugs | Outcome |
| SGMS2 | SNV | Missense_Mutation | novel | c.1013C>A | p.Ser338Tyr | p.S338Y | Q8NHU3 | protein_coding | deleterious(0) | possibly_damaging(0.598) | TCGA-AN-A046-01 | Breast | breast invasive carcinoma | Female | >=65 | I/II | Unknown | Unknown | SD |
| SGMS2 | insertion | In_Frame_Ins | novel | c.996_997insCTGCAA | p.Cys332_Phe333insLeuGln | p.C332_F333insLQ | Q8NHU3 | protein_coding | TCGA-AR-A0TU-01 | Breast | breast invasive carcinoma | Female | <65 | I/II | Unspecific | Doxorubicin | SD | ||
| SGMS2 | insertion | Nonsense_Mutation | novel | c.722_723insTTGAGGGATGACAAATTATAAACAAATTC | p.Lys241AsnfsTer2 | p.K241Nfs*2 | Q8NHU3 | protein_coding | TCGA-B6-A0IB-01 | Breast | breast invasive carcinoma | Female | <65 | III/IV | Unknown | Unknown | PD | ||
| SGMS2 | SNV | Missense_Mutation | novel | c.59C>A | p.Pro20His | p.P20H | Q8NHU3 | protein_coding | tolerated(0.55) | benign(0.019) | TCGA-2W-A8YY-01 | Cervix | cervical & endocervical cancer | Female | <65 | I/II | Chemotherapy | cisplatin | CR |
| SGMS2 | SNV | Missense_Mutation | c.449G>A | p.Arg150Lys | p.R150K | Q8NHU3 | protein_coding | tolerated(1) | benign(0.01) | TCGA-A6-6652-01 | Colorectum | colon adenocarcinoma | Male | <65 | I/II | Targeted Molecular therapy | cetuximab | SD | |
| SGMS2 | SNV | Missense_Mutation | c.512N>A | p.Cys171Tyr | p.C171Y | Q8NHU3 | protein_coding | deleterious(0) | possibly_damaging(0.896) | TCGA-AA-3864-01 | Colorectum | colon adenocarcinoma | Male | >=65 | I/II | Unknown | Unknown | SD | |
| SGMS2 | SNV | Missense_Mutation | rs556597938 | c.811N>A | p.Glu271Lys | p.E271K | Q8NHU3 | protein_coding | tolerated(0.16) | possibly_damaging(0.53) | TCGA-AA-A00N-01 | Colorectum | colon adenocarcinoma | Male | >=65 | I/II | Unknown | Unknown | PD |
| SGMS2 | SNV | Missense_Mutation | novel | c.473N>A | p.Arg158Lys | p.R158K | Q8NHU3 | protein_coding | deleterious(0) | probably_damaging(0.991) | TCGA-AA-A010-01 | Colorectum | colon adenocarcinoma | Female | <65 | I/II | Chemotherapy | folinic | CR |
| SGMS2 | SNV | Missense_Mutation | rs201568395 | c.604N>T | p.Arg202Trp | p.R202W | Q8NHU3 | protein_coding | deleterious(0) | possibly_damaging(0.565) | TCGA-AA-A01R-01 | Colorectum | colon adenocarcinoma | Male | <65 | III/IV | Chemotherapy | 5-fluorouracil | PD |
| SGMS2 | SNV | Missense_Mutation | novel | c.550N>C | p.Met184Leu | p.M184L | Q8NHU3 | protein_coding | tolerated(0.39) | benign(0.006) | TCGA-CA-6717-01 | Colorectum | colon adenocarcinoma | Male | <65 | I/II | Chemotherapy | oxaliplatin | CR |
| Page: 1 2 3 4 5 |
Top |
Related drugs of malignant transformation related genes |
| Identification of chemicals and drugs interact with genes involved in malignant transfromation |
| (DGIdb 4.0) |
| Entrez ID | Symbol | Category | Interaction Types | Drug Claim Name | Drug Name | PMIDs |
| 166929 | SGMS2 | KINASE, ENZYME | inhibitor | 375973242 | ||
| 166929 | SGMS2 | KINASE, ENZYME | inhibitor | 252827491 |
| Page: 1 |

Copyright 2023-Present -The University of Texas Health Science Center at Houston |