
|
|||||
|
 | |
| |
| |
| |
| |
| |
|
Gene: SGK3 |
Gene summary for SGK3 |
| Gene information | Species | Human | Gene symbol | SGK3 | Gene ID | 23678 |
| Gene name | serum/glucocorticoid regulated kinase family member 3 | |
| Gene Alias | CISK | |
| Cytomap | 8q13.1 | |
| Gene Type | protein-coding | GO ID | GO:0001558 | UniProtAcc | A0A024R807 |
Top |
Malignant transformation analysis |
| Identification of the aberrant gene expression in precancerous and cancerous lesions by comparing the gene expression of stem-like cells in diseased tissues with normal stem cells |
| Entrez ID | Symbol | Replicates | Species | Organ | Tissue | Adj P-value | Log2FC | Malignancy |
| 23678 | SGK3 | GSM4909286 | Human | Breast | IDC | 1.29e-04 | 2.17e-01 | 0.1081 |
| 23678 | SGK3 | GSM4909293 | Human | Breast | IDC | 5.29e-18 | 4.51e-01 | 0.1581 |
| 23678 | SGK3 | GSM4909303 | Human | Breast | IDC | 4.30e-07 | 6.11e-01 | 0.0438 |
| 23678 | SGK3 | GSM4909304 | Human | Breast | IDC | 1.51e-14 | 4.47e-01 | 0.1636 |
| 23678 | SGK3 | GSM4909305 | Human | Breast | IDC | 2.86e-05 | 3.81e-01 | 0.0436 |
| 23678 | SGK3 | GSM4909306 | Human | Breast | IDC | 7.00e-09 | 4.01e-01 | 0.1564 |
| 23678 | SGK3 | GSM4909311 | Human | Breast | IDC | 5.04e-03 | 7.10e-02 | 0.1534 |
| 23678 | SGK3 | GSM4909312 | Human | Breast | IDC | 1.40e-08 | 3.71e-01 | 0.1552 |
| 23678 | SGK3 | GSM4909313 | Human | Breast | IDC | 3.05e-03 | 3.38e-01 | 0.0391 |
| 23678 | SGK3 | GSM4909319 | Human | Breast | IDC | 5.64e-06 | 1.31e-01 | 0.1563 |
| 23678 | SGK3 | DCIS2 | Human | Breast | DCIS | 1.03e-18 | 9.78e-02 | 0.0085 |
| 23678 | SGK3 | CCI_1 | Human | Cervix | CC | 4.61e-02 | 3.97e-01 | 0.528 |
| 23678 | SGK3 | CCI_2 | Human | Cervix | CC | 4.12e-10 | 8.43e-01 | 0.5249 |
| 23678 | SGK3 | CCI_3 | Human | Cervix | CC | 4.66e-12 | 8.13e-01 | 0.516 |
| 23678 | SGK3 | HTA11_3410_2000001011 | Human | Colorectum | AD | 2.64e-12 | -5.15e-01 | 0.0155 |
| 23678 | SGK3 | HTA11_5212_2000001011 | Human | Colorectum | AD | 9.16e-03 | -5.63e-01 | -0.2061 |
| 23678 | SGK3 | HTA11_866_3004761011 | Human | Colorectum | AD | 6.23e-11 | -5.34e-01 | 0.096 |
| 23678 | SGK3 | HTA11_7696_3000711011 | Human | Colorectum | AD | 4.84e-07 | -3.78e-01 | 0.0674 |
| 23678 | SGK3 | HTA11_6818_2000001021 | Human | Colorectum | AD | 7.22e-05 | -5.78e-01 | 0.0588 |
| 23678 | SGK3 | HTA11_99999970781_79442 | Human | Colorectum | MSS | 9.96e-11 | -4.26e-01 | 0.294 |
| Page: 1 2 3 4 5 6 |
| Tissue | Expression Dynamics | Abbreviation |
| Breast | 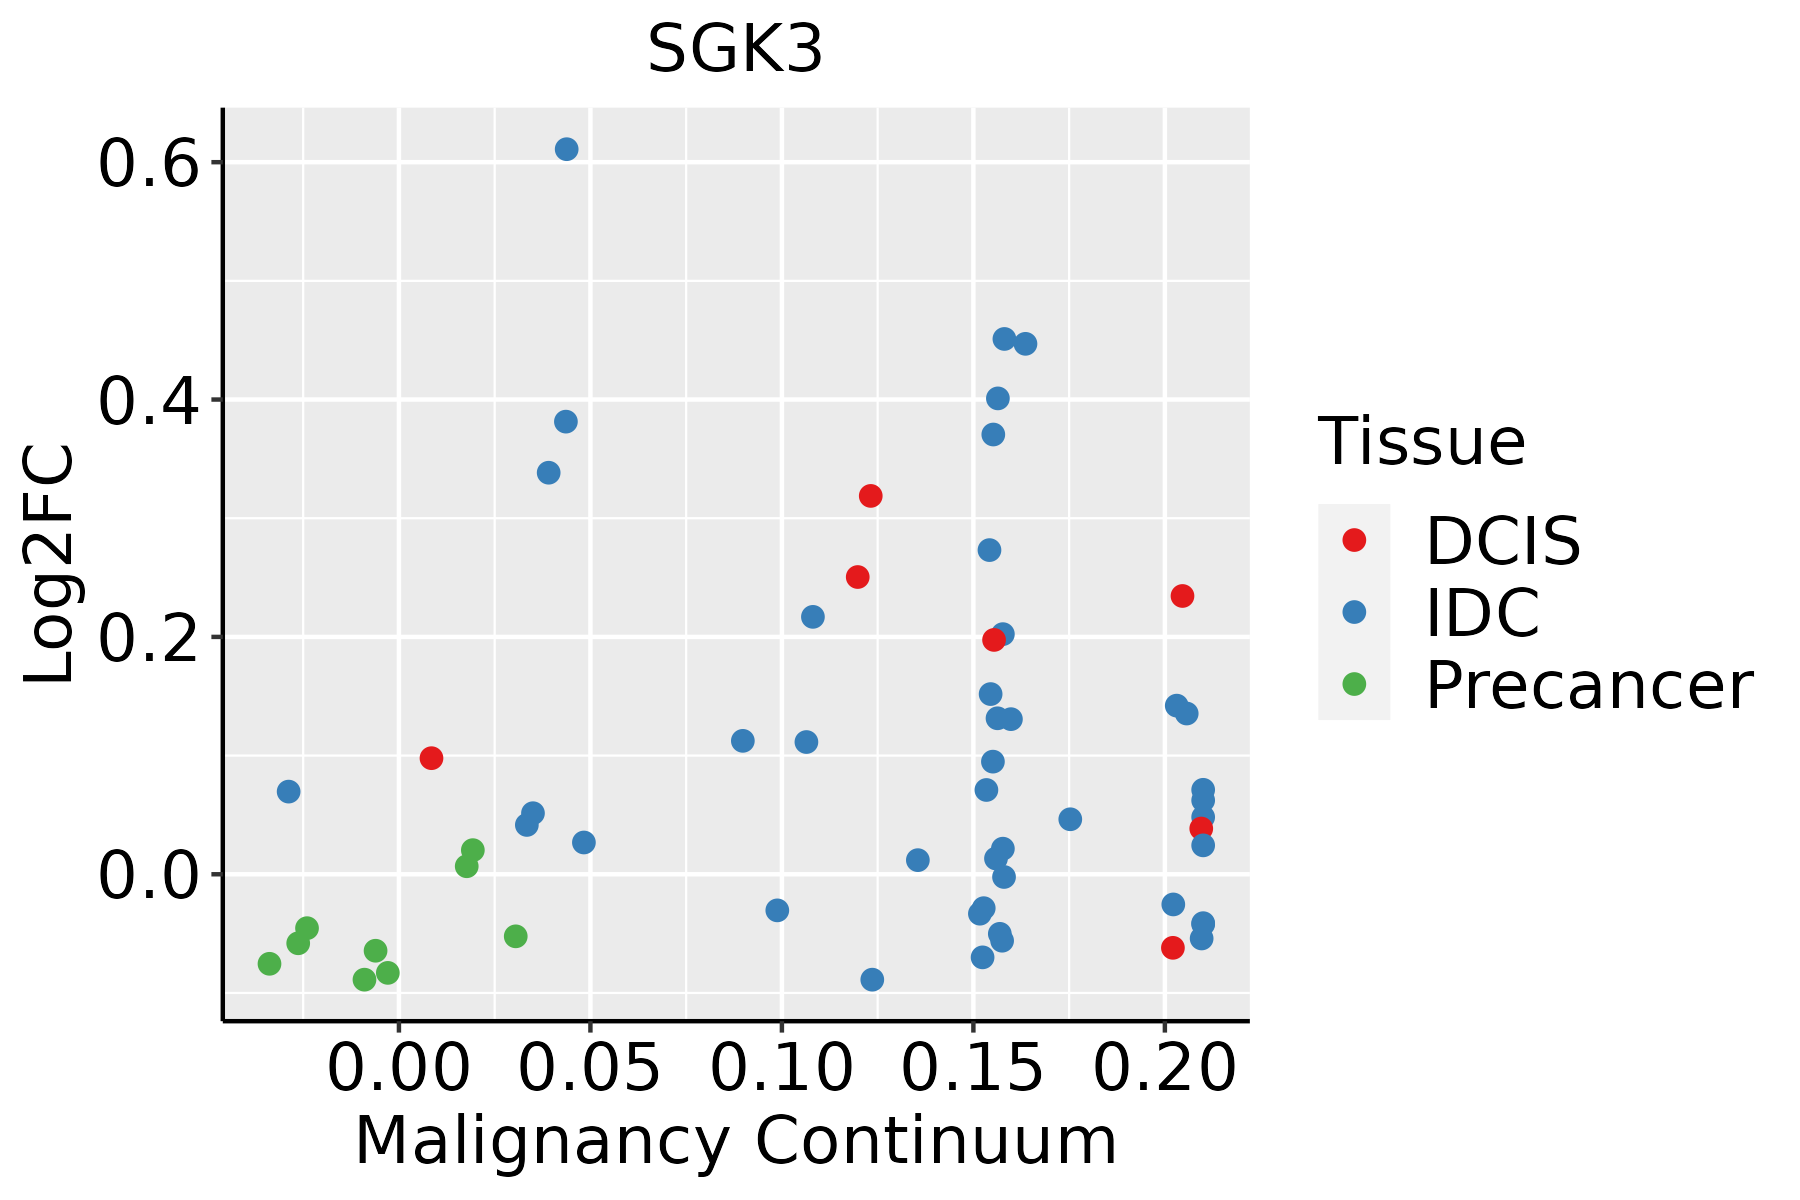 | IDC: Invasive ductal carcinoma |
| DCIS: Ductal carcinoma in situ | ||
| Precancer(BRCA1-mut): Precancerous lesion from BRCA1 mutation carriers | ||
| Cervix | 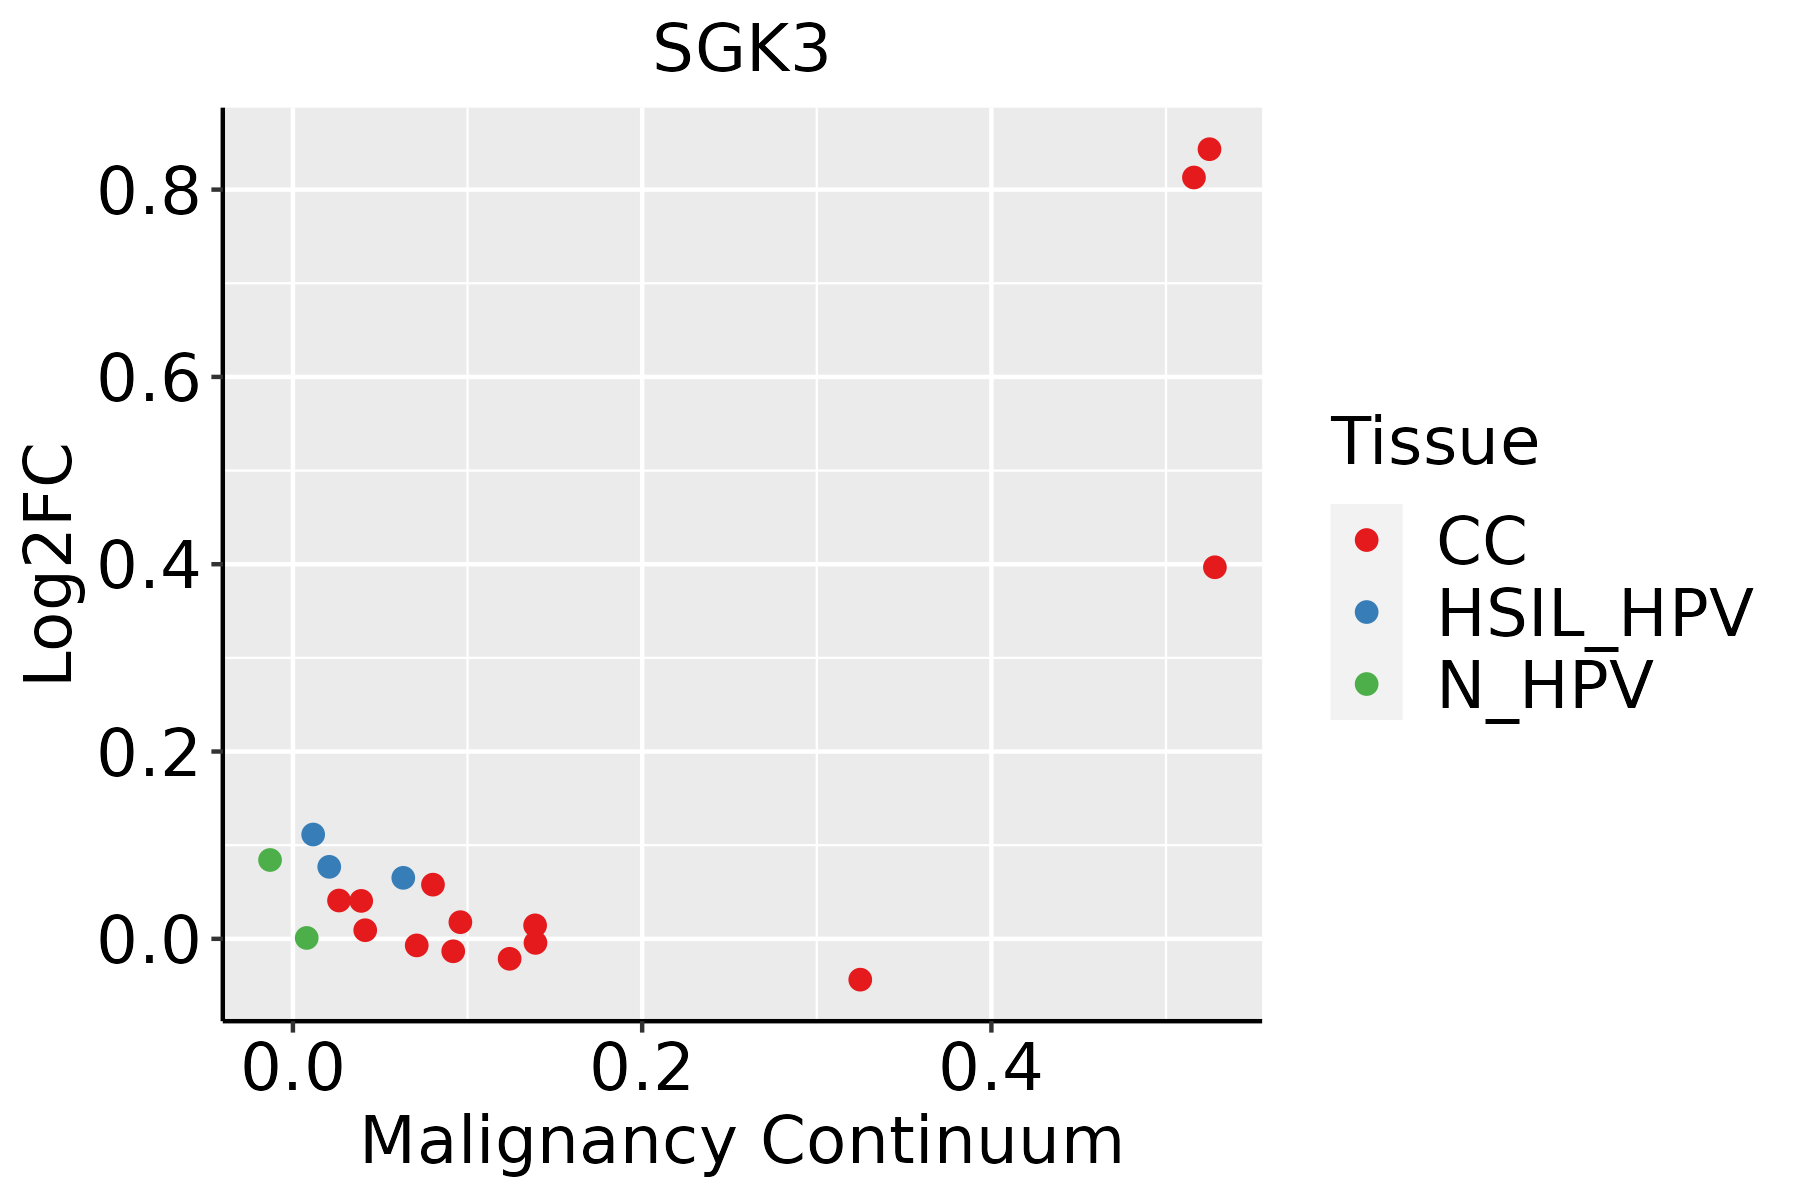 | CC: Cervix cancer |
| HSIL_HPV: HPV-infected high-grade squamous intraepithelial lesions | ||
| N_HPV: HPV-infected normal cervix | ||
| Colorectum (GSE201348) |  | FAP: Familial adenomatous polyposis |
| CRC: Colorectal cancer | ||
| Colorectum (HTA11) |  | AD: Adenomas |
| SER: Sessile serrated lesions | ||
| MSI-H: Microsatellite-high colorectal cancer | ||
| MSS: Microsatellite stable colorectal cancer | ||
| Endometrium |  | AEH: Atypical endometrial hyperplasia |
| EEC: Endometrioid Cancer | ||
| Esophagus | 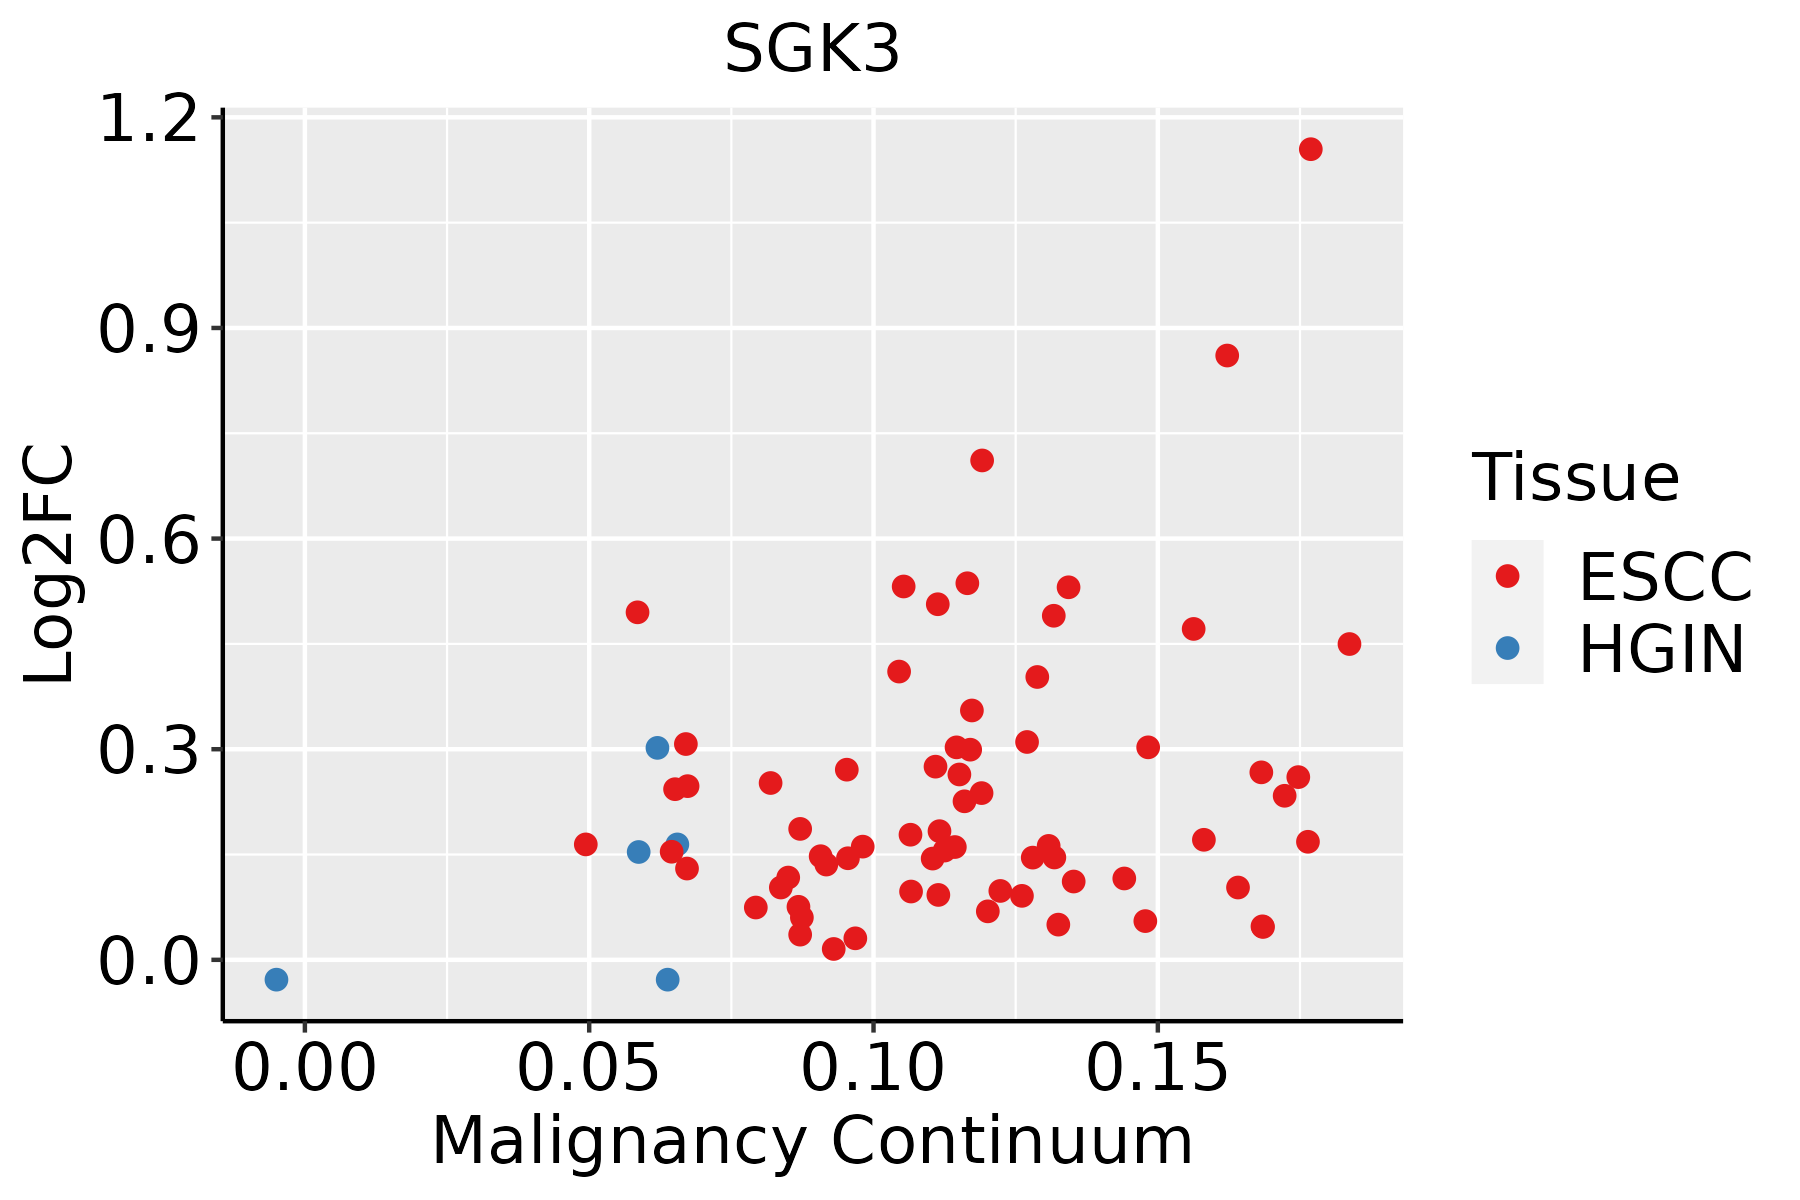 | ESCC: Esophageal squamous cell carcinoma |
| HGIN: High-grade intraepithelial neoplasias | ||
| LGIN: Low-grade intraepithelial neoplasias | ||
| Thyroid | 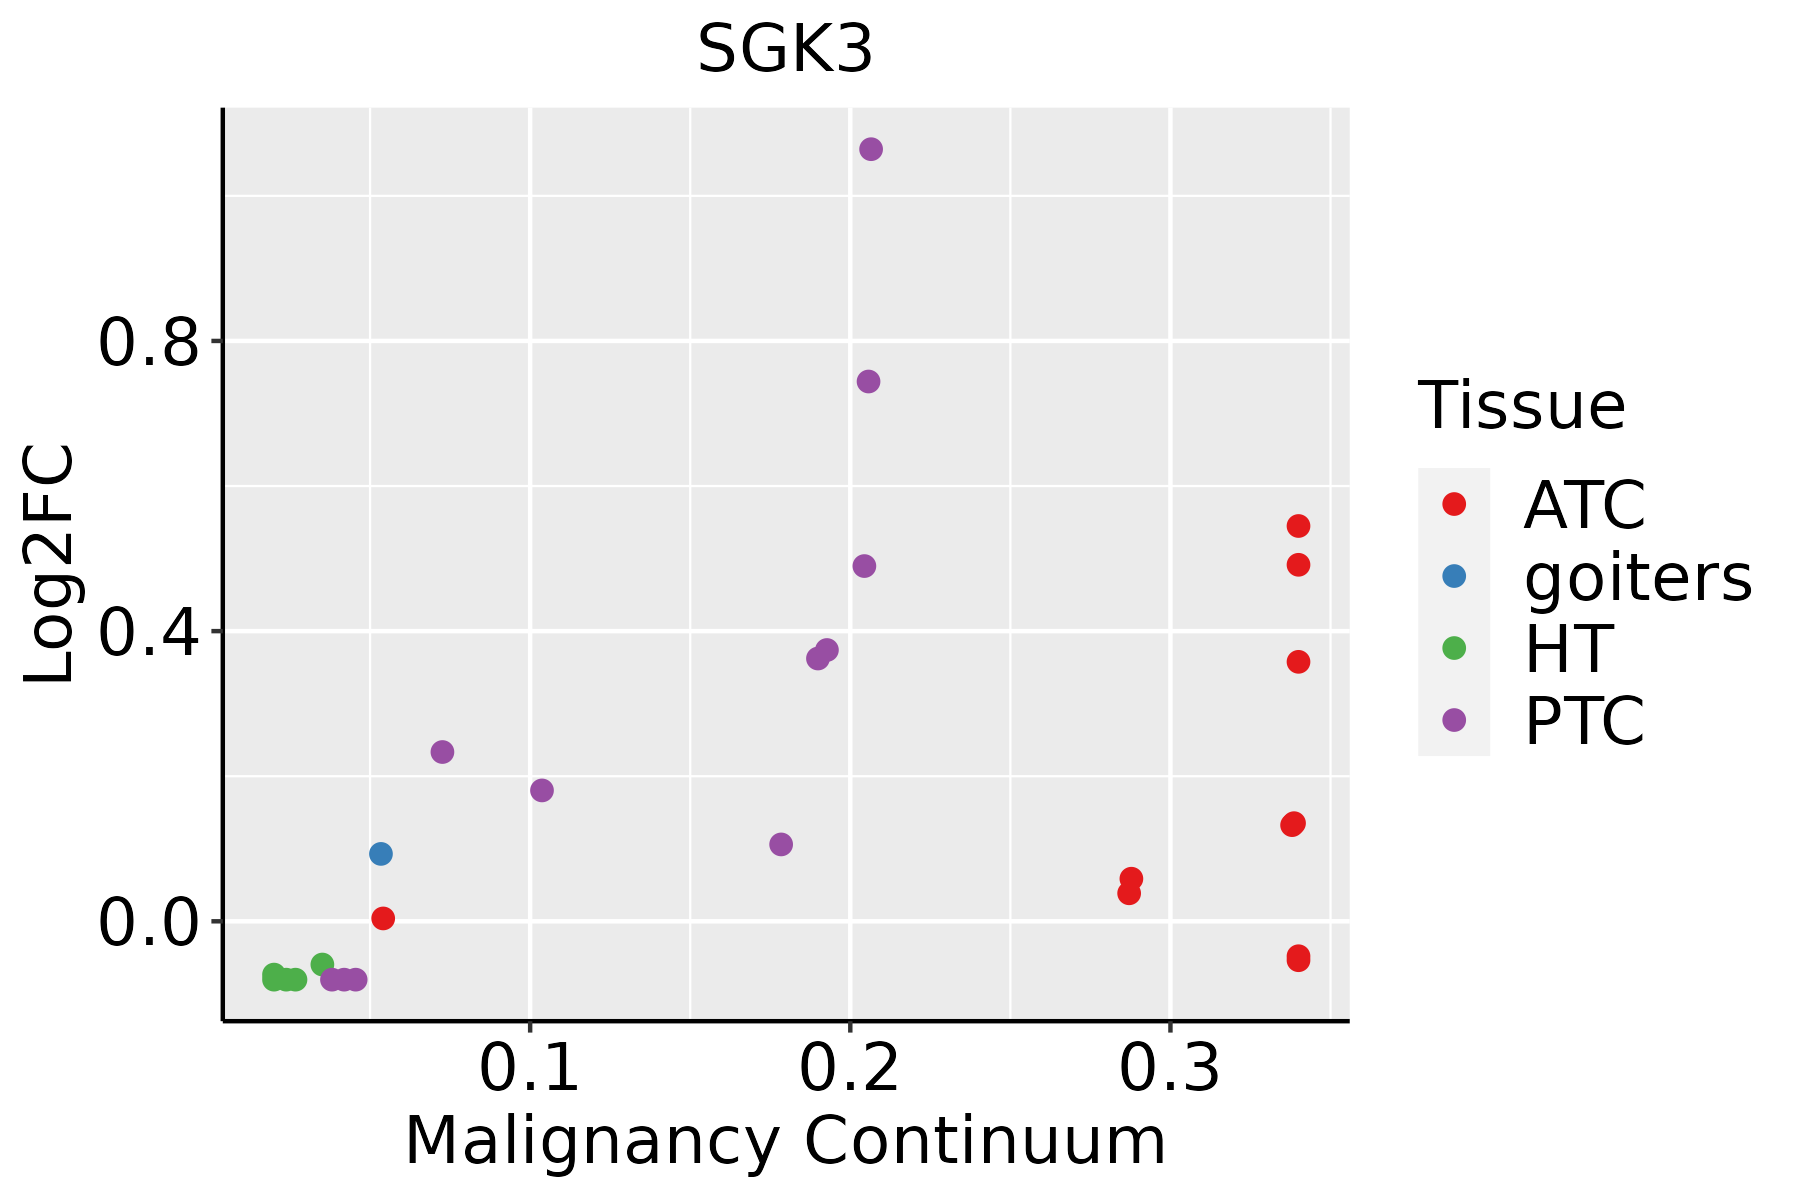 | ATC: Anaplastic thyroid cancer |
| HT: Hashimoto's thyroiditis | ||
| PTC: Papillary thyroid cancer |
| ∗log2FC in expression of this searched gene in stem-like cells from each diseased tissue sample relative to stem-like cells in normal samples in each tissue plotted against the malignancy continuum. Samples are colored based on if they are from different disease stage. |
Top |
Malignant transformation related pathway analysis |
| Find out the enriched GO biological processes and KEGG pathways involved in transition from healthy to precancer to cancer |
| Tissue | Disease Stage | Enriched GO biological Processes |
| Colorectum | AD |  |
| Colorectum | SER |  |
| Colorectum | MSS |  |
| Colorectum | MSI-H |  |
| Colorectum | FAP |  |
| ∗Top 15 enriched GO BP terms are showed in the bar plot of each disease state in each tissue. Each row represents a significant GO biological process which is colored according to the -log10(p.adjust). |
| Page: 1 2 3 4 5 6 7 8 9 |
| GO ID | Tissue | Disease Stage | Description | Gene Ratio | Bg Ratio | pvalue | p.adjust | Count |
| GO:001604913 | Breast | IDC | cell growth | 56/1434 | 482/18723 | 1.16e-03 | 1.26e-02 | 56 |
| GO:000155813 | Breast | IDC | regulation of cell growth | 49/1434 | 414/18723 | 1.55e-03 | 1.55e-02 | 49 |
| GO:001604923 | Breast | DCIS | cell growth | 54/1390 | 482/18723 | 1.60e-03 | 1.59e-02 | 54 |
| GO:000155822 | Breast | DCIS | regulation of cell growth | 47/1390 | 414/18723 | 2.39e-03 | 2.16e-02 | 47 |
| GO:00510904 | Cervix | CC | regulation of DNA-binding transcription factor activity | 87/2311 | 440/18723 | 4.85e-06 | 1.22e-04 | 87 |
| GO:00160498 | Cervix | CC | cell growth | 92/2311 | 482/18723 | 1.16e-05 | 2.49e-04 | 92 |
| GO:00181057 | Cervix | CC | peptidyl-serine phosphorylation | 63/2311 | 315/18723 | 6.65e-05 | 9.47e-04 | 63 |
| GO:00182096 | Cervix | CC | peptidyl-serine modification | 66/2311 | 338/18723 | 9.58e-05 | 1.25e-03 | 66 |
| GO:00015588 | Cervix | CC | regulation of cell growth | 77/2311 | 414/18723 | 1.40e-04 | 1.70e-03 | 77 |
| GO:0016049 | Colorectum | AD | cell growth | 143/3918 | 482/18723 | 2.83e-06 | 8.09e-05 | 143 |
| GO:0001558 | Colorectum | AD | regulation of cell growth | 124/3918 | 414/18723 | 7.67e-06 | 1.86e-04 | 124 |
| GO:0018105 | Colorectum | AD | peptidyl-serine phosphorylation | 88/3918 | 315/18723 | 1.73e-03 | 1.43e-02 | 88 |
| GO:0018209 | Colorectum | AD | peptidyl-serine modification | 92/3918 | 338/18723 | 3.19e-03 | 2.36e-02 | 92 |
| GO:00160492 | Colorectum | MSS | cell growth | 123/3467 | 482/18723 | 7.15e-05 | 1.21e-03 | 123 |
| GO:00015582 | Colorectum | MSS | regulation of cell growth | 105/3467 | 414/18723 | 2.97e-04 | 3.90e-03 | 105 |
| GO:00181052 | Colorectum | MSS | peptidyl-serine phosphorylation | 81/3467 | 315/18723 | 8.92e-04 | 9.12e-03 | 81 |
| GO:0051090 | Colorectum | MSS | regulation of DNA-binding transcription factor activity | 106/3467 | 440/18723 | 1.88e-03 | 1.65e-02 | 106 |
| GO:00182091 | Colorectum | MSS | peptidyl-serine modification | 84/3467 | 338/18723 | 2.12e-03 | 1.79e-02 | 84 |
| GO:00160493 | Colorectum | FAP | cell growth | 112/2622 | 482/18723 | 2.40e-08 | 2.30e-06 | 112 |
| GO:00015583 | Colorectum | FAP | regulation of cell growth | 95/2622 | 414/18723 | 5.02e-07 | 2.61e-05 | 95 |
| Page: 1 2 3 |
| Pathway ID | Tissue | Disease Stage | Description | Gene Ratio | Bg Ratio | pvalue | p.adjust | qvalue | Count |
| hsa04151 | Colorectum | FAP | PI3K-Akt signaling pathway | 75/1404 | 354/8465 | 1.23e-02 | 4.19e-02 | 2.55e-02 | 75 |
| hsa041511 | Colorectum | FAP | PI3K-Akt signaling pathway | 75/1404 | 354/8465 | 1.23e-02 | 4.19e-02 | 2.55e-02 | 75 |
| hsa041512 | Colorectum | CRC | PI3K-Akt signaling pathway | 64/1091 | 354/8465 | 2.70e-03 | 1.77e-02 | 1.20e-02 | 64 |
| hsa041513 | Colorectum | CRC | PI3K-Akt signaling pathway | 64/1091 | 354/8465 | 2.70e-03 | 1.77e-02 | 1.20e-02 | 64 |
| hsa040689 | Esophagus | ESCC | FoxO signaling pathway | 89/4205 | 131/8465 | 1.56e-05 | 7.98e-05 | 4.09e-05 | 89 |
| hsa041517 | Esophagus | ESCC | PI3K-Akt signaling pathway | 197/4205 | 354/8465 | 1.24e-02 | 2.83e-02 | 1.45e-02 | 197 |
| hsa0406814 | Esophagus | ESCC | FoxO signaling pathway | 89/4205 | 131/8465 | 1.56e-05 | 7.98e-05 | 4.09e-05 | 89 |
| hsa0415114 | Esophagus | ESCC | PI3K-Akt signaling pathway | 197/4205 | 354/8465 | 1.24e-02 | 2.83e-02 | 1.45e-02 | 197 |
| Page: 1 |
Top |
Cell-cell communication analysis |
| Identification of potential cell-cell interactions between two cell types and their ligand-receptor pairs for different disease states |
| Ligand | Receptor | LRpair | Pathway | Tissue | Disease Stage |
| Page: 1 |
Top |
Single-cell gene regulatory network inference analysis |
| Find out the significant the regulons (TFs) and the target genes of each regulon across cell types for different disease states |
| TF | Cell Type | Tissue | Disease Stage | Target Gene | RSS | Regulon Activity |
| ∗The dot plots of a searched regulon are shown for all cell subpopulations in each disease state of each tissue based on the regulon specific score inferred using pySCENIC and by calculating the average expression. |
| Page: 1 |
Top |
Somatic mutation of malignant transformation related genes |
| Annotation of somatic variants for genes involved in malignant transformation |
| Hugo Symbol | Variant Class | Variant Classification | dbSNP RS | HGVSc | HGVSp | HGVSp Short | SWISSPROT | BIOTYPE | SIFT | PolyPhen | Tumor Sample Barcode | Tissue | Histology | Sex | Age | Stage | Therapy Types | Drugs | Outcome |
| SGK3 | SNV | Missense_Mutation | c.425N>G | p.Ser142Cys | p.S142C | Q96BR1 | protein_coding | deleterious(0.03) | benign(0.052) | TCGA-BH-A208-01 | Breast | breast invasive carcinoma | Female | <65 | I/II | Unknown | Unknown | SD | |
| SGK3 | SNV | Missense_Mutation | c.217N>A | p.Pro73Thr | p.P73T | Q96BR1 | protein_coding | deleterious(0) | probably_damaging(1) | TCGA-E9-A226-01 | Breast | breast invasive carcinoma | Female | <65 | III/IV | Hormone Therapy | tamoxiphen | PD | |
| SGK3 | SNV | Missense_Mutation | c.550N>C | p.Asp184His | p.D184H | Q96BR1 | protein_coding | deleterious(0.01) | possibly_damaging(0.841) | TCGA-C5-A1BQ-01 | Cervix | cervical & endocervical cancer | Female | >=65 | III/IV | Chemotherapy | cisplatin | CR | |
| SGK3 | SNV | Missense_Mutation | c.550G>C | p.Asp184His | p.D184H | Q96BR1 | protein_coding | deleterious(0.01) | possibly_damaging(0.841) | TCGA-C5-A3HL-01 | Cervix | cervical & endocervical cancer | Female | >=65 | I/II | Unknown | Unknown | SD | |
| SGK3 | SNV | Missense_Mutation | novel | c.1136G>C | p.Ser379Thr | p.S379T | Q96BR1 | protein_coding | tolerated(0.41) | benign(0.001) | TCGA-VS-A8EC-01 | Cervix | cervical & endocervical cancer | Female | <65 | III/IV | Chemotherapy | carboplatin | CR |
| SGK3 | SNV | Missense_Mutation | novel | c.410N>A | p.Ser137Tyr | p.S137Y | Q96BR1 | protein_coding | tolerated(0.2) | benign(0.013) | TCGA-AZ-4315-01 | Colorectum | colon adenocarcinoma | Male | <65 | I/II | Unknown | Unknown | SD |
| SGK3 | SNV | Missense_Mutation | rs146507110 | c.64N>A | p.Asp22Asn | p.D22N | Q96BR1 | protein_coding | tolerated_low_confidence(0.34) | benign(0.003) | TCGA-CK-4951-01 | Colorectum | colon adenocarcinoma | Female | >=65 | I/II | Unknown | Unknown | PD |
| SGK3 | SNV | Missense_Mutation | novel | c.109N>A | p.Leu37Met | p.L37M | Q96BR1 | protein_coding | tolerated(0.2) | benign(0.079) | TCGA-AG-A002-01 | Colorectum | rectum adenocarcinoma | Male | <65 | I/II | Unknown | Unknown | SD |
| SGK3 | SNV | Missense_Mutation | rs772372105 | c.286G>A | p.Glu96Lys | p.E96K | Q96BR1 | protein_coding | tolerated(0.17) | possibly_damaging(0.85) | TCGA-A5-A2K5-01 | Endometrium | uterine corpus endometrioid carcinoma | Female | >=65 | I/II | Unknown | Unknown | SD |
| SGK3 | SNV | Missense_Mutation | novel | c.410C>A | p.Ser137Tyr | p.S137Y | Q96BR1 | protein_coding | tolerated(0.2) | benign(0.013) | TCGA-A5-A2K5-01 | Endometrium | uterine corpus endometrioid carcinoma | Female | >=65 | I/II | Unknown | Unknown | SD |
| Page: 1 2 3 4 5 |
Top |
Related drugs of malignant transformation related genes |
| Identification of chemicals and drugs interact with genes involved in malignant transfromation |
| (DGIdb 4.0) |
| Entrez ID | Symbol | Category | Interaction Types | Drug Claim Name | Drug Name | PMIDs |
| 23678 | SGK3 | DRUGGABLE GENOME, KINASE, SERINE THREONINE KINASE, ION CHANNEL, TRANSPORTER, ENZYME | inhibitor | 328083523 |
| Page: 1 |

Copyright 2023-Present -The University of Texas Health Science Center at Houston |