
|
|||||
|
 | |
| |
| |
| |
| |
| |
|
Gene: SGK1 |
Gene summary for SGK1 |
| Gene information | Species | Human | Gene symbol | SGK1 | Gene ID | 6446 |
| Gene name | serum/glucocorticoid regulated kinase 1 | |
| Gene Alias | SGK | |
| Cytomap | 6q23.2 | |
| Gene Type | protein-coding | GO ID | GO:0000902 | UniProtAcc | O00141 |
Top |
Malignant transformation analysis |
| Identification of the aberrant gene expression in precancerous and cancerous lesions by comparing the gene expression of stem-like cells in diseased tissues with normal stem cells |
| Entrez ID | Symbol | Replicates | Species | Organ | Tissue | Adj P-value | Log2FC | Malignancy |
| 6446 | SGK1 | GSM4909277 | Human | Breast | Precancer | 1.01e-02 | 7.69e-01 | 0.0177 |
| 6446 | SGK1 | GSM4909286 | Human | Breast | IDC | 5.29e-08 | -3.11e-01 | 0.1081 |
| 6446 | SGK1 | GSM4909290 | Human | Breast | IDC | 6.00e-03 | -2.70e-01 | 0.2096 |
| 6446 | SGK1 | GSM4909296 | Human | Breast | IDC | 3.18e-06 | -2.98e-01 | 0.1524 |
| 6446 | SGK1 | GSM4909301 | Human | Breast | IDC | 7.27e-12 | -3.06e-01 | 0.1577 |
| 6446 | SGK1 | GSM4909302 | Human | Breast | IDC | 3.25e-07 | -2.87e-01 | 0.1545 |
| 6446 | SGK1 | GSM4909304 | Human | Breast | IDC | 1.20e-05 | -2.91e-01 | 0.1636 |
| 6446 | SGK1 | GSM4909308 | Human | Breast | IDC | 1.49e-11 | -3.19e-01 | 0.158 |
| 6446 | SGK1 | GSM4909311 | Human | Breast | IDC | 4.07e-04 | -2.18e-01 | 0.1534 |
| 6446 | SGK1 | GSM4909312 | Human | Breast | IDC | 7.27e-12 | -3.19e-01 | 0.1552 |
| 6446 | SGK1 | GSM4909315 | Human | Breast | IDC | 3.45e-03 | -2.50e-01 | 0.21 |
| 6446 | SGK1 | GSM4909319 | Human | Breast | IDC | 1.75e-09 | -3.15e-01 | 0.1563 |
| 6446 | SGK1 | GSM4909320 | Human | Breast | IDC | 1.71e-03 | -3.19e-01 | 0.1575 |
| 6446 | SGK1 | GSM4909321 | Human | Breast | IDC | 6.42e-03 | -2.02e-01 | 0.1559 |
| 6446 | SGK1 | brca10 | Human | Breast | Precancer | 5.90e-05 | -2.64e-01 | -0.0029 |
| 6446 | SGK1 | M1 | Human | Breast | IDC | 1.59e-04 | -3.09e-01 | 0.1577 |
| 6446 | SGK1 | NCCBC14 | Human | Breast | DCIS | 1.86e-05 | -1.67e-01 | 0.2021 |
| 6446 | SGK1 | NCCBC5 | Human | Breast | DCIS | 8.19e-03 | -1.08e-01 | 0.2046 |
| 6446 | SGK1 | P1 | Human | Breast | IDC | 4.96e-03 | -1.45e-01 | 0.1527 |
| 6446 | SGK1 | P2 | Human | Breast | IDC | 5.46e-03 | -2.56e-01 | 0.21 |
| Page: 1 2 3 4 5 6 7 |
| Tissue | Expression Dynamics | Abbreviation |
| Breast | 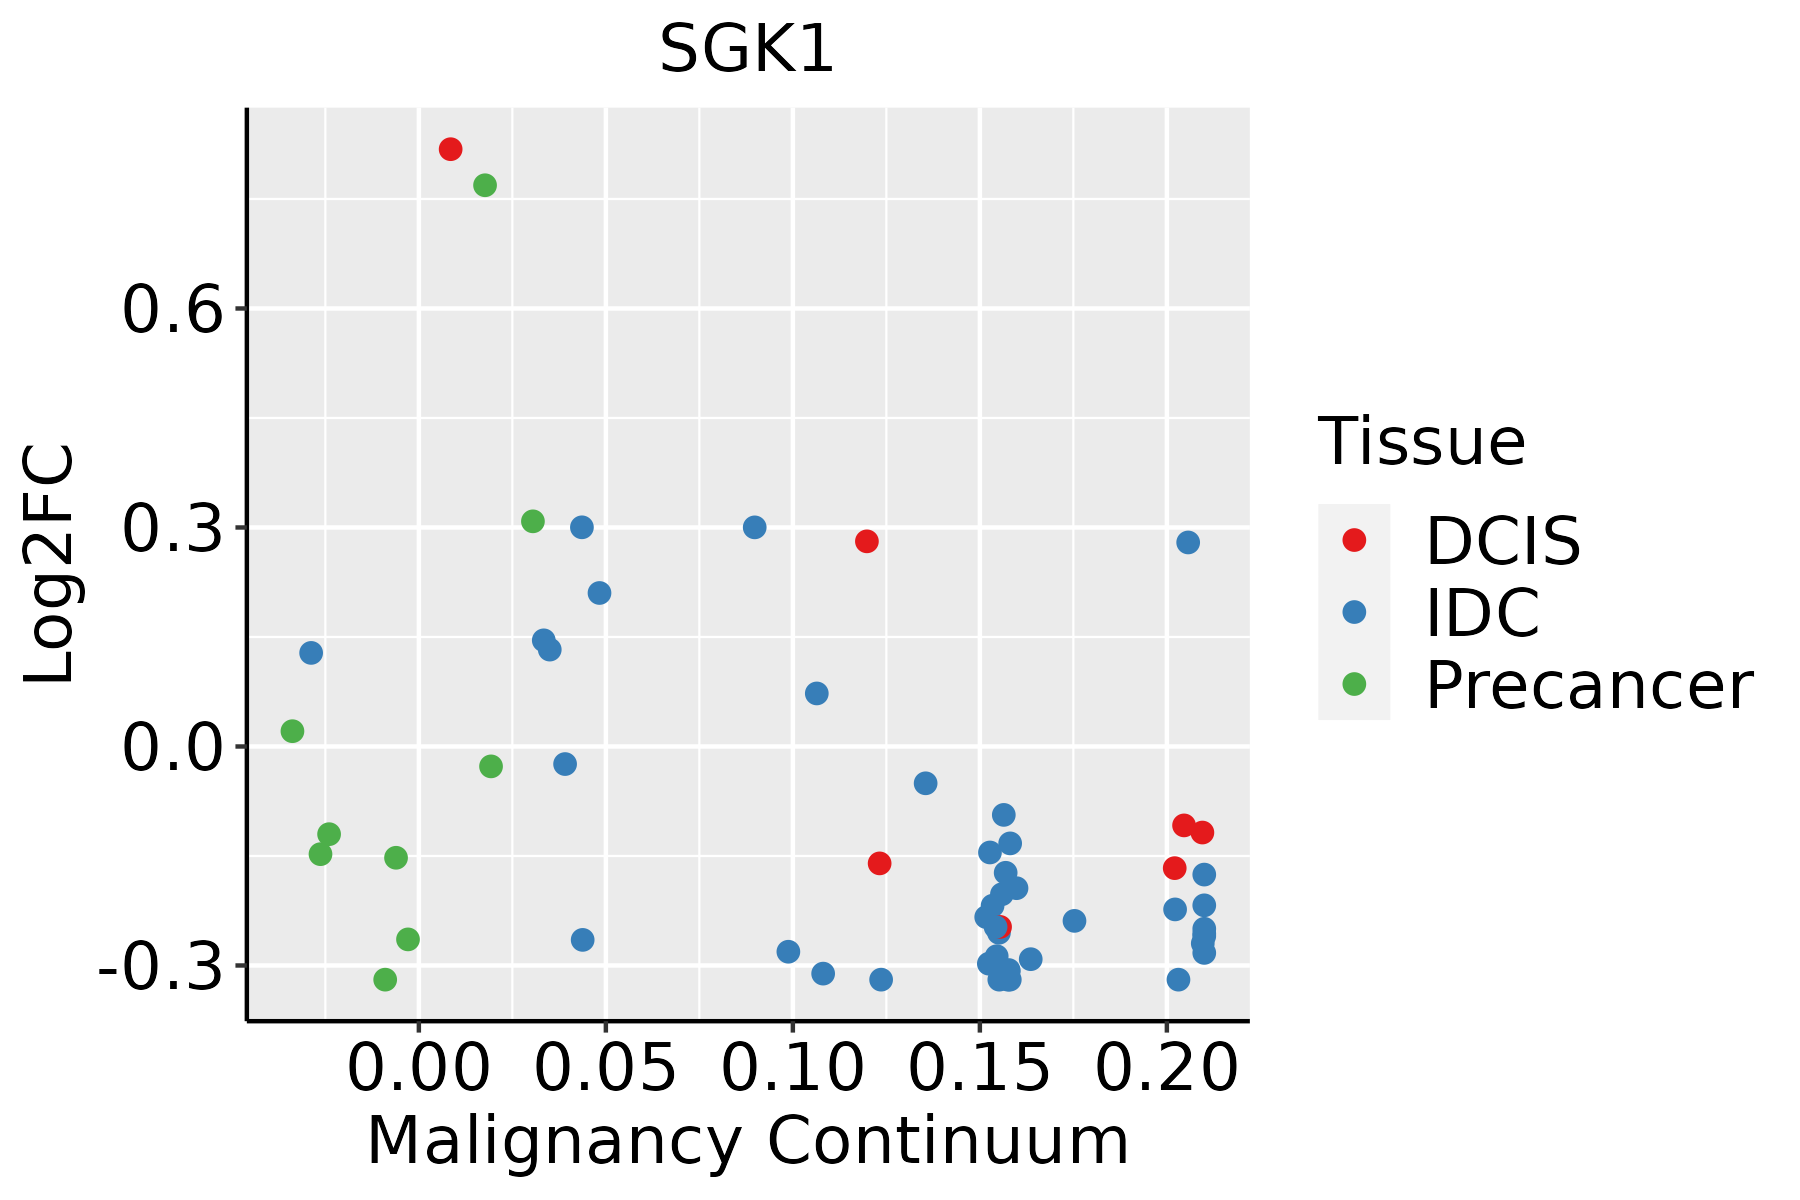 | IDC: Invasive ductal carcinoma |
| DCIS: Ductal carcinoma in situ | ||
| Precancer(BRCA1-mut): Precancerous lesion from BRCA1 mutation carriers | ||
| Esophagus | 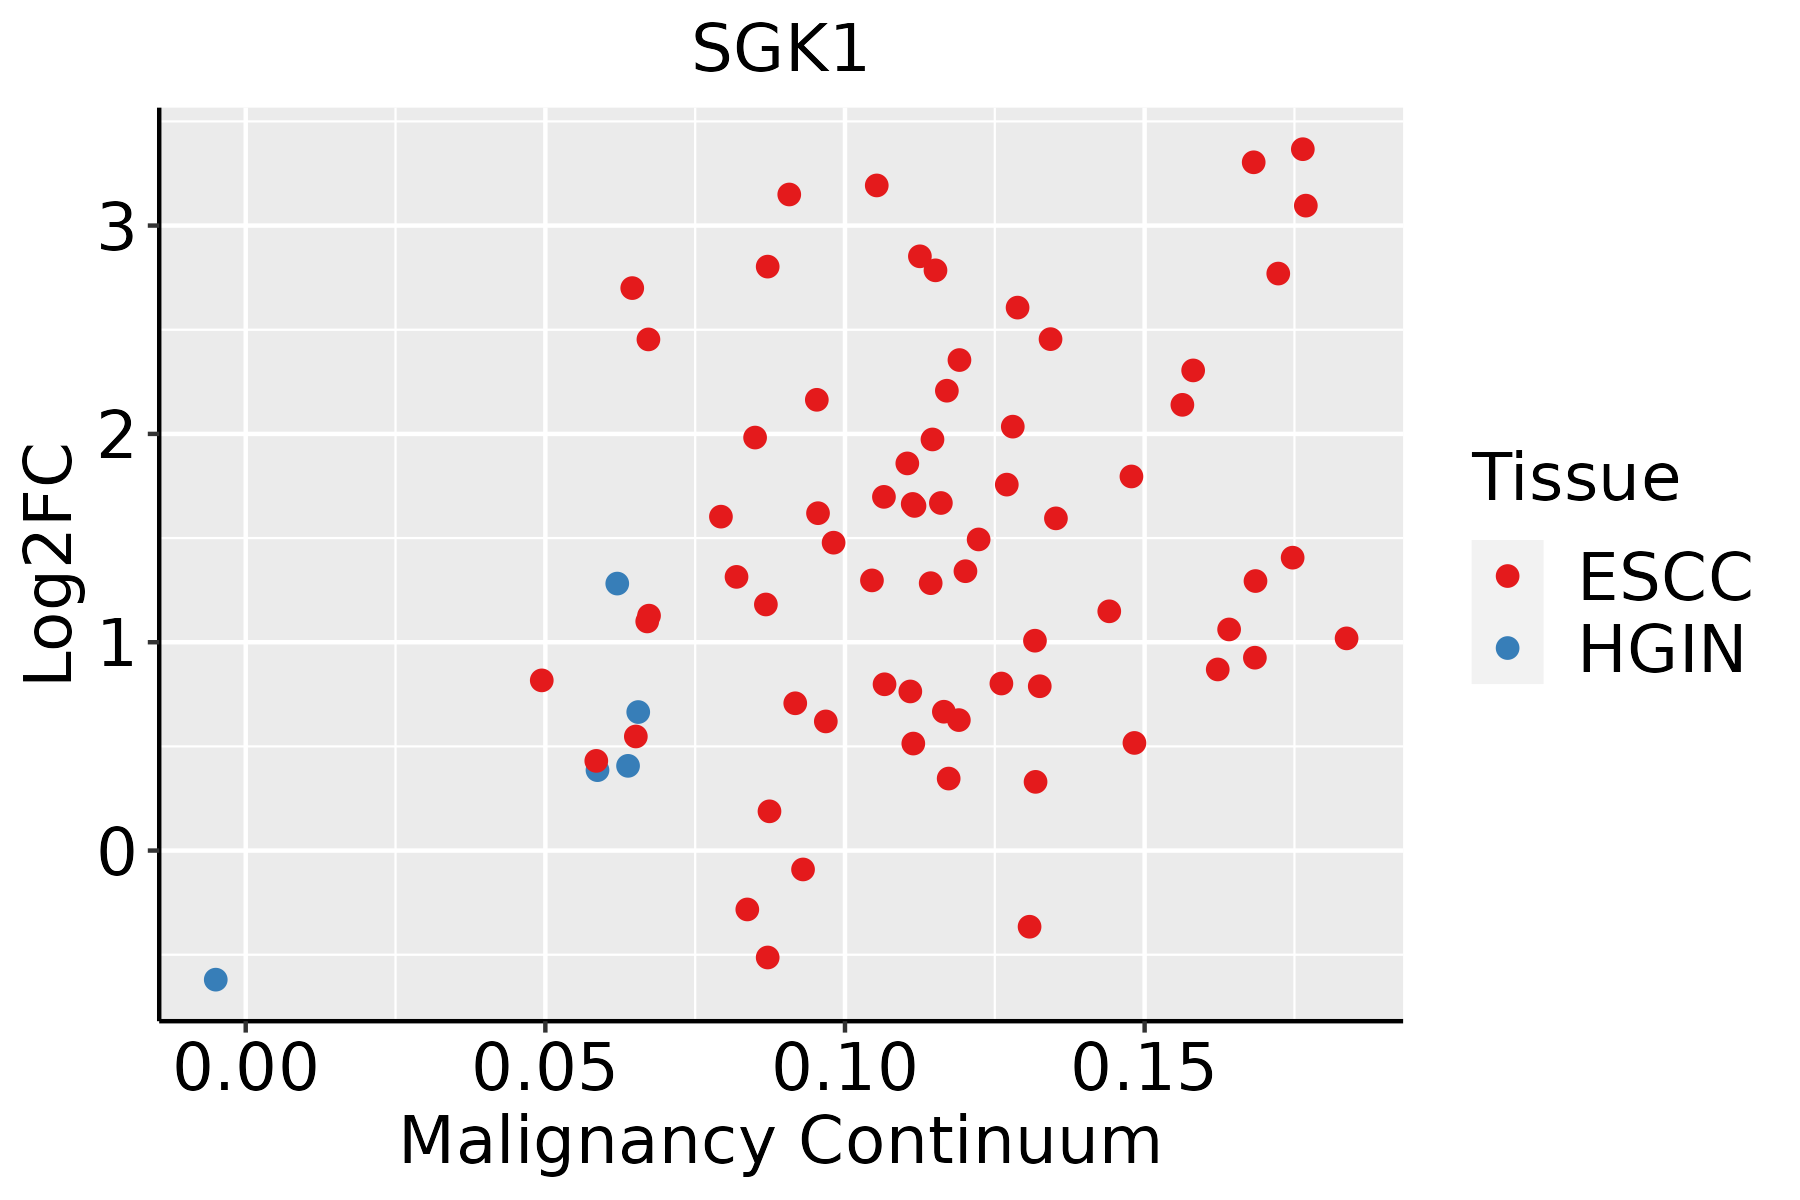 | ESCC: Esophageal squamous cell carcinoma |
| HGIN: High-grade intraepithelial neoplasias | ||
| LGIN: Low-grade intraepithelial neoplasias | ||
| Oral Cavity | 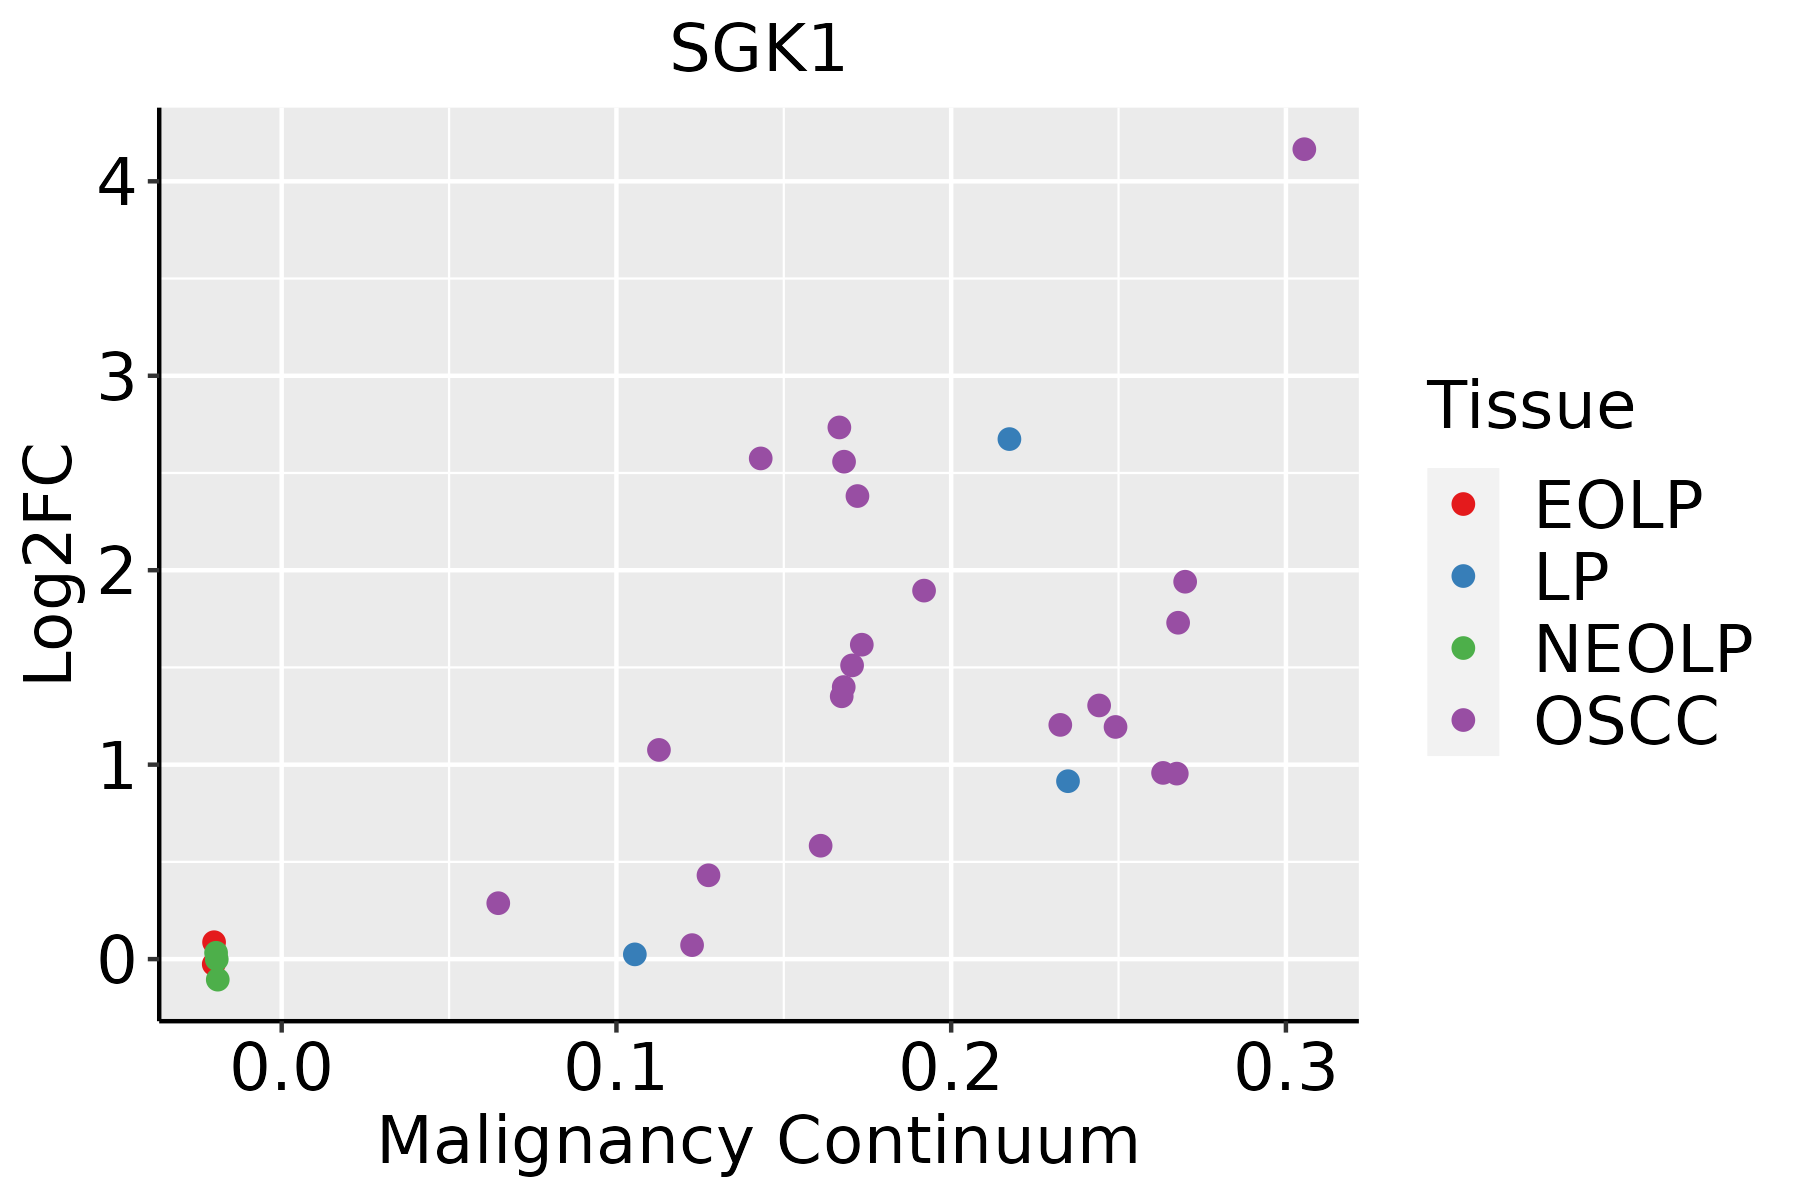 | EOLP: Erosive Oral lichen planus |
| LP: leukoplakia | ||
| NEOLP: Non-erosive oral lichen planus | ||
| OSCC: Oral squamous cell carcinoma | ||
| Prostate |  | BPH: Benign Prostatic Hyperplasia |
| Skin |  | AK: Actinic keratosis |
| cSCC: Cutaneous squamous cell carcinoma | ||
| SCCIS:squamous cell carcinoma in situ | ||
| Thyroid | 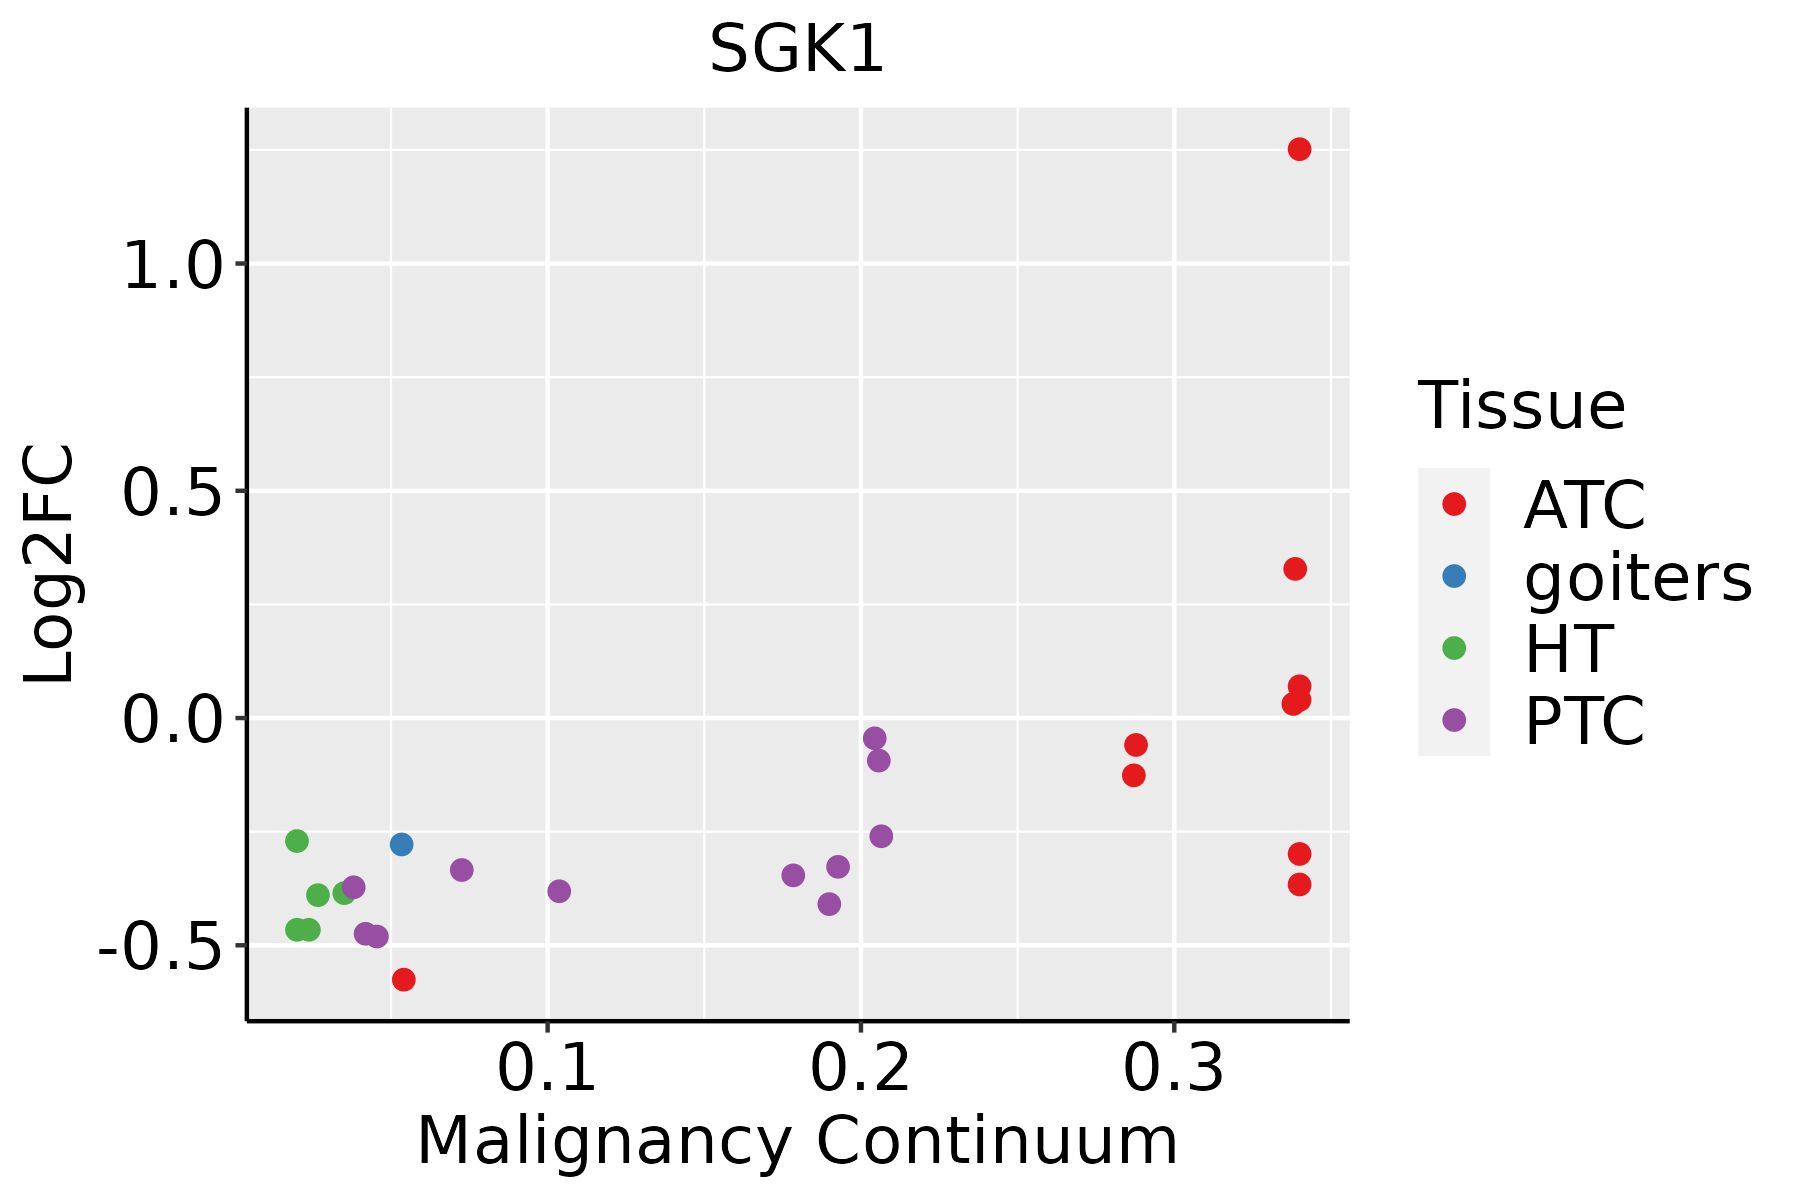 | ATC: Anaplastic thyroid cancer |
| HT: Hashimoto's thyroiditis | ||
| PTC: Papillary thyroid cancer |
| ∗log2FC in expression of this searched gene in stem-like cells from each diseased tissue sample relative to stem-like cells in normal samples in each tissue plotted against the malignancy continuum. Samples are colored based on if they are from different disease stage. |
Top |
Malignant transformation related pathway analysis |
| Find out the enriched GO biological processes and KEGG pathways involved in transition from healthy to precancer to cancer |
| Tissue | Disease Stage | Enriched GO biological Processes |
| Colorectum | AD |  |
| Colorectum | SER |  |
| Colorectum | MSS |  |
| Colorectum | MSI-H |  |
| Colorectum | FAP |  |
| ∗Top 15 enriched GO BP terms are showed in the bar plot of each disease state in each tissue. Each row represents a significant GO biological process which is colored according to the -log10(p.adjust). |
| Page: 1 2 3 4 5 6 7 8 9 |
| GO ID | Tissue | Disease Stage | Description | Gene Ratio | Bg Ratio | pvalue | p.adjust | Count |
| GO:19017969 | Breast | Precancer | regulation of signal transduction by p53 class mediator | 19/1080 | 93/18723 | 1.20e-06 | 4.60e-05 | 19 |
| GO:00723319 | Breast | Precancer | signal transduction by p53 class mediator | 26/1080 | 163/18723 | 2.23e-06 | 7.76e-05 | 26 |
| GO:00702933 | Breast | Precancer | renal absorption | 6/1080 | 17/18723 | 2.59e-04 | 3.83e-03 | 6 |
| GO:00160497 | Breast | Precancer | cell growth | 46/1080 | 482/18723 | 5.63e-04 | 7.16e-03 | 46 |
| GO:00324116 | Breast | Precancer | positive regulation of transporter activity | 16/1080 | 120/18723 | 1.46e-03 | 1.51e-02 | 16 |
| GO:00015587 | Breast | Precancer | regulation of cell growth | 39/1080 | 414/18723 | 1.81e-03 | 1.78e-02 | 39 |
| GO:007233114 | Breast | IDC | signal transduction by p53 class mediator | 30/1434 | 163/18723 | 5.82e-06 | 1.89e-04 | 30 |
| GO:190179614 | Breast | IDC | regulation of signal transduction by p53 class mediator | 20/1434 | 93/18723 | 2.00e-05 | 4.91e-04 | 20 |
| GO:003241111 | Breast | IDC | positive regulation of transporter activity | 20/1434 | 120/18723 | 7.64e-04 | 9.27e-03 | 20 |
| GO:001604913 | Breast | IDC | cell growth | 56/1434 | 482/18723 | 1.16e-03 | 1.26e-02 | 56 |
| GO:007029311 | Breast | IDC | renal absorption | 6/1434 | 17/18723 | 1.18e-03 | 1.28e-02 | 6 |
| GO:000155813 | Breast | IDC | regulation of cell growth | 49/1434 | 414/18723 | 1.55e-03 | 1.55e-02 | 49 |
| GO:00324096 | Breast | IDC | regulation of transporter activity | 37/1434 | 310/18723 | 4.77e-03 | 3.66e-02 | 37 |
| GO:007233124 | Breast | DCIS | signal transduction by p53 class mediator | 30/1390 | 163/18723 | 3.13e-06 | 1.02e-04 | 30 |
| GO:190179624 | Breast | DCIS | regulation of signal transduction by p53 class mediator | 20/1390 | 93/18723 | 1.27e-05 | 3.21e-04 | 20 |
| GO:003241121 | Breast | DCIS | positive regulation of transporter activity | 20/1390 | 120/18723 | 5.16e-04 | 6.73e-03 | 20 |
| GO:007029321 | Breast | DCIS | renal absorption | 6/1390 | 17/18723 | 1.00e-03 | 1.11e-02 | 6 |
| GO:001604923 | Breast | DCIS | cell growth | 54/1390 | 482/18723 | 1.60e-03 | 1.59e-02 | 54 |
| GO:000155822 | Breast | DCIS | regulation of cell growth | 47/1390 | 414/18723 | 2.39e-03 | 2.16e-02 | 47 |
| GO:003240912 | Breast | DCIS | regulation of transporter activity | 36/1390 | 310/18723 | 5.05e-03 | 3.74e-02 | 36 |
| Page: 1 2 3 4 5 |
| Pathway ID | Tissue | Disease Stage | Description | Gene Ratio | Bg Ratio | pvalue | p.adjust | qvalue | Count |
| hsa040689 | Esophagus | ESCC | FoxO signaling pathway | 89/4205 | 131/8465 | 1.56e-05 | 7.98e-05 | 4.09e-05 | 89 |
| hsa041505 | Esophagus | ESCC | mTOR signaling pathway | 98/4205 | 156/8465 | 5.81e-04 | 1.95e-03 | 9.97e-04 | 98 |
| hsa041517 | Esophagus | ESCC | PI3K-Akt signaling pathway | 197/4205 | 354/8465 | 1.24e-02 | 2.83e-02 | 1.45e-02 | 197 |
| hsa0406814 | Esophagus | ESCC | FoxO signaling pathway | 89/4205 | 131/8465 | 1.56e-05 | 7.98e-05 | 4.09e-05 | 89 |
| hsa0415013 | Esophagus | ESCC | mTOR signaling pathway | 98/4205 | 156/8465 | 5.81e-04 | 1.95e-03 | 9.97e-04 | 98 |
| hsa0415114 | Esophagus | ESCC | PI3K-Akt signaling pathway | 197/4205 | 354/8465 | 1.24e-02 | 2.83e-02 | 1.45e-02 | 197 |
| hsa040688 | Oral cavity | OSCC | FoxO signaling pathway | 85/3704 | 131/8465 | 7.50e-07 | 4.33e-06 | 2.21e-06 | 85 |
| hsa041504 | Oral cavity | OSCC | mTOR signaling pathway | 90/3704 | 156/8465 | 2.87e-04 | 9.15e-04 | 4.66e-04 | 90 |
| hsa041516 | Oral cavity | OSCC | PI3K-Akt signaling pathway | 185/3704 | 354/8465 | 6.26e-04 | 1.86e-03 | 9.49e-04 | 185 |
| hsa0406813 | Oral cavity | OSCC | FoxO signaling pathway | 85/3704 | 131/8465 | 7.50e-07 | 4.33e-06 | 2.21e-06 | 85 |
| hsa0415012 | Oral cavity | OSCC | mTOR signaling pathway | 90/3704 | 156/8465 | 2.87e-04 | 9.15e-04 | 4.66e-04 | 90 |
| hsa0415113 | Oral cavity | OSCC | PI3K-Akt signaling pathway | 185/3704 | 354/8465 | 6.26e-04 | 1.86e-03 | 9.49e-04 | 185 |
| hsa040687 | Prostate | BPH | FoxO signaling pathway | 54/1718 | 131/8465 | 3.05e-08 | 3.59e-07 | 2.22e-07 | 54 |
| hsa041515 | Prostate | BPH | PI3K-Akt signaling pathway | 104/1718 | 354/8465 | 2.07e-05 | 1.55e-04 | 9.61e-05 | 104 |
| hsa0406812 | Prostate | BPH | FoxO signaling pathway | 54/1718 | 131/8465 | 3.05e-08 | 3.59e-07 | 2.22e-07 | 54 |
| hsa0415112 | Prostate | BPH | PI3K-Akt signaling pathway | 104/1718 | 354/8465 | 2.07e-05 | 1.55e-04 | 9.61e-05 | 104 |
| hsa0406822 | Prostate | Tumor | FoxO signaling pathway | 54/1791 | 131/8465 | 1.32e-07 | 1.51e-06 | 9.36e-07 | 54 |
| hsa0415122 | Prostate | Tumor | PI3K-Akt signaling pathway | 105/1791 | 354/8465 | 7.42e-05 | 5.30e-04 | 3.28e-04 | 105 |
| hsa0406832 | Prostate | Tumor | FoxO signaling pathway | 54/1791 | 131/8465 | 1.32e-07 | 1.51e-06 | 9.36e-07 | 54 |
| hsa0415132 | Prostate | Tumor | PI3K-Akt signaling pathway | 105/1791 | 354/8465 | 7.42e-05 | 5.30e-04 | 3.28e-04 | 105 |
| Page: 1 |
Top |
Cell-cell communication analysis |
| Identification of potential cell-cell interactions between two cell types and their ligand-receptor pairs for different disease states |
| Ligand | Receptor | LRpair | Pathway | Tissue | Disease Stage |
| Page: 1 |
Top |
Single-cell gene regulatory network inference analysis |
| Find out the significant the regulons (TFs) and the target genes of each regulon across cell types for different disease states |
| TF | Cell Type | Tissue | Disease Stage | Target Gene | RSS | Regulon Activity |
| ∗The dot plots of a searched regulon are shown for all cell subpopulations in each disease state of each tissue based on the regulon specific score inferred using pySCENIC and by calculating the average expression. |
| Page: 1 |
Top |
Somatic mutation of malignant transformation related genes |
| Annotation of somatic variants for genes involved in malignant transformation |
| Hugo Symbol | Variant Class | Variant Classification | dbSNP RS | HGVSc | HGVSp | HGVSp Short | SWISSPROT | BIOTYPE | SIFT | PolyPhen | Tumor Sample Barcode | Tissue | Histology | Sex | Age | Stage | Therapy Types | Drugs | Outcome |
| SGK1 | SNV | Missense_Mutation | c.457T>G | p.Leu153Val | p.L153V | O00141 | protein_coding | deleterious(0.02) | possibly_damaging(0.837) | TCGA-A8-A081-01 | Breast | breast invasive carcinoma | Female | >=65 | I/II | Unknown | Unknown | SD | |
| SGK1 | SNV | Missense_Mutation | c.696N>C | p.Lys232Asn | p.K232N | O00141 | protein_coding | deleterious(0.03) | benign(0.184) | TCGA-E2-A1L7-01 | Breast | breast invasive carcinoma | Female | <65 | III/IV | Chemotherapy | cyclophosphamide | PD | |
| SGK1 | insertion | Nonsense_Mutation | novel | c.604_605insTCTGTTTTTCAGTATCTCGCACCTGAGGTGCTTCATAAGCA | p.Gly202ValfsTer9 | p.G202Vfs*9 | O00141 | protein_coding | TCGA-A8-A06X-01 | Breast | breast invasive carcinoma | Female | >=65 | I/II | Unknown | Unknown | SD | ||
| SGK1 | insertion | Nonsense_Mutation | novel | c.1318_1319insTTAATAACTAAAATTTATTGAAATGGTCTTGCAAT | p.Asp440ValfsTer4 | p.D440Vfs*4 | O00141 | protein_coding | TCGA-A8-A08H-01 | Breast | breast invasive carcinoma | Female | >=65 | I/II | Unknown | Unknown | SD | ||
| SGK1 | insertion | Nonsense_Mutation | novel | c.1149_1150insAGTTCATAAGAATAATCACTTACCTGGTTC | p.Tyr383_Glu384insSerSerTerGluTerSerLeuThrTrpPhe | p.Y383_E384insSS*E*SLTWF | O00141 | protein_coding | TCGA-BH-A0BA-01 | Breast | breast invasive carcinoma | Female | <65 | III/IV | Chemotherapy | cytoxan | SD | ||
| SGK1 | SNV | Missense_Mutation | c.262N>G | p.Trp88Gly | p.W88G | O00141 | protein_coding | deleterious_low_confidence(0) | probably_damaging(0.954) | TCGA-AA-3864-01 | Colorectum | colon adenocarcinoma | Male | >=65 | I/II | Unknown | Unknown | SD | |
| SGK1 | SNV | Missense_Mutation | c.36G>T | p.Lys12Asn | p.K12N | O00141 | protein_coding | deleterious_low_confidence(0) | benign(0) | TCGA-AA-A00N-01 | Colorectum | colon adenocarcinoma | Male | >=65 | I/II | Unknown | Unknown | PD | |
| SGK1 | SNV | Missense_Mutation | c.847N>A | p.Leu283Ile | p.L283I | O00141 | protein_coding | deleterious(0.03) | probably_damaging(1) | TCGA-AA-A010-01 | Colorectum | colon adenocarcinoma | Female | <65 | I/II | Chemotherapy | folinic | CR | |
| SGK1 | SNV | Missense_Mutation | rs772324787 | c.1255G>A | p.Ala419Thr | p.A419T | O00141 | protein_coding | deleterious(0.01) | possibly_damaging(0.563) | TCGA-AD-6901-01 | Colorectum | colon adenocarcinoma | Male | >=65 | I/II | Chemotherapy | xeloda | PD |
| SGK1 | SNV | Missense_Mutation | rs771674804 | c.10N>G | p.Lys4Glu | p.K4E | O00141 | protein_coding | deleterious_low_confidence(0.01) | benign(0.031) | TCGA-AG-3892-01 | Colorectum | rectum adenocarcinoma | Female | <65 | I/II | Unknown | Unknown | SD |
| Page: 1 2 3 4 5 6 7 |
Top |
Related drugs of malignant transformation related genes |
| Identification of chemicals and drugs interact with genes involved in malignant transfromation |
| (DGIdb 4.0) |
| Entrez ID | Symbol | Category | Interaction Types | Drug Claim Name | Drug Name | PMIDs |
| 6446 | SGK1 | SERINE THREONINE KINASE, KINASE, ENZYME, CLINICALLY ACTIONABLE, TRANSCRIPTION FACTOR, TRANSPORTER, ION CHANNEL, DRUGGABLE GENOME, DRUG RESISTANCE | ALPELISIB | ALPELISIB | 27451907 | |
| 6446 | SGK1 | SERINE THREONINE KINASE, KINASE, ENZYME, CLINICALLY ACTIONABLE, TRANSCRIPTION FACTOR, TRANSPORTER, ION CHANNEL, DRUGGABLE GENOME, DRUG RESISTANCE | CI-1040 | CI-1040 | ||
| 6446 | SGK1 | SERINE THREONINE KINASE, KINASE, ENZYME, CLINICALLY ACTIONABLE, TRANSCRIPTION FACTOR, TRANSPORTER, ION CHANNEL, DRUGGABLE GENOME, DRUG RESISTANCE | SALINE | SODIUM CHLORIDE | 16924469 | |
| 6446 | SGK1 | SERINE THREONINE KINASE, KINASE, ENZYME, CLINICALLY ACTIONABLE, TRANSCRIPTION FACTOR, TRANSPORTER, ION CHANNEL, DRUGGABLE GENOME, DRUG RESISTANCE | inhibitor | 405067332 | ||
| 6446 | SGK1 | SERINE THREONINE KINASE, KINASE, ENZYME, CLINICALLY ACTIONABLE, TRANSCRIPTION FACTOR, TRANSPORTER, ION CHANNEL, DRUGGABLE GENOME, DRUG RESISTANCE | inhibitor | 249565720 | ||
| 6446 | SGK1 | SERINE THREONINE KINASE, KINASE, ENZYME, CLINICALLY ACTIONABLE, TRANSCRIPTION FACTOR, TRANSPORTER, ION CHANNEL, DRUGGABLE GENOME, DRUG RESISTANCE | SGK1-INH | 27451907 | ||
| 6446 | SGK1 | SERINE THREONINE KINASE, KINASE, ENZYME, CLINICALLY ACTIONABLE, TRANSCRIPTION FACTOR, TRANSPORTER, ION CHANNEL, DRUGGABLE GENOME, DRUG RESISTANCE | inhibitor | 328083509 | ||
| 6446 | SGK1 | SERINE THREONINE KINASE, KINASE, ENZYME, CLINICALLY ACTIONABLE, TRANSCRIPTION FACTOR, TRANSPORTER, ION CHANNEL, DRUGGABLE GENOME, DRUG RESISTANCE | inhibitor | 328083523 |
| Page: 1 |

Copyright 2023-Present -The University of Texas Health Science Center at Houston |