
|
|||||
|
 | |
| |
| |
| |
| |
| |
|
Gene: SGIP1 |
Gene summary for SGIP1 |
| Gene information | Species | Human | Gene symbol | SGIP1 | Gene ID | 84251 |
| Gene name | SH3GL interacting endocytic adaptor 1 | |
| Gene Alias | SGIP1 | |
| Cytomap | 1p31.3 | |
| Gene Type | protein-coding | GO ID | GO:0002021 | UniProtAcc | Q9BQI5 |
Top |
Malignant transformation analysis |
| Identification of the aberrant gene expression in precancerous and cancerous lesions by comparing the gene expression of stem-like cells in diseased tissues with normal stem cells |
| Entrez ID | Symbol | Replicates | Species | Organ | Tissue | Adj P-value | Log2FC | Malignancy |
| 84251 | SGIP1 | C09 | Human | Oral cavity | OSCC | 1.94e-12 | 8.12e-01 | 0.1431 |
| 84251 | SGIP1 | EOLP-1 | Human | Oral cavity | EOLP | 7.26e-14 | 5.52e-01 | -0.0202 |
| 84251 | SGIP1 | EOLP-2 | Human | Oral cavity | EOLP | 3.85e-02 | 1.86e-01 | -0.0203 |
| 84251 | SGIP1 | NEOLP-1 | Human | Oral cavity | NEOLP | 1.06e-06 | 3.47e-01 | -0.0194 |
| 84251 | SGIP1 | NEOLP-2 | Human | Oral cavity | NEOLP | 1.96e-02 | 2.68e-01 | -0.0196 |
| 84251 | SGIP1 | PTC04 | Human | Thyroid | PTC | 7.60e-17 | 4.57e-01 | 0.1927 |
| 84251 | SGIP1 | ATC11 | Human | Thyroid | ATC | 1.13e-05 | 4.67e-01 | 0.3386 |
| 84251 | SGIP1 | ATC12 | Human | Thyroid | ATC | 2.79e-51 | 9.87e-01 | 0.34 |
| 84251 | SGIP1 | ATC3 | Human | Thyroid | ATC | 1.52e-02 | 1.66e-01 | 0.338 |
| 84251 | SGIP1 | ATC4 | Human | Thyroid | ATC | 1.81e-54 | 1.14e+00 | 0.34 |
| 84251 | SGIP1 | ATC5 | Human | Thyroid | ATC | 1.82e-02 | -6.23e-02 | 0.34 |
| Page: 1 |
| Tissue | Expression Dynamics | Abbreviation |
| Oral Cavity | 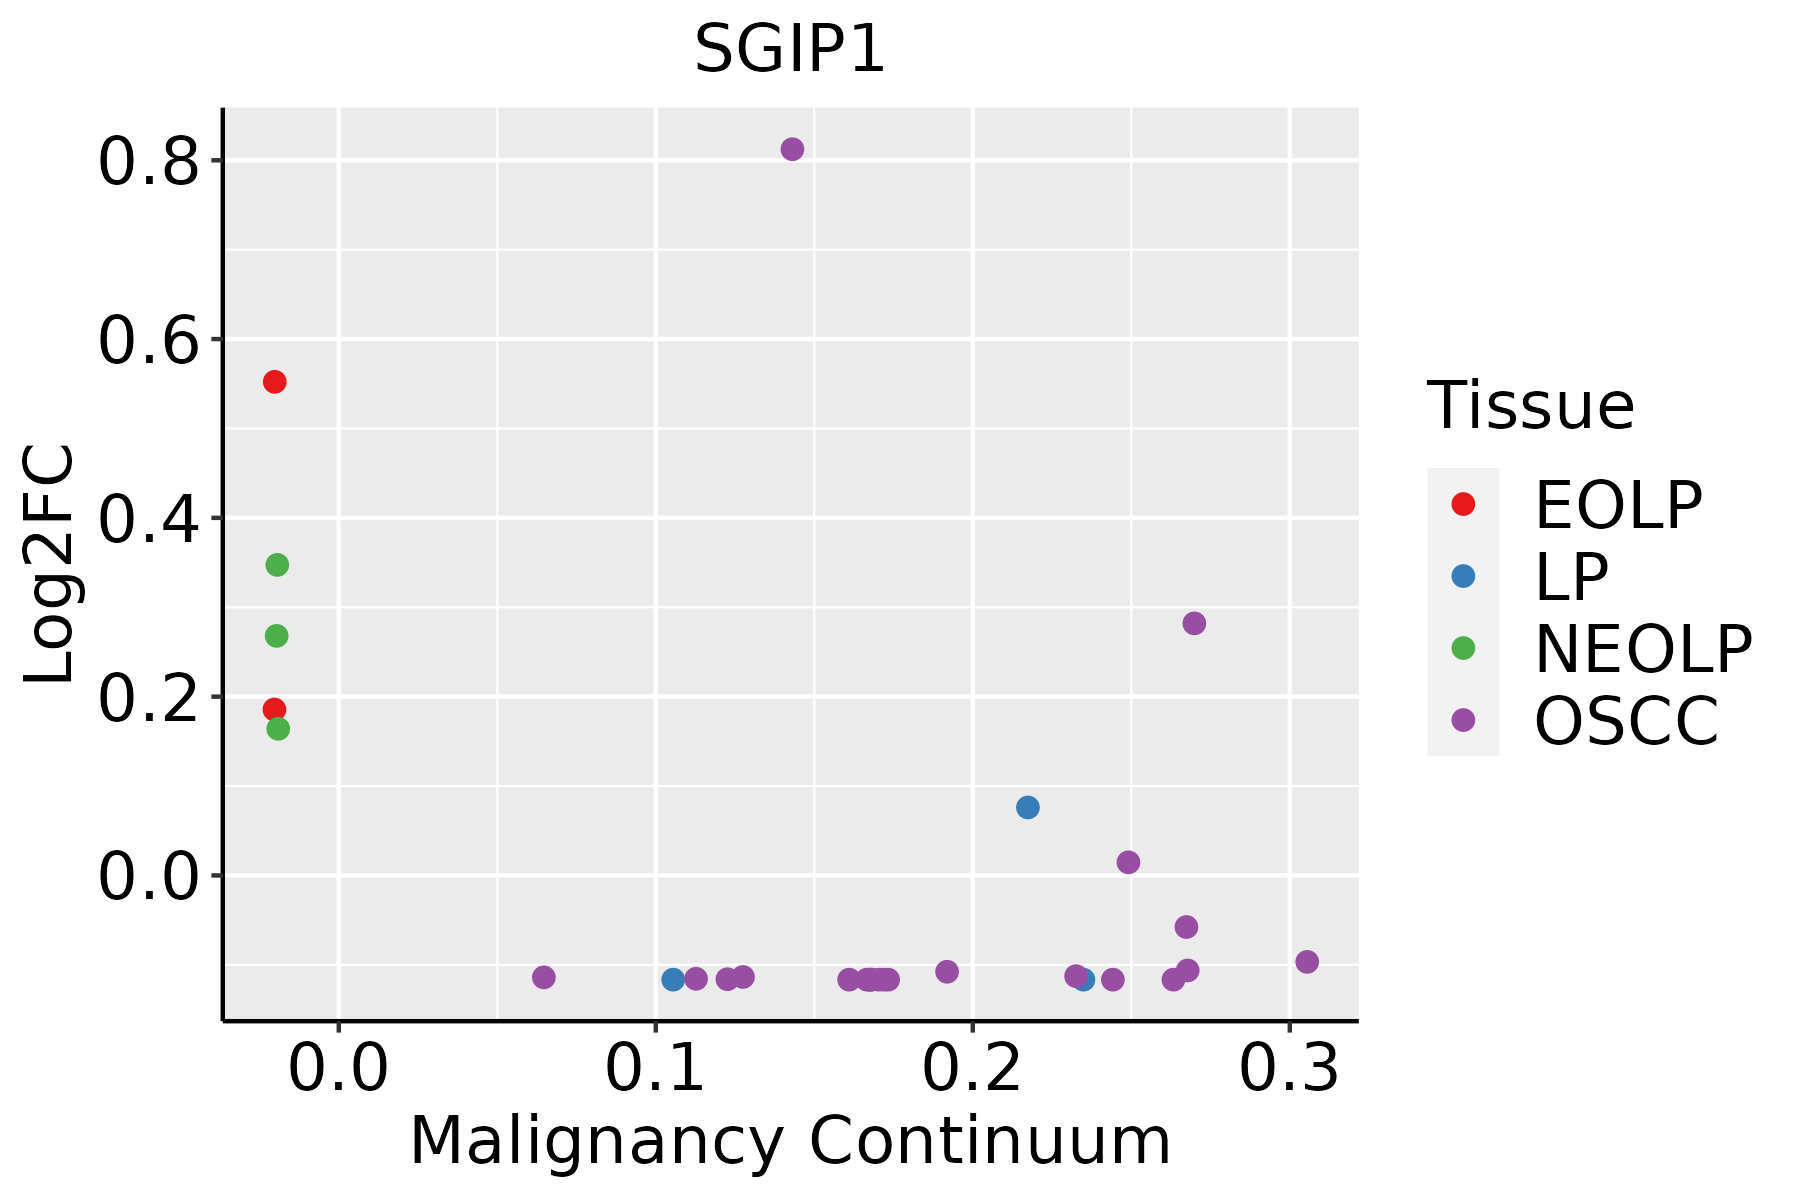 | EOLP: Erosive Oral lichen planus |
| LP: leukoplakia | ||
| NEOLP: Non-erosive oral lichen planus | ||
| OSCC: Oral squamous cell carcinoma | ||
| Thyroid | 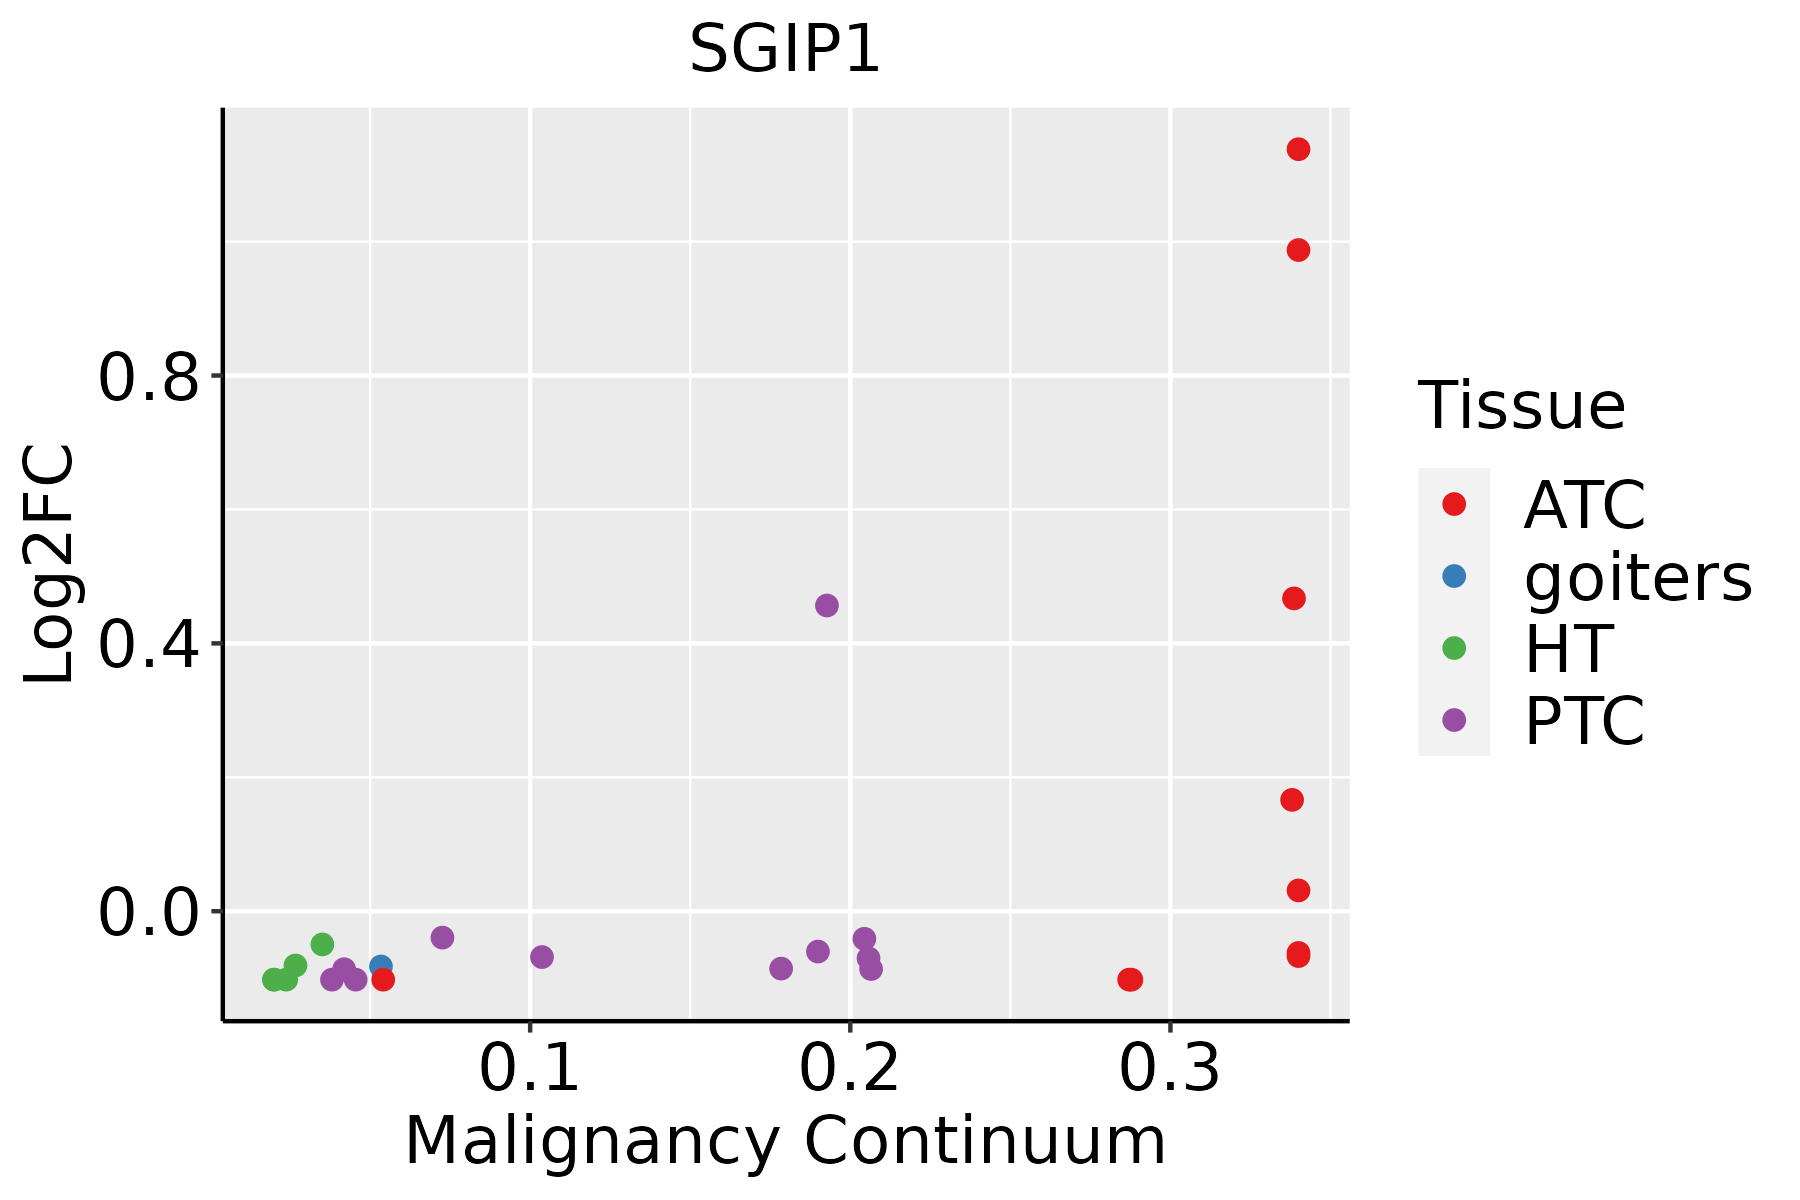 | ATC: Anaplastic thyroid cancer |
| HT: Hashimoto's thyroiditis | ||
| PTC: Papillary thyroid cancer |
| ∗log2FC in expression of this searched gene in stem-like cells from each diseased tissue sample relative to stem-like cells in normal samples in each tissue plotted against the malignancy continuum. Samples are colored based on if they are from different disease stage. |
Top |
Malignant transformation related pathway analysis |
| Find out the enriched GO biological processes and KEGG pathways involved in transition from healthy to precancer to cancer |
| Tissue | Disease Stage | Enriched GO biological Processes |
| Colorectum | AD |  |
| Colorectum | SER |  |
| Colorectum | MSS |  |
| Colorectum | MSI-H |  |
| Colorectum | FAP |  |
| ∗Top 15 enriched GO BP terms are showed in the bar plot of each disease state in each tissue. Each row represents a significant GO biological process which is colored according to the -log10(p.adjust). |
| Page: 1 2 3 4 5 6 7 8 9 |
| GO ID | Tissue | Disease Stage | Description | Gene Ratio | Bg Ratio | pvalue | p.adjust | Count |
| GO:003166720 | Oral cavity | OSCC | response to nutrient levels | 245/7305 | 474/18723 | 1.02e-08 | 2.10e-07 | 245 |
| GO:003010016 | Oral cavity | OSCC | regulation of endocytosis | 121/7305 | 211/18723 | 4.74e-08 | 8.80e-07 | 121 |
| GO:004580710 | Oral cavity | OSCC | positive regulation of endocytosis | 59/7305 | 100/18723 | 3.99e-05 | 3.48e-04 | 59 |
| GO:000689810 | Oral cavity | OSCC | receptor-mediated endocytosis | 125/7305 | 244/18723 | 6.56e-05 | 5.32e-04 | 125 |
| GO:00725838 | Oral cavity | OSCC | clathrin-dependent endocytosis | 30/7305 | 47/18723 | 4.96e-04 | 2.92e-03 | 30 |
| GO:004825910 | Oral cavity | OSCC | regulation of receptor-mediated endocytosis | 58/7305 | 110/18723 | 2.37e-03 | 1.05e-02 | 58 |
| GO:003010023 | Oral cavity | EOLP | regulation of endocytosis | 51/2218 | 211/18723 | 4.24e-07 | 1.19e-05 | 51 |
| GO:007258321 | Oral cavity | EOLP | clathrin-dependent endocytosis | 19/2218 | 47/18723 | 6.00e-07 | 1.56e-05 | 19 |
| GO:000689825 | Oral cavity | EOLP | receptor-mediated endocytosis | 55/2218 | 244/18723 | 1.64e-06 | 3.82e-05 | 55 |
| GO:004580724 | Oral cavity | EOLP | positive regulation of endocytosis | 27/2218 | 100/18723 | 2.69e-05 | 3.94e-04 | 27 |
| GO:004825915 | Oral cavity | EOLP | regulation of receptor-mediated endocytosis | 28/2218 | 110/18723 | 6.12e-05 | 7.68e-04 | 28 |
| GO:003166725 | Oral cavity | EOLP | response to nutrient levels | 82/2218 | 474/18723 | 2.59e-04 | 2.52e-03 | 82 |
| GO:00482689 | Oral cavity | EOLP | clathrin coat assembly | 8/2218 | 18/18723 | 5.58e-04 | 4.74e-03 | 8 |
| GO:00482609 | Oral cavity | EOLP | positive regulation of receptor-mediated endocytosis | 14/2218 | 52/18723 | 2.31e-03 | 1.42e-02 | 14 |
| GO:003010031 | Oral cavity | NEOLP | regulation of endocytosis | 47/2005 | 211/18723 | 7.96e-07 | 2.20e-05 | 47 |
| GO:000689831 | Oral cavity | NEOLP | receptor-mediated endocytosis | 51/2005 | 244/18723 | 2.08e-06 | 4.87e-05 | 51 |
| GO:004580731 | Oral cavity | NEOLP | positive regulation of endocytosis | 27/2005 | 100/18723 | 4.19e-06 | 9.05e-05 | 27 |
| GO:004826813 | Oral cavity | NEOLP | clathrin coat assembly | 9/2005 | 18/18723 | 3.59e-05 | 5.21e-04 | 9 |
| GO:007258331 | Oral cavity | NEOLP | clathrin-dependent endocytosis | 15/2005 | 47/18723 | 7.12e-05 | 9.27e-04 | 15 |
| GO:003166732 | Oral cavity | NEOLP | response to nutrient levels | 77/2005 | 474/18723 | 1.27e-04 | 1.49e-03 | 77 |
| Page: 1 2 |
| Pathway ID | Tissue | Disease Stage | Description | Gene Ratio | Bg Ratio | pvalue | p.adjust | qvalue | Count |
| Page: 1 |
Top |
Cell-cell communication analysis |
| Identification of potential cell-cell interactions between two cell types and their ligand-receptor pairs for different disease states |
| Ligand | Receptor | LRpair | Pathway | Tissue | Disease Stage |
| Page: 1 |
Top |
Single-cell gene regulatory network inference analysis |
| Find out the significant the regulons (TFs) and the target genes of each regulon across cell types for different disease states |
| TF | Cell Type | Tissue | Disease Stage | Target Gene | RSS | Regulon Activity |
| ∗The dot plots of a searched regulon are shown for all cell subpopulations in each disease state of each tissue based on the regulon specific score inferred using pySCENIC and by calculating the average expression. |
| Page: 1 |
Top |
Somatic mutation of malignant transformation related genes |
| Annotation of somatic variants for genes involved in malignant transformation |
| Hugo Symbol | Variant Class | Variant Classification | dbSNP RS | HGVSc | HGVSp | HGVSp Short | SWISSPROT | BIOTYPE | SIFT | PolyPhen | Tumor Sample Barcode | Tissue | Histology | Sex | Age | Stage | Therapy Types | Drugs | Outcome |
| SGIP1 | SNV | Missense_Mutation | c.2416G>C | p.Val806Leu | p.V806L | Q9BQI5 | protein_coding | tolerated(0.05) | benign(0.345) | TCGA-A7-A26F-01 | Breast | breast invasive carcinoma | Female | <65 | I/II | Chemotherapy | taxotere | SD | |
| SGIP1 | SNV | Missense_Mutation | rs369259312 | c.1241N>T | p.Pro414Leu | p.P414L | Q9BQI5 | protein_coding | tolerated(0.3) | benign(0.193) | TCGA-AC-A5XS-01 | Breast | breast invasive carcinoma | Female | >=65 | I/II | Hormone Therapy | femara | SD |
| SGIP1 | SNV | Missense_Mutation | c.2425N>T | p.Gly809Trp | p.G809W | Q9BQI5 | protein_coding | deleterious(0) | probably_damaging(0.995) | TCGA-AO-A128-01 | Breast | breast invasive carcinoma | Female | <65 | I/II | Chemotherapy | doxorubicin | SD | |
| SGIP1 | SNV | Missense_Mutation | novel | c.2423C>A | p.Ala808Glu | p.A808E | Q9BQI5 | protein_coding | deleterious(0.02) | benign(0.087) | TCGA-BH-A0DP-01 | Breast | breast invasive carcinoma | Female | <65 | I/II | Hormone Therapy | arimidex | SD |
| SGIP1 | SNV | Missense_Mutation | rs556202457 | c.475N>T | p.Arg159Cys | p.R159C | Q9BQI5 | protein_coding | deleterious(0) | probably_damaging(0.982) | TCGA-BH-AB28-01 | Breast | breast invasive carcinoma | Female | <65 | III/IV | Chemotherapy | taxotere | SD |
| SGIP1 | SNV | Missense_Mutation | novel | c.247N>A | p.Glu83Lys | p.E83K | Q9BQI5 | protein_coding | deleterious(0.01) | benign(0.173) | TCGA-C8-A8HP-01 | Breast | breast invasive carcinoma | Female | <65 | III/IV | Chemotherapy | 5-fluorouracil | CR |
| SGIP1 | SNV | Missense_Mutation | c.2269N>A | p.Pro757Thr | p.P757T | Q9BQI5 | protein_coding | tolerated(0.23) | benign(0.127) | TCGA-E2-A155-01 | Breast | breast invasive carcinoma | Female | <65 | I/II | Chemotherapy | cytoxan | SD | |
| SGIP1 | SNV | Missense_Mutation | c.2283N>T | p.Gln761His | p.Q761H | Q9BQI5 | protein_coding | tolerated(0.17) | benign(0.115) | TCGA-E2-A1LH-01 | Breast | breast invasive carcinoma | Female | <65 | I/II | Chemotherapy | adriamycin | SD | |
| SGIP1 | SNV | Missense_Mutation | novel | c.1483N>A | p.Pro495Thr | p.P495T | Q9BQI5 | protein_coding | deleterious(0.03) | probably_damaging(0.996) | TCGA-EW-A1J5-01 | Breast | breast invasive carcinoma | Female | <65 | I/II | Chemotherapy | adriamycin | SD |
| SGIP1 | SNV | Missense_Mutation | c.574G>A | p.Asp192Asn | p.D192N | Q9BQI5 | protein_coding | tolerated(0.34) | benign(0.086) | TCGA-EW-A1OV-01 | Breast | breast invasive carcinoma | Female | <65 | I/II | Chemotherapy | epirubicin | SD |
| Page: 1 2 3 4 5 6 7 8 9 10 11 12 13 14 15 16 |
Top |
Related drugs of malignant transformation related genes |
| Identification of chemicals and drugs interact with genes involved in malignant transfromation |
| (DGIdb 4.0) |
| Entrez ID | Symbol | Category | Interaction Types | Drug Claim Name | Drug Name | PMIDs |
| Page: 1 |

Copyright 2023-Present -The University of Texas Health Science Center at Houston |