
|
|||||
|
 | |
| |
| |
| |
| |
| |
|
Gene: SGF29 |
Gene summary for SGF29 |
| Gene information | Species | Human | Gene symbol | SGF29 | Gene ID | 112869 |
| Gene name | SAGA complex associated factor 29 | |
| Gene Alias | CCDC101 | |
| Cytomap | 16p11.2 | |
| Gene Type | protein-coding | GO ID | GO:0006464 | UniProtAcc | Q96ES7 |
Top |
Malignant transformation analysis |
| Identification of the aberrant gene expression in precancerous and cancerous lesions by comparing the gene expression of stem-like cells in diseased tissues with normal stem cells |
| Entrez ID | Symbol | Replicates | Species | Organ | Tissue | Adj P-value | Log2FC | Malignancy |
| 112869 | SGF29 | LZE4T | Human | Esophagus | ESCC | 9.25e-10 | 2.82e-01 | 0.0811 |
| 112869 | SGF29 | LZE8T | Human | Esophagus | ESCC | 2.33e-05 | 9.77e-02 | 0.067 |
| 112869 | SGF29 | LZE22D1 | Human | Esophagus | HGIN | 2.33e-07 | 2.46e-01 | 0.0595 |
| 112869 | SGF29 | LZE24T | Human | Esophagus | ESCC | 4.59e-30 | 8.47e-01 | 0.0596 |
| 112869 | SGF29 | LZE21T | Human | Esophagus | ESCC | 2.59e-05 | 2.41e-01 | 0.0655 |
| 112869 | SGF29 | P1T-E | Human | Esophagus | ESCC | 4.51e-11 | 5.04e-01 | 0.0875 |
| 112869 | SGF29 | P2T-E | Human | Esophagus | ESCC | 5.80e-25 | 5.17e-01 | 0.1177 |
| 112869 | SGF29 | P4T-E | Human | Esophagus | ESCC | 5.11e-28 | 7.73e-01 | 0.1323 |
| 112869 | SGF29 | P5T-E | Human | Esophagus | ESCC | 4.20e-15 | 2.70e-01 | 0.1327 |
| 112869 | SGF29 | P8T-E | Human | Esophagus | ESCC | 1.15e-20 | 3.93e-01 | 0.0889 |
| 112869 | SGF29 | P9T-E | Human | Esophagus | ESCC | 1.54e-13 | 2.87e-01 | 0.1131 |
| 112869 | SGF29 | P10T-E | Human | Esophagus | ESCC | 1.23e-19 | 2.63e-01 | 0.116 |
| 112869 | SGF29 | P11T-E | Human | Esophagus | ESCC | 2.69e-05 | 2.69e-01 | 0.1426 |
| 112869 | SGF29 | P12T-E | Human | Esophagus | ESCC | 1.99e-41 | 8.08e-01 | 0.1122 |
| 112869 | SGF29 | P15T-E | Human | Esophagus | ESCC | 4.47e-24 | 4.98e-01 | 0.1149 |
| 112869 | SGF29 | P16T-E | Human | Esophagus | ESCC | 1.03e-17 | 3.00e-01 | 0.1153 |
| 112869 | SGF29 | P17T-E | Human | Esophagus | ESCC | 3.65e-07 | 2.34e-01 | 0.1278 |
| 112869 | SGF29 | P20T-E | Human | Esophagus | ESCC | 3.17e-19 | 4.76e-01 | 0.1124 |
| 112869 | SGF29 | P21T-E | Human | Esophagus | ESCC | 3.48e-12 | 2.23e-01 | 0.1617 |
| 112869 | SGF29 | P22T-E | Human | Esophagus | ESCC | 1.65e-24 | 3.57e-01 | 0.1236 |
| Page: 1 2 3 4 |
| Tissue | Expression Dynamics | Abbreviation |
| Esophagus | 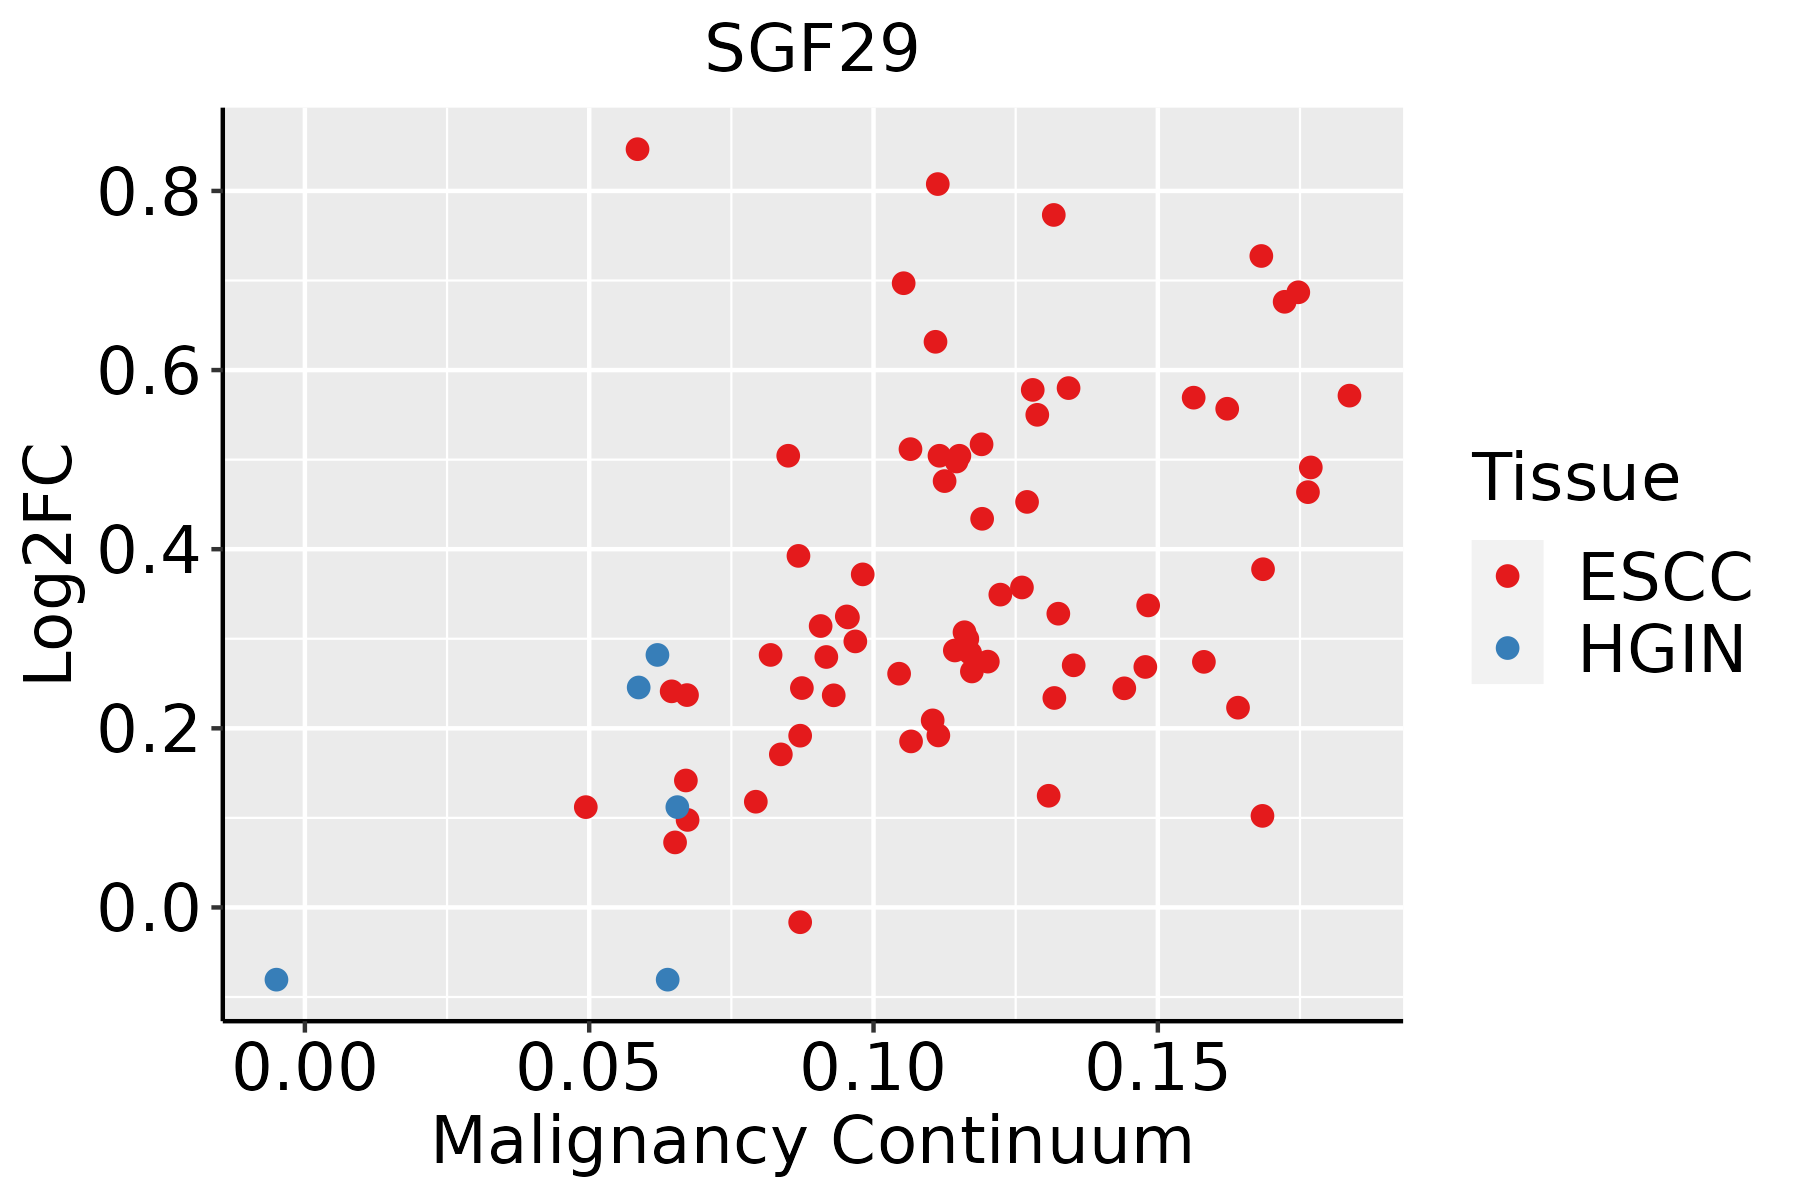 | ESCC: Esophageal squamous cell carcinoma |
| HGIN: High-grade intraepithelial neoplasias | ||
| LGIN: Low-grade intraepithelial neoplasias | ||
| Oral Cavity | 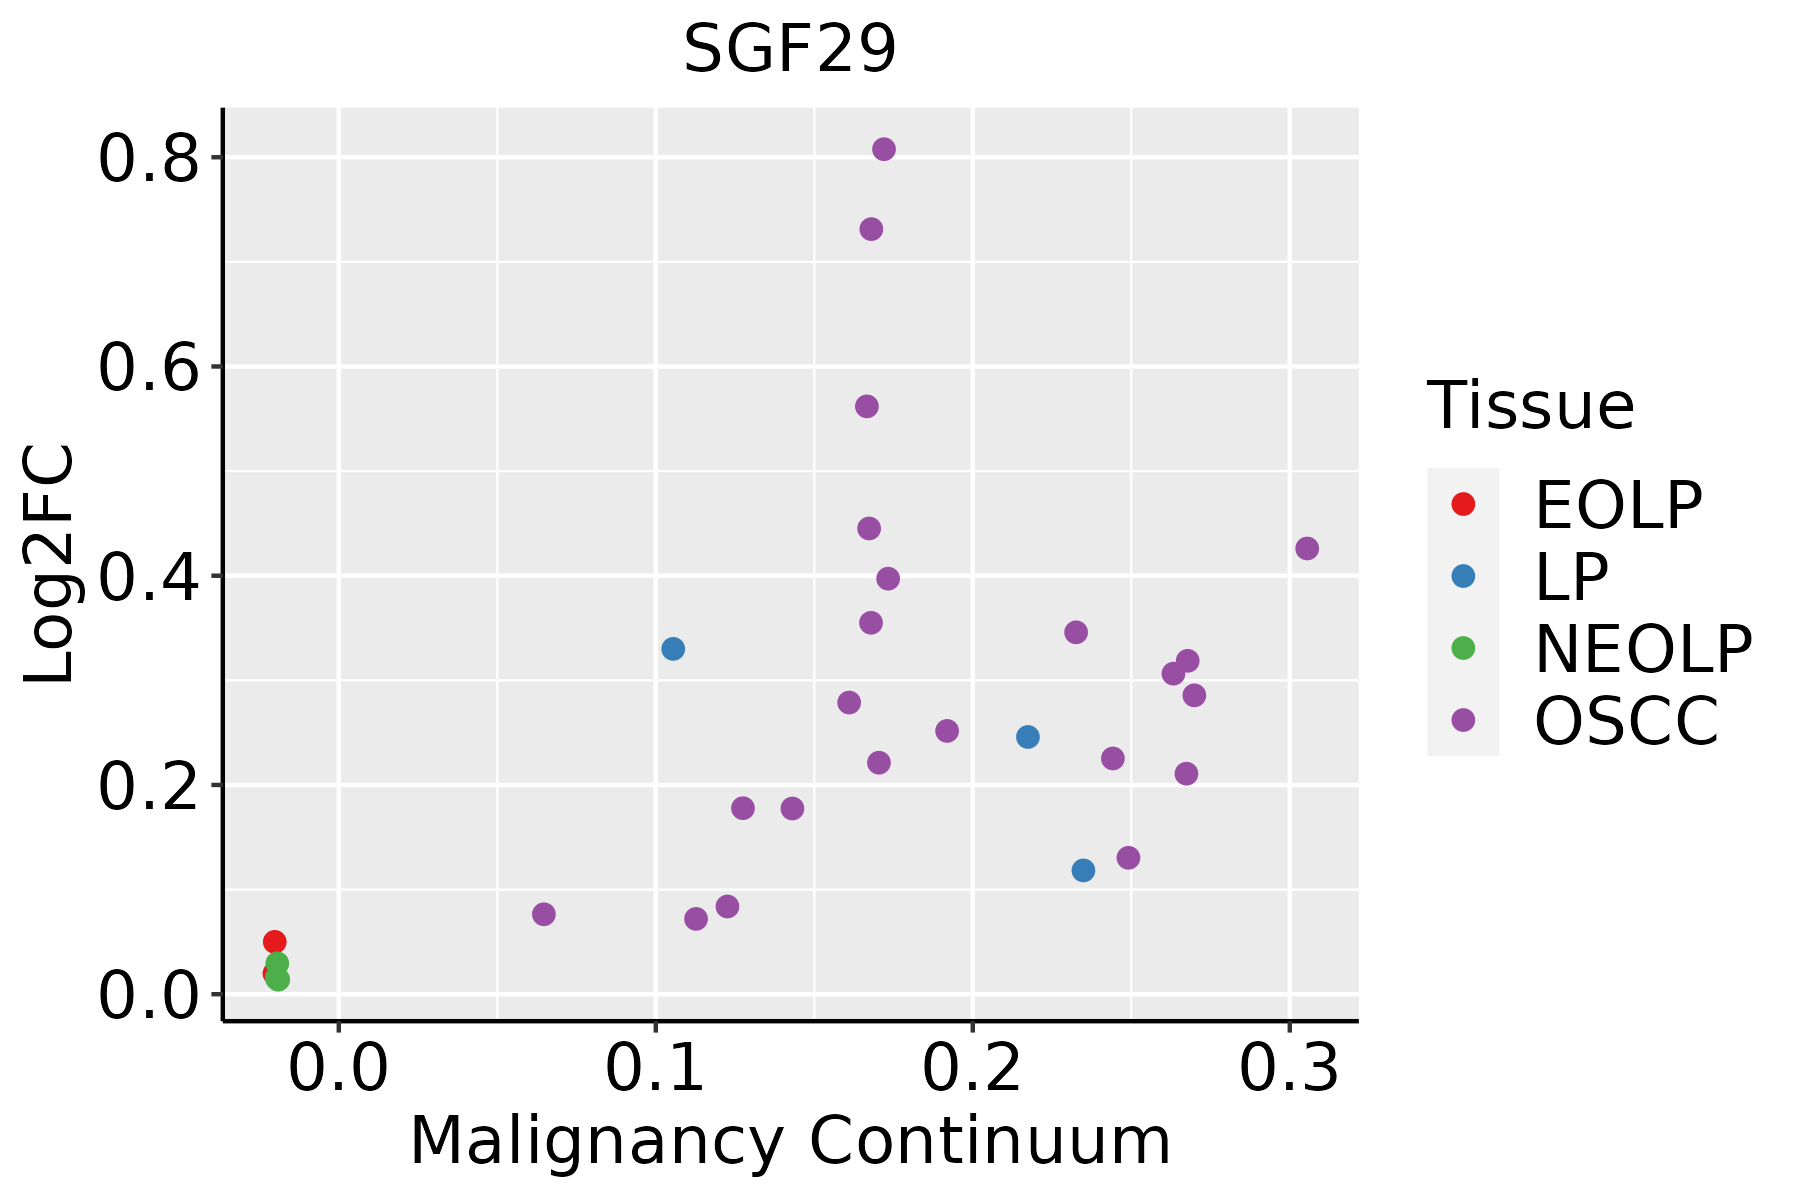 | EOLP: Erosive Oral lichen planus |
| LP: leukoplakia | ||
| NEOLP: Non-erosive oral lichen planus | ||
| OSCC: Oral squamous cell carcinoma |
| ∗log2FC in expression of this searched gene in stem-like cells from each diseased tissue sample relative to stem-like cells in normal samples in each tissue plotted against the malignancy continuum. Samples are colored based on if they are from different disease stage. |
Top |
Malignant transformation related pathway analysis |
| Find out the enriched GO biological processes and KEGG pathways involved in transition from healthy to precancer to cancer |
| Tissue | Disease Stage | Enriched GO biological Processes |
| Colorectum | AD |  |
| Colorectum | SER |  |
| Colorectum | MSS |  |
| Colorectum | MSI-H |  |
| Colorectum | FAP |  |
| ∗Top 15 enriched GO BP terms are showed in the bar plot of each disease state in each tissue. Each row represents a significant GO biological process which is colored according to the -log10(p.adjust). |
| Page: 1 2 3 4 5 6 7 8 9 |
| GO ID | Tissue | Disease Stage | Description | Gene Ratio | Bg Ratio | pvalue | p.adjust | Count |
| GO:007259420 | Esophagus | HGIN | establishment of protein localization to organelle | 120/2587 | 422/18723 | 1.73e-15 | 4.00e-13 | 120 |
| GO:00182057 | Esophagus | HGIN | peptidyl-lysine modification | 88/2587 | 376/18723 | 2.99e-07 | 1.39e-05 | 88 |
| GO:00165708 | Esophagus | HGIN | histone modification | 92/2587 | 463/18723 | 1.70e-04 | 3.30e-03 | 92 |
| GO:00701996 | Esophagus | HGIN | establishment of protein localization to chromosome | 11/2587 | 25/18723 | 2.35e-04 | 4.24e-03 | 11 |
| GO:00064735 | Esophagus | HGIN | protein acetylation | 45/2587 | 201/18723 | 6.17e-04 | 8.58e-03 | 45 |
| GO:00183945 | Esophagus | HGIN | peptidyl-lysine acetylation | 39/2587 | 169/18723 | 7.46e-04 | 9.90e-03 | 39 |
| GO:00345024 | Esophagus | HGIN | protein localization to chromosome | 24/2587 | 92/18723 | 1.29e-03 | 1.54e-02 | 24 |
| GO:00435435 | Esophagus | HGIN | protein acylation | 51/2587 | 243/18723 | 1.33e-03 | 1.57e-02 | 51 |
| GO:00064755 | Esophagus | HGIN | internal protein amino acid acetylation | 36/2587 | 160/18723 | 1.87e-03 | 2.01e-02 | 36 |
| GO:00183935 | Esophagus | HGIN | internal peptidyl-lysine acetylation | 35/2587 | 158/18723 | 2.82e-03 | 2.75e-02 | 35 |
| GO:0072594110 | Esophagus | ESCC | establishment of protein localization to organelle | 311/8552 | 422/18723 | 3.02e-32 | 2.13e-29 | 311 |
| GO:001657015 | Esophagus | ESCC | histone modification | 323/8552 | 463/18723 | 2.61e-26 | 7.88e-24 | 323 |
| GO:001820514 | Esophagus | ESCC | peptidyl-lysine modification | 259/8552 | 376/18723 | 3.90e-20 | 5.26e-18 | 259 |
| GO:001839413 | Esophagus | ESCC | peptidyl-lysine acetylation | 123/8552 | 169/18723 | 6.58e-13 | 2.94e-11 | 123 |
| GO:004354313 | Esophagus | ESCC | protein acylation | 165/8552 | 243/18723 | 1.69e-12 | 7.14e-11 | 165 |
| GO:000647313 | Esophagus | ESCC | protein acetylation | 140/8552 | 201/18723 | 4.37e-12 | 1.69e-10 | 140 |
| GO:001839313 | Esophagus | ESCC | internal peptidyl-lysine acetylation | 114/8552 | 158/18723 | 1.16e-11 | 4.24e-10 | 114 |
| GO:000647513 | Esophagus | ESCC | internal protein amino acid acetylation | 115/8552 | 160/18723 | 1.43e-11 | 5.08e-10 | 115 |
| GO:00165735 | Esophagus | ESCC | histone acetylation | 110/8552 | 152/18723 | 1.95e-11 | 6.81e-10 | 110 |
| GO:003450211 | Esophagus | ESCC | protein localization to chromosome | 70/8552 | 92/18723 | 2.54e-09 | 5.64e-08 | 70 |
| Page: 1 2 |
| Pathway ID | Tissue | Disease Stage | Description | Gene Ratio | Bg Ratio | pvalue | p.adjust | qvalue | Count |
| Page: 1 |
Top |
Cell-cell communication analysis |
| Identification of potential cell-cell interactions between two cell types and their ligand-receptor pairs for different disease states |
| Ligand | Receptor | LRpair | Pathway | Tissue | Disease Stage |
| Page: 1 |
Top |
Single-cell gene regulatory network inference analysis |
| Find out the significant the regulons (TFs) and the target genes of each regulon across cell types for different disease states |
| TF | Cell Type | Tissue | Disease Stage | Target Gene | RSS | Regulon Activity |
| ∗The dot plots of a searched regulon are shown for all cell subpopulations in each disease state of each tissue based on the regulon specific score inferred using pySCENIC and by calculating the average expression. |
| Page: 1 |
Top |
Somatic mutation of malignant transformation related genes |
| Annotation of somatic variants for genes involved in malignant transformation |
| Hugo Symbol | Variant Class | Variant Classification | dbSNP RS | HGVSc | HGVSp | HGVSp Short | SWISSPROT | BIOTYPE | SIFT | PolyPhen | Tumor Sample Barcode | Tissue | Histology | Sex | Age | Stage | Therapy Types | Drugs | Outcome |
| SGF29 | SNV | Missense_Mutation | novel | c.537N>T | p.Glu179Asp | p.E179D | Q96ES7 | protein_coding | deleterious(0.03) | benign(0.103) | TCGA-A7-A6VY-01 | Breast | breast invasive carcinoma | Female | <65 | I/II | Chemotherapy | cyclophosphamide | CR |
| SGF29 | SNV | Missense_Mutation | c.592N>C | p.Glu198Gln | p.E198Q | Q96ES7 | protein_coding | deleterious(0.01) | benign(0.379) | TCGA-AC-A3W6-01 | Breast | breast invasive carcinoma | Female | >=65 | III/IV | Unknown | Unknown | SD | |
| SGF29 | SNV | Missense_Mutation | c.803N>T | p.Ser268Phe | p.S268F | Q96ES7 | protein_coding | deleterious(0.04) | benign(0.105) | TCGA-BH-A18P-01 | Breast | breast invasive carcinoma | Female | <65 | I/II | Unknown | Unknown | PD | |
| SGF29 | SNV | Missense_Mutation | c.217N>A | p.Glu73Lys | p.E73K | Q96ES7 | protein_coding | deleterious(0.01) | benign(0.054) | TCGA-LP-A4AV-01 | Cervix | cervical & endocervical cancer | Female | <65 | I/II | Unknown | Unknown | SD | |
| SGF29 | SNV | Missense_Mutation | rs71391315 | c.211N>A | p.Glu71Lys | p.E71K | Q96ES7 | protein_coding | tolerated(0.34) | benign(0.411) | TCGA-ZX-AA5X-01 | Cervix | cervical & endocervical cancer | Female | <65 | III/IV | Unknown | Unknown | SD |
| SGF29 | SNV | Missense_Mutation | novel | c.773N>G | p.Asp258Gly | p.D258G | Q96ES7 | protein_coding | deleterious(0.01) | possibly_damaging(0.563) | TCGA-AA-A00N-01 | Colorectum | colon adenocarcinoma | Male | >=65 | I/II | Unknown | Unknown | PD |
| SGF29 | SNV | Missense_Mutation | novel | c.182N>C | p.Gly61Ala | p.G61A | Q96ES7 | protein_coding | tolerated(0.16) | benign(0.283) | TCGA-AA-A01K-01 | Colorectum | colon adenocarcinoma | Female | >=65 | III/IV | Chemotherapy | folinic | CR |
| SGF29 | SNV | Missense_Mutation | c.553C>A | p.His185Asn | p.H185N | Q96ES7 | protein_coding | tolerated(0.52) | benign(0.078) | TCGA-AZ-6601-01 | Colorectum | colon adenocarcinoma | Male | >=65 | I/II | Unknown | Unknown | PD | |
| SGF29 | SNV | Missense_Mutation | novel | c.307N>T | p.Leu103Phe | p.L103F | Q96ES7 | protein_coding | tolerated(0.7) | benign(0.01) | TCGA-A5-A0G1-01 | Endometrium | uterine corpus endometrioid carcinoma | Female | >=65 | I/II | Unknown | Unknown | SD |
| SGF29 | SNV | Missense_Mutation | novel | c.386N>T | p.Thr129Ile | p.T129I | Q96ES7 | protein_coding | deleterious(0.02) | possibly_damaging(0.713) | TCGA-A5-A0G2-01 | Endometrium | uterine corpus endometrioid carcinoma | Female | <65 | III/IV | Unknown | Unknown | SD |
| Page: 1 2 3 4 |
Top |
Related drugs of malignant transformation related genes |
| Identification of chemicals and drugs interact with genes involved in malignant transfromation |
| (DGIdb 4.0) |
| Entrez ID | Symbol | Category | Interaction Types | Drug Claim Name | Drug Name | PMIDs |
| Page: 1 |

Copyright 2023-Present -The University of Texas Health Science Center at Houston |