
|
|||||
|
 | |
| |
| |
| |
| |
| |
|
Gene: SGCZ |
Gene summary for SGCZ |
| Gene information | Species | Human | Gene symbol | SGCZ | Gene ID | 137868 |
| Gene name | sarcoglycan zeta | |
| Gene Alias | ZSG1 | |
| Cytomap | 8p22 | |
| Gene Type | protein-coding | GO ID | GO:0003008 | UniProtAcc | Q08AT0 |
Top |
Malignant transformation analysis |
| Identification of the aberrant gene expression in precancerous and cancerous lesions by comparing the gene expression of stem-like cells in diseased tissues with normal stem cells |
| Entrez ID | Symbol | Replicates | Species | Organ | Tissue | Adj P-value | Log2FC | Malignancy |
| 137868 | SGCZ | HTA11_2487_2000001011 | Human | Colorectum | SER | 1.04e-03 | 1.95e-01 | -0.1808 |
| 137868 | SGCZ | HTA11_1938_2000001011 | Human | Colorectum | AD | 1.54e-08 | 3.20e-01 | -0.0811 |
| 137868 | SGCZ | HTA11_78_2000001011 | Human | Colorectum | AD | 3.91e-03 | 1.92e-01 | -0.1088 |
| 137868 | SGCZ | HTA11_347_2000001011 | Human | Colorectum | AD | 4.92e-10 | 2.45e-01 | -0.1954 |
| 137868 | SGCZ | HTA11_411_2000001011 | Human | Colorectum | SER | 1.11e-03 | 4.18e-01 | -0.2602 |
| 137868 | SGCZ | HTA11_2112_2000001011 | Human | Colorectum | SER | 7.27e-03 | 3.46e-01 | -0.2196 |
| 137868 | SGCZ | HTA11_3361_2000001011 | Human | Colorectum | AD | 3.22e-08 | 3.19e-01 | -0.1207 |
| 137868 | SGCZ | HTA11_696_2000001011 | Human | Colorectum | AD | 1.36e-08 | 2.67e-01 | -0.1464 |
| 137868 | SGCZ | HTA11_866_2000001011 | Human | Colorectum | AD | 2.42e-02 | 1.40e-01 | -0.1001 |
| 137868 | SGCZ | HTA11_1391_2000001011 | Human | Colorectum | AD | 5.53e-10 | 3.06e-01 | -0.059 |
| 137868 | SGCZ | HTA11_2992_2000001011 | Human | Colorectum | SER | 4.41e-07 | 3.80e-01 | -0.1706 |
| 137868 | SGCZ | HTA11_5216_2000001011 | Human | Colorectum | SER | 1.69e-02 | 3.42e-01 | -0.1462 |
| 137868 | SGCZ | HTA11_546_2000001011 | Human | Colorectum | AD | 8.50e-03 | 2.25e-01 | -0.0842 |
| 137868 | SGCZ | HTA11_6818_2000001011 | Human | Colorectum | AD | 3.08e-02 | 2.17e-01 | 0.0112 |
| 137868 | SGCZ | HTA11_6818_2000001021 | Human | Colorectum | AD | 5.25e-04 | 2.33e-01 | 0.0588 |
| 137868 | SGCZ | HTA11_99999965062_69753 | Human | Colorectum | MSI-H | 1.31e-05 | 5.64e-01 | 0.3487 |
| 137868 | SGCZ | HTA11_99999965104_69814 | Human | Colorectum | MSS | 1.92e-02 | 1.59e-01 | 0.281 |
| 137868 | SGCZ | HTA11_99999974143_84620 | Human | Colorectum | MSS | 6.41e-05 | 1.81e-01 | 0.3005 |
| Page: 1 |
| Tissue | Expression Dynamics | Abbreviation |
| Colorectum (GSE201348) | 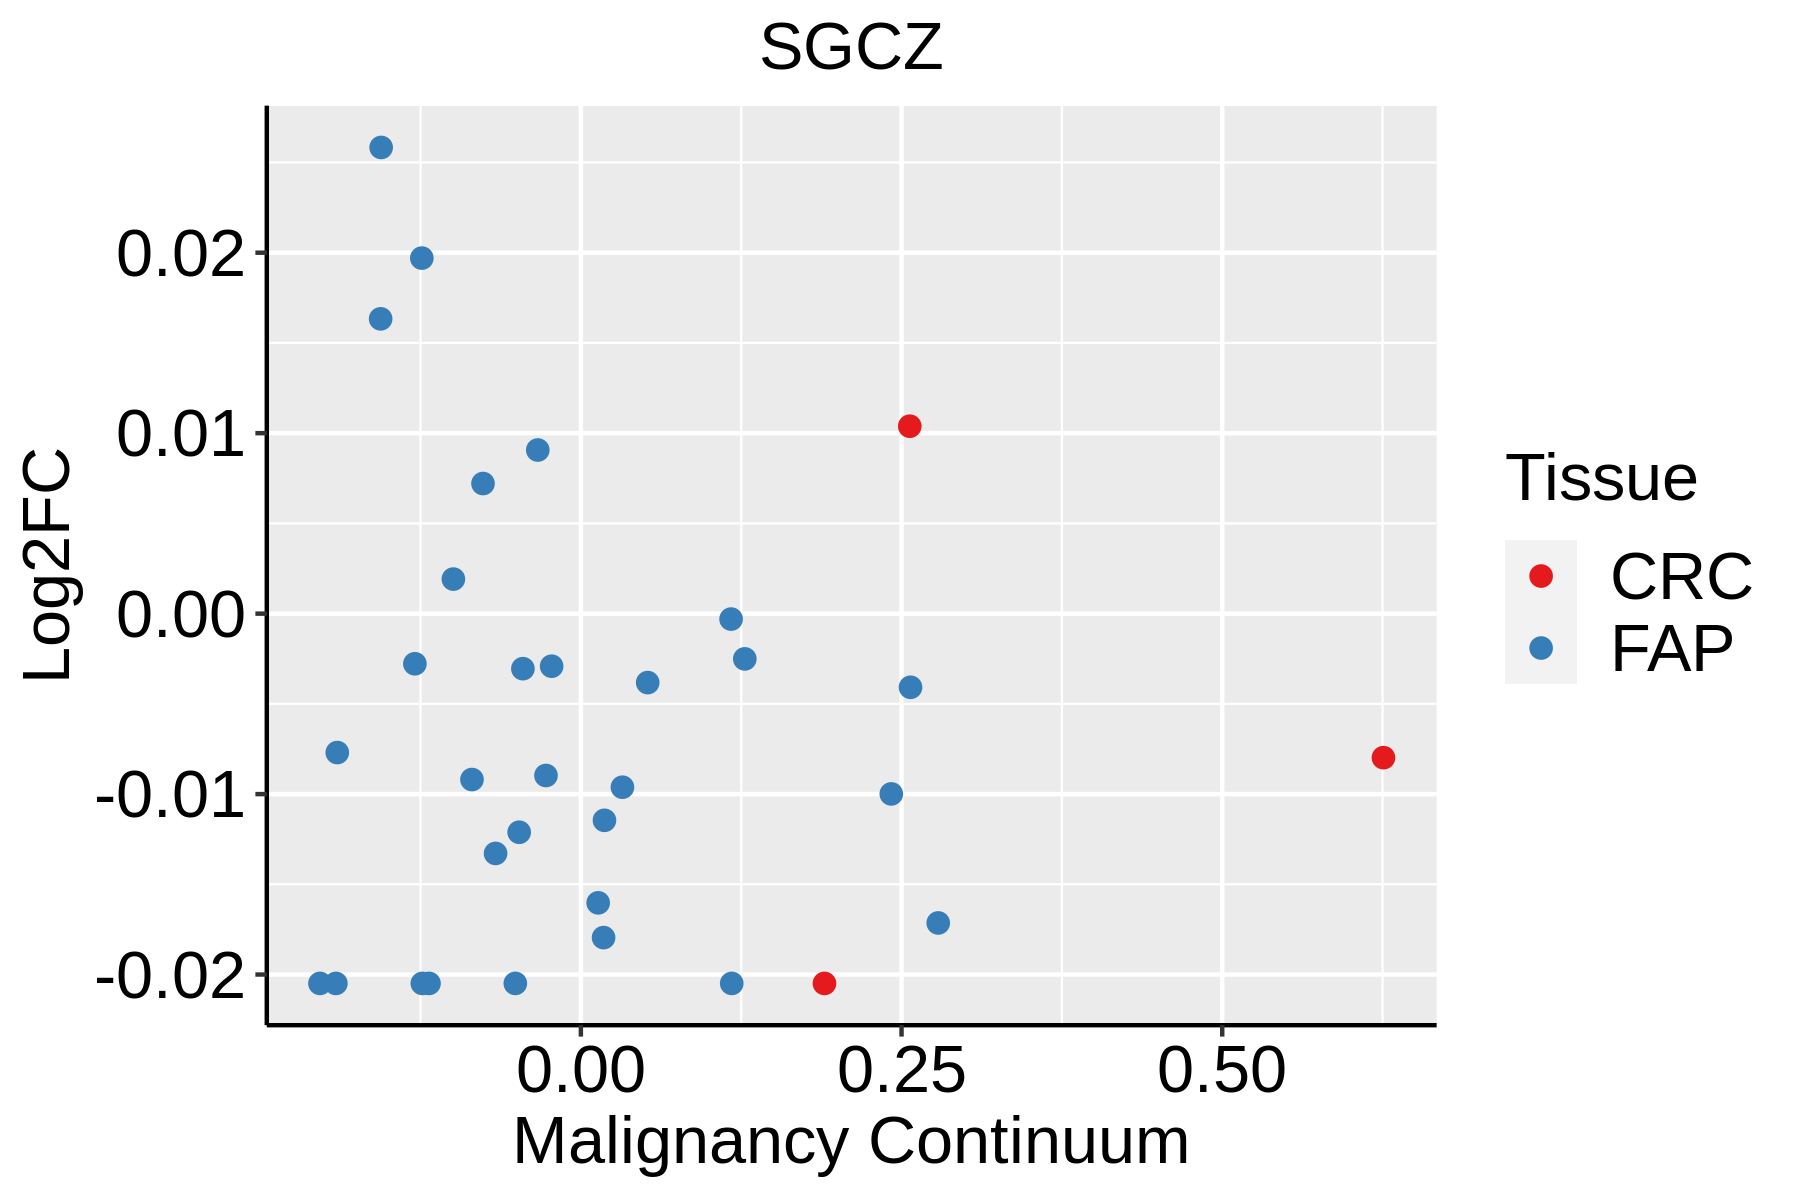 | FAP: Familial adenomatous polyposis |
| CRC: Colorectal cancer | ||
| Colorectum (HTA11) |  | AD: Adenomas |
| SER: Sessile serrated lesions | ||
| MSI-H: Microsatellite-high colorectal cancer | ||
| MSS: Microsatellite stable colorectal cancer |
| ∗log2FC in expression of this searched gene in stem-like cells from each diseased tissue sample relative to stem-like cells in normal samples in each tissue plotted against the malignancy continuum. Samples are colored based on if they are from different disease stage. |
Top |
Malignant transformation related pathway analysis |
| Find out the enriched GO biological processes and KEGG pathways involved in transition from healthy to precancer to cancer |
| Tissue | Disease Stage | Enriched GO biological Processes |
| Colorectum | AD |  |
| Colorectum | SER |  |
| Colorectum | MSS |  |
| Colorectum | MSI-H |  |
| Colorectum | FAP |  |
| ∗Top 15 enriched GO BP terms are showed in the bar plot of each disease state in each tissue. Each row represents a significant GO biological process which is colored according to the -log10(p.adjust). |
| Page: 1 2 3 4 5 6 7 8 9 |
| GO ID | Tissue | Disease Stage | Description | Gene Ratio | Bg Ratio | pvalue | p.adjust | Count |
| GO:0060249 | Colorectum | AD | anatomical structure homeostasis | 94/3918 | 314/18723 | 9.37e-05 | 1.42e-03 | 94 |
| GO:00602491 | Colorectum | SER | anatomical structure homeostasis | 74/2897 | 314/18723 | 1.01e-04 | 2.13e-03 | 74 |
| GO:00602492 | Colorectum | MSS | anatomical structure homeostasis | 84/3467 | 314/18723 | 1.87e-04 | 2.64e-03 | 84 |
| GO:0046716 | Colorectum | MSS | muscle cell cellular homeostasis | 9/3467 | 19/18723 | 3.88e-03 | 2.83e-02 | 9 |
| GO:00602493 | Colorectum | MSI-H | anatomical structure homeostasis | 38/1319 | 314/18723 | 7.73e-04 | 1.44e-02 | 38 |
| Page: 1 |
| Pathway ID | Tissue | Disease Stage | Description | Gene Ratio | Bg Ratio | pvalue | p.adjust | qvalue | Count |
| Page: 1 |
Top |
Cell-cell communication analysis |
| Identification of potential cell-cell interactions between two cell types and their ligand-receptor pairs for different disease states |
| Ligand | Receptor | LRpair | Pathway | Tissue | Disease Stage |
| Page: 1 |
Top |
Single-cell gene regulatory network inference analysis |
| Find out the significant the regulons (TFs) and the target genes of each regulon across cell types for different disease states |
| TF | Cell Type | Tissue | Disease Stage | Target Gene | RSS | Regulon Activity |
| ∗The dot plots of a searched regulon are shown for all cell subpopulations in each disease state of each tissue based on the regulon specific score inferred using pySCENIC and by calculating the average expression. |
| Page: 1 |
Top |
Somatic mutation of malignant transformation related genes |
| Annotation of somatic variants for genes involved in malignant transformation |
| Hugo Symbol | Variant Class | Variant Classification | dbSNP RS | HGVSc | HGVSp | HGVSp Short | SWISSPROT | BIOTYPE | SIFT | PolyPhen | Tumor Sample Barcode | Tissue | Histology | Sex | Age | Stage | Therapy Types | Drugs | Outcome |
| SGCZ | insertion | Nonsense_Mutation | novel | c.762_763insTAAATC | p.Glu254_Thr255insTer | p.E254_T255ins* | Q96LD1 | protein_coding | TCGA-A7-A26I-01 | Breast | breast invasive carcinoma | Female | >=65 | I/II | Chemotherapy | cytoxan | SD | ||
| SGCZ | deletion | Frame_Shift_Del | novel | c.399delN | p.Gln134SerfsTer2 | p.Q134Sfs*2 | Q96LD1 | protein_coding | TCGA-D8-A27V-01 | Breast | breast invasive carcinoma | Female | <65 | I/II | Hormone Therapy | tamoxiphen | SD | ||
| SGCZ | SNV | Missense_Mutation | rs751791396 | c.562N>A | p.Val188Ile | p.V188I | Q96LD1 | protein_coding | tolerated(0.27) | benign(0.02) | TCGA-2W-A8YY-01 | Cervix | cervical & endocervical cancer | Female | <65 | I/II | Chemotherapy | cisplatin | CR |
| SGCZ | SNV | Missense_Mutation | rs528398080 | c.344N>T | p.Pro115Leu | p.P115L | Q96LD1 | protein_coding | tolerated(0.21) | benign(0.017) | TCGA-2W-A8YY-01 | Cervix | cervical & endocervical cancer | Female | <65 | I/II | Chemotherapy | cisplatin | CR |
| SGCZ | SNV | Missense_Mutation | c.14N>T | p.Thr5Met | p.T5M | Q96LD1 | protein_coding | tolerated(0.06) | benign(0.042) | TCGA-FU-A3HZ-01 | Cervix | cervical & endocervical cancer | Female | <65 | I/II | Chemotherapy | cisplatin | CR | |
| SGCZ | SNV | Missense_Mutation | c.497C>T | p.Ser166Phe | p.S166F | Q96LD1 | protein_coding | deleterious(0.04) | benign(0.222) | TCGA-A6-6141-01 | Colorectum | colon adenocarcinoma | Male | <65 | I/II | Chemotherapy | 5-fu | SD | |
| SGCZ | SNV | Missense_Mutation | rs139184216 | c.853N>A | p.Val285Ile | p.V285I | Q96LD1 | protein_coding | tolerated(0.17) | benign(0.003) | TCGA-AA-3972-01 | Colorectum | colon adenocarcinoma | Male | >=65 | III/IV | Chemotherapy | capecitabine | PD |
| SGCZ | SNV | Missense_Mutation | rs138916610 | c.332N>A | p.Arg111Gln | p.R111Q | Q96LD1 | protein_coding | deleterious(0) | possibly_damaging(0.49) | TCGA-AA-3977-01 | Colorectum | colon adenocarcinoma | Male | >=65 | I/II | Unknown | Unknown | SD |
| SGCZ | SNV | Missense_Mutation | c.123N>G | p.Ile41Met | p.I41M | Q96LD1 | protein_coding | deleterious(0) | benign(0.41) | TCGA-AA-3977-01 | Colorectum | colon adenocarcinoma | Male | >=65 | I/II | Unknown | Unknown | SD | |
| SGCZ | SNV | Missense_Mutation | c.386G>T | p.Arg129Ile | p.R129I | Q96LD1 | protein_coding | deleterious(0.02) | benign(0.239) | TCGA-AA-A010-01 | Colorectum | colon adenocarcinoma | Female | <65 | I/II | Chemotherapy | folinic | CR |
| Page: 1 2 3 4 5 6 7 8 9 |
Top |
Related drugs of malignant transformation related genes |
| Identification of chemicals and drugs interact with genes involved in malignant transfromation |
| (DGIdb 4.0) |
| Entrez ID | Symbol | Category | Interaction Types | Drug Claim Name | Drug Name | PMIDs |
| Page: 1 |

Copyright 2023-Present -The University of Texas Health Science Center at Houston |