
|
|||||
|
 | |
| |
| |
| |
| |
| |
|
Gene: SGCE |
Gene summary for SGCE |
| Gene information | Species | Human | Gene symbol | SGCE | Gene ID | 8910 |
| Gene name | sarcoglycan epsilon | |
| Gene Alias | DYT11 | |
| Cytomap | 7q21.3 | |
| Gene Type | protein-coding | GO ID | GO:0007155 | UniProtAcc | O43556 |
Top |
Malignant transformation analysis |
| Identification of the aberrant gene expression in precancerous and cancerous lesions by comparing the gene expression of stem-like cells in diseased tissues with normal stem cells |
| Entrez ID | Symbol | Replicates | Species | Organ | Tissue | Adj P-value | Log2FC | Malignancy |
| 8910 | SGCE | GSM4909282 | Human | Breast | IDC | 6.55e-05 | 2.94e-01 | -0.0288 |
| 8910 | SGCE | GSM4909296 | Human | Breast | IDC | 3.51e-04 | -1.15e-01 | 0.1524 |
| 8910 | SGCE | GSM4909297 | Human | Breast | IDC | 3.99e-02 | -9.29e-02 | 0.1517 |
| 8910 | SGCE | GSM4909298 | Human | Breast | IDC | 1.02e-02 | -1.06e-01 | 0.1551 |
| 8910 | SGCE | GSM4909302 | Human | Breast | IDC | 8.17e-04 | -1.21e-01 | 0.1545 |
| 8910 | SGCE | GSM4909304 | Human | Breast | IDC | 3.73e-02 | -1.15e-01 | 0.1636 |
| 8910 | SGCE | GSM4909306 | Human | Breast | IDC | 1.19e-09 | 3.98e-01 | 0.1564 |
| 8910 | SGCE | GSM4909311 | Human | Breast | IDC | 3.51e-04 | -1.21e-01 | 0.1534 |
| 8910 | SGCE | GSM4909312 | Human | Breast | IDC | 3.51e-04 | -1.21e-01 | 0.1552 |
| 8910 | SGCE | GSM4909315 | Human | Breast | IDC | 1.65e-04 | -1.21e-01 | 0.21 |
| 8910 | SGCE | GSM4909319 | Human | Breast | IDC | 4.60e-03 | -1.08e-01 | 0.1563 |
| 8910 | SGCE | GSM4909321 | Human | Breast | IDC | 5.61e-04 | -1.09e-01 | 0.1559 |
| 8910 | SGCE | NCCBC14 | Human | Breast | DCIS | 2.23e-03 | -6.30e-02 | 0.2021 |
| 8910 | SGCE | NCCBC5 | Human | Breast | DCIS | 2.75e-02 | -1.21e-01 | 0.2046 |
| 8910 | SGCE | P1 | Human | Breast | IDC | 6.62e-03 | -5.17e-02 | 0.1527 |
| 8910 | SGCE | DCIS2 | Human | Breast | DCIS | 5.39e-14 | 3.27e-02 | 0.0085 |
| 8910 | SGCE | LZE7T | Human | Esophagus | ESCC | 7.98e-07 | 2.25e-01 | 0.0667 |
| 8910 | SGCE | P2T-E | Human | Esophagus | ESCC | 5.19e-25 | 5.04e-01 | 0.1177 |
| 8910 | SGCE | P4T-E | Human | Esophagus | ESCC | 1.60e-02 | 5.02e-02 | 0.1323 |
| 8910 | SGCE | P5T-E | Human | Esophagus | ESCC | 1.52e-02 | -2.61e-02 | 0.1327 |
| Page: 1 2 3 4 5 |
| Tissue | Expression Dynamics | Abbreviation |
| Breast | 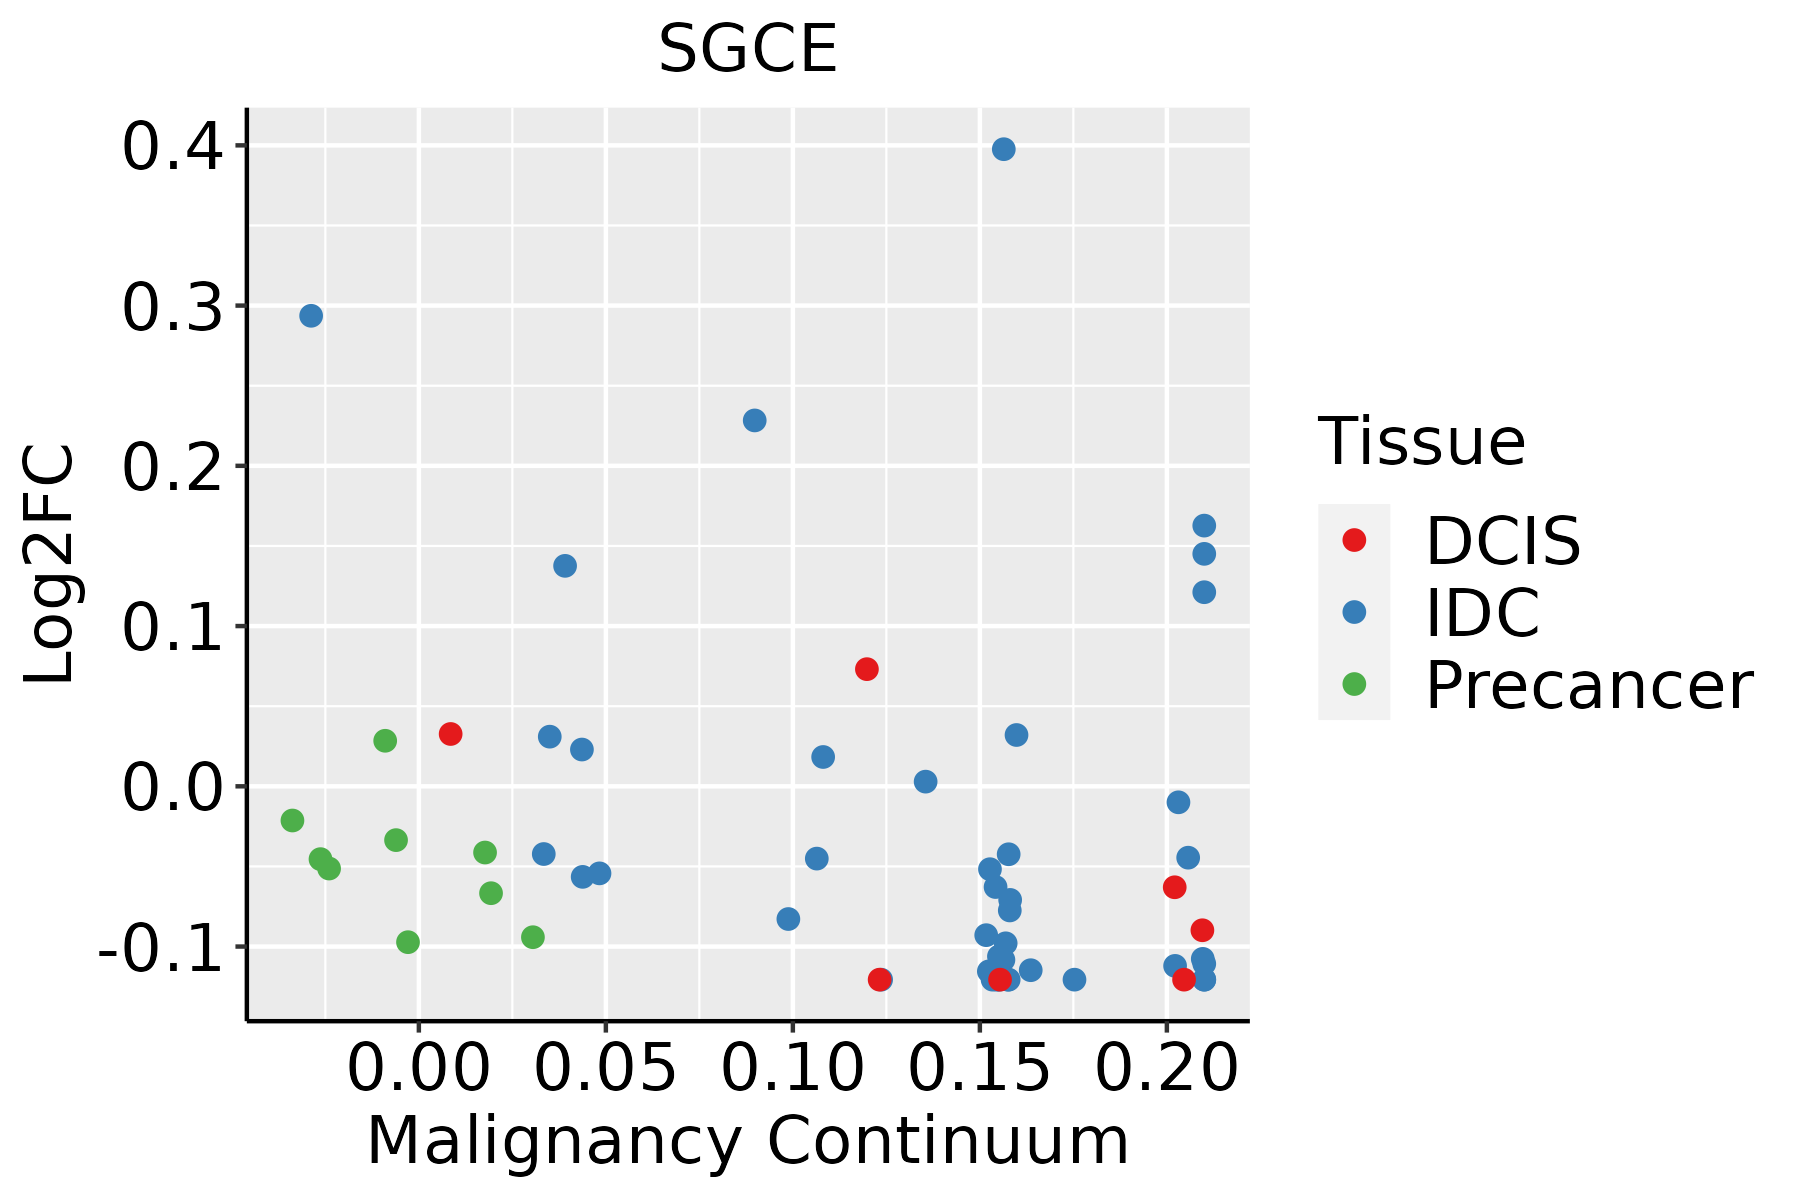 | IDC: Invasive ductal carcinoma |
| DCIS: Ductal carcinoma in situ | ||
| Precancer(BRCA1-mut): Precancerous lesion from BRCA1 mutation carriers | ||
| Esophagus |  | ESCC: Esophageal squamous cell carcinoma |
| HGIN: High-grade intraepithelial neoplasias | ||
| LGIN: Low-grade intraepithelial neoplasias | ||
| Liver | 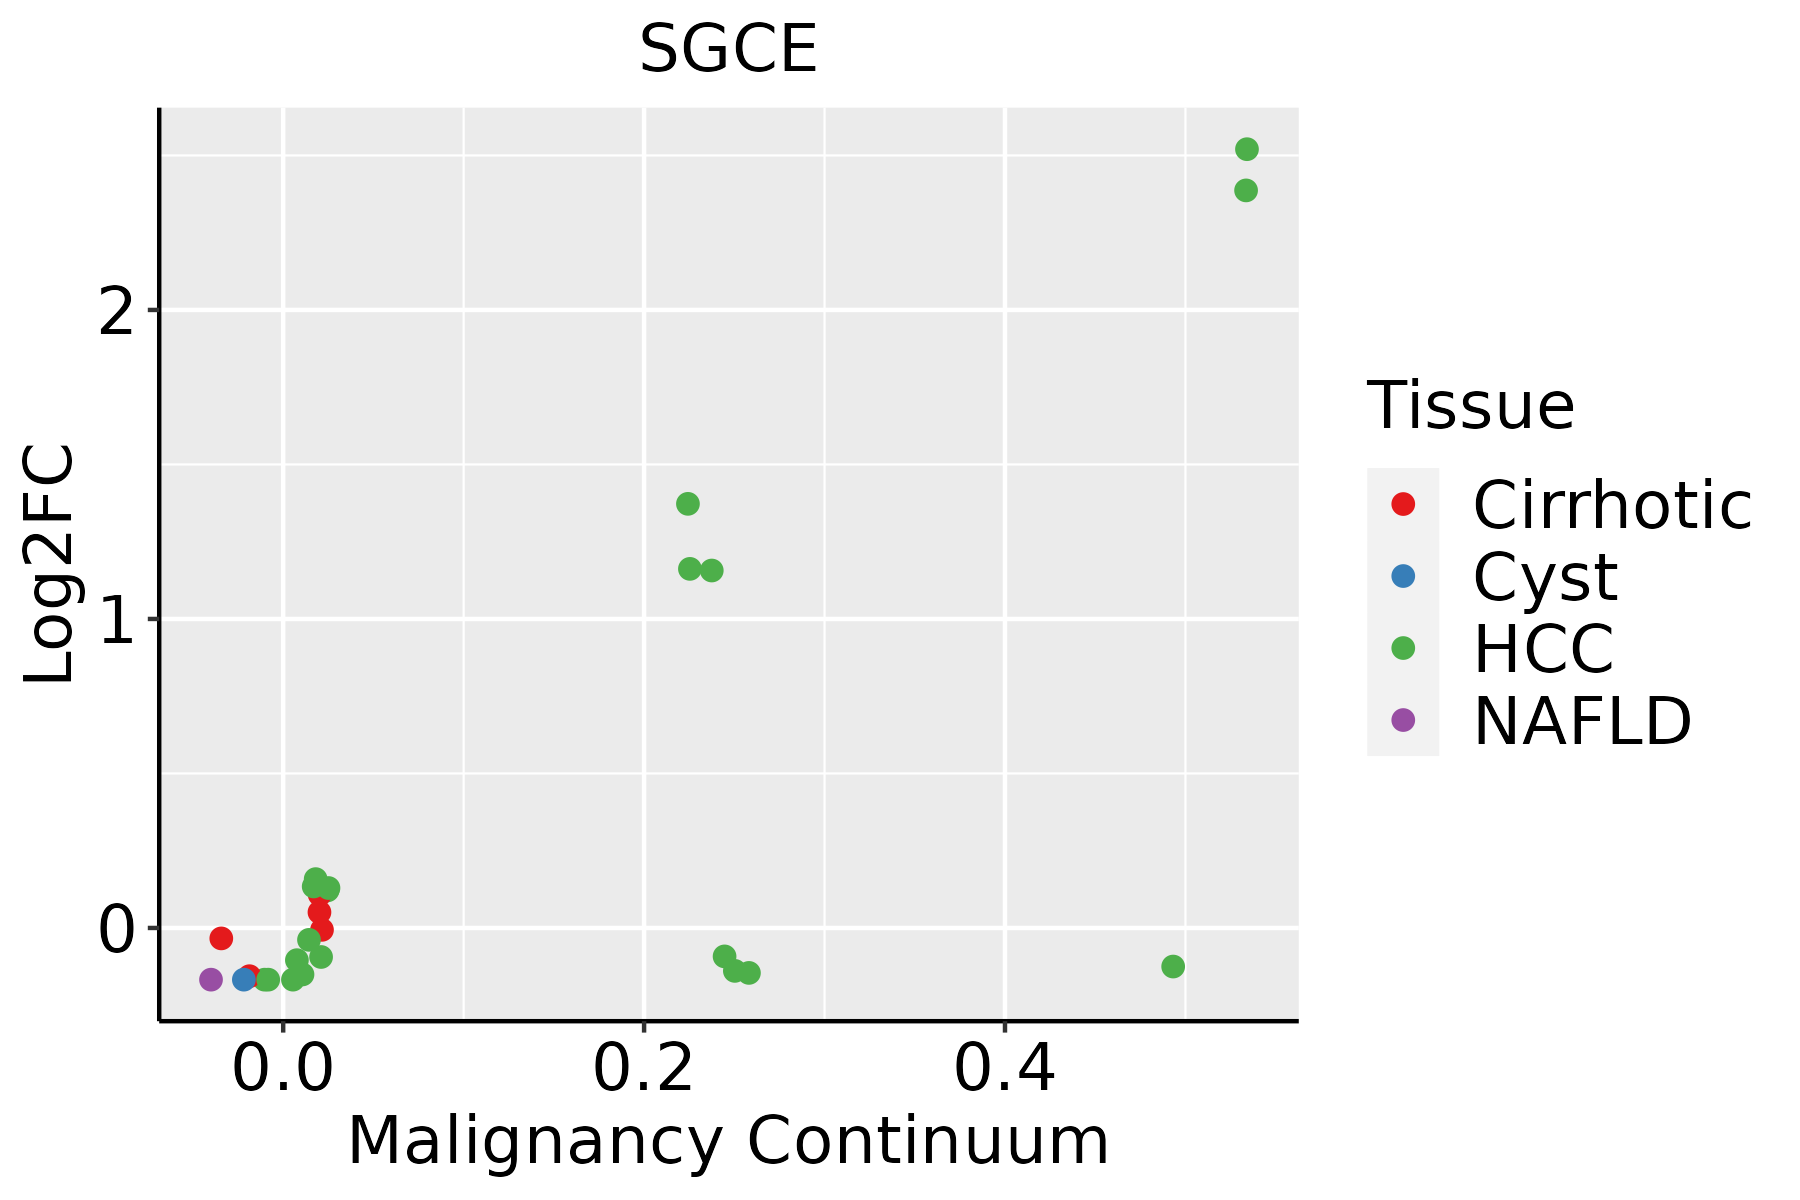 | HCC: Hepatocellular carcinoma |
| NAFLD: Non-alcoholic fatty liver disease | ||
| Oral Cavity | 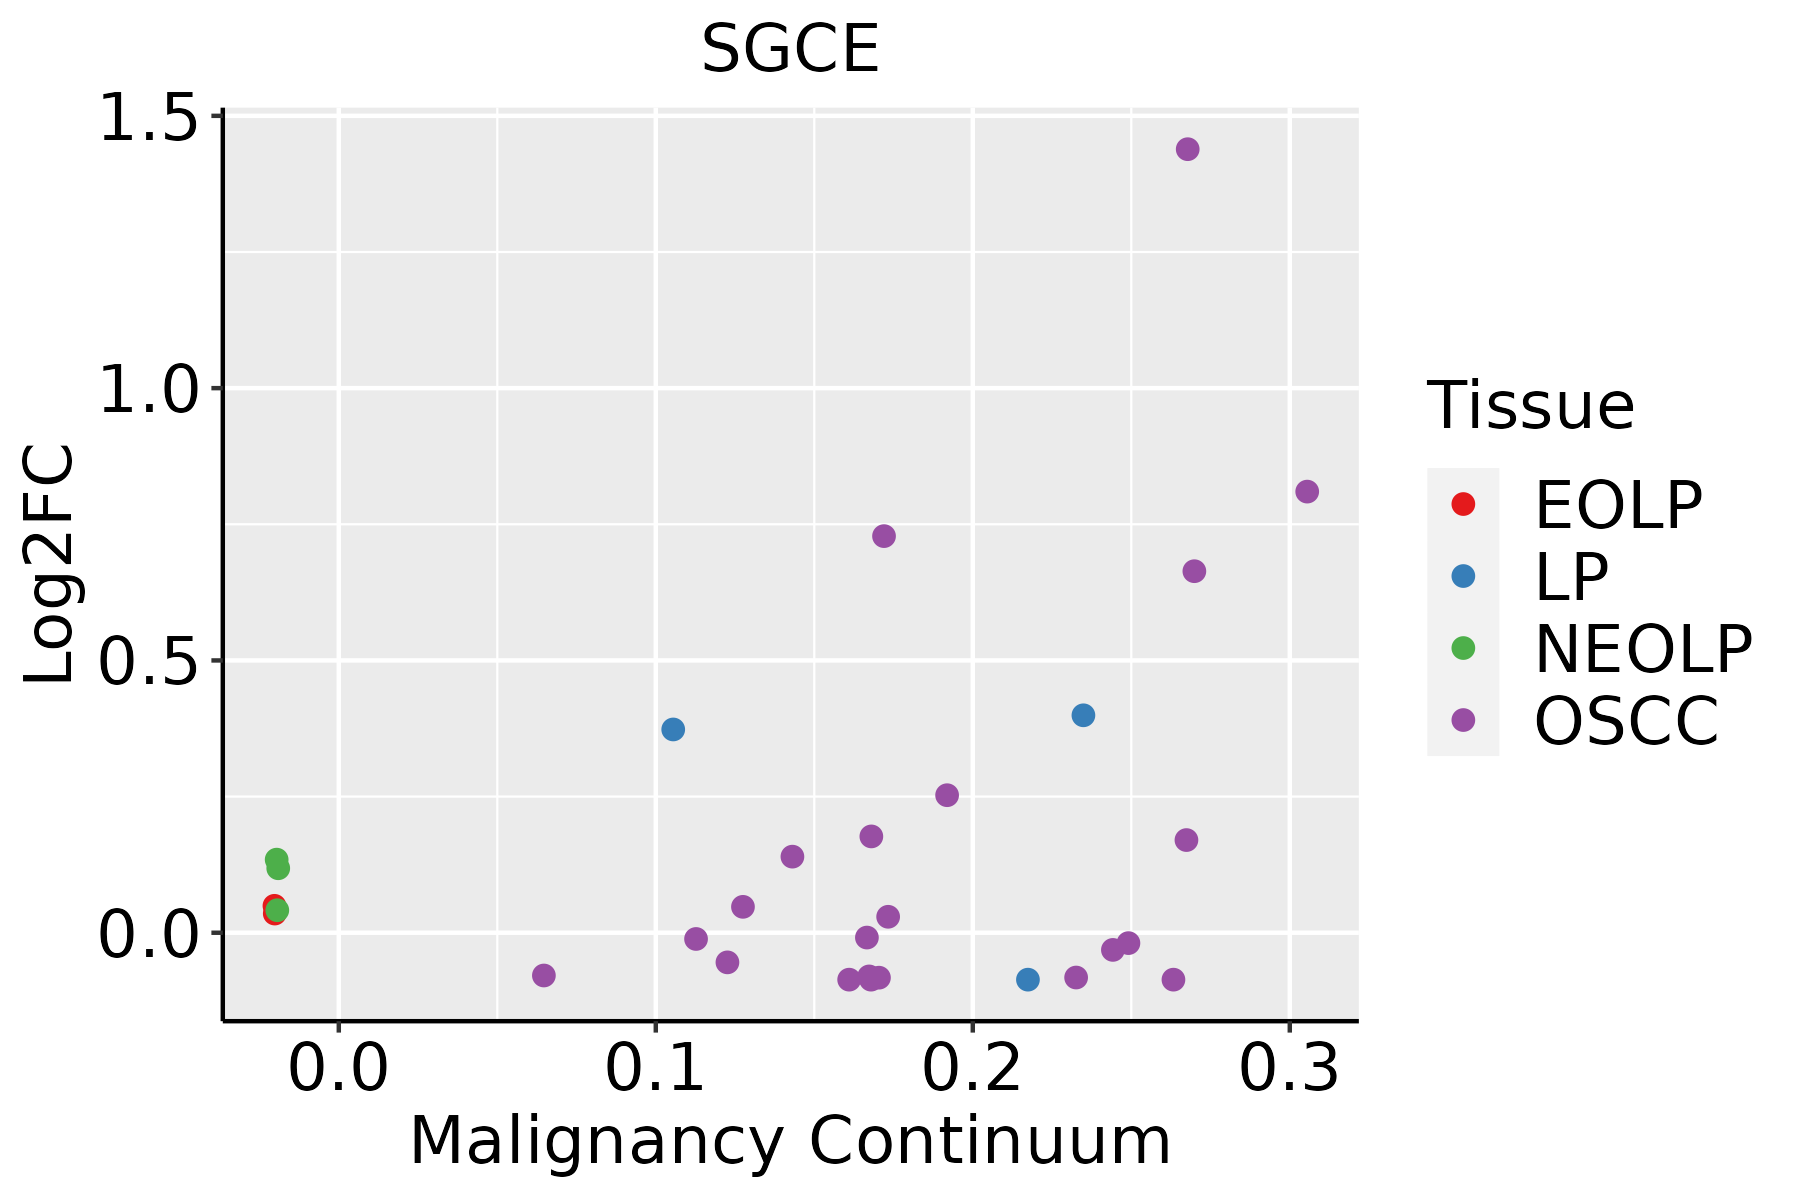 | EOLP: Erosive Oral lichen planus |
| LP: leukoplakia | ||
| NEOLP: Non-erosive oral lichen planus | ||
| OSCC: Oral squamous cell carcinoma | ||
| Thyroid | 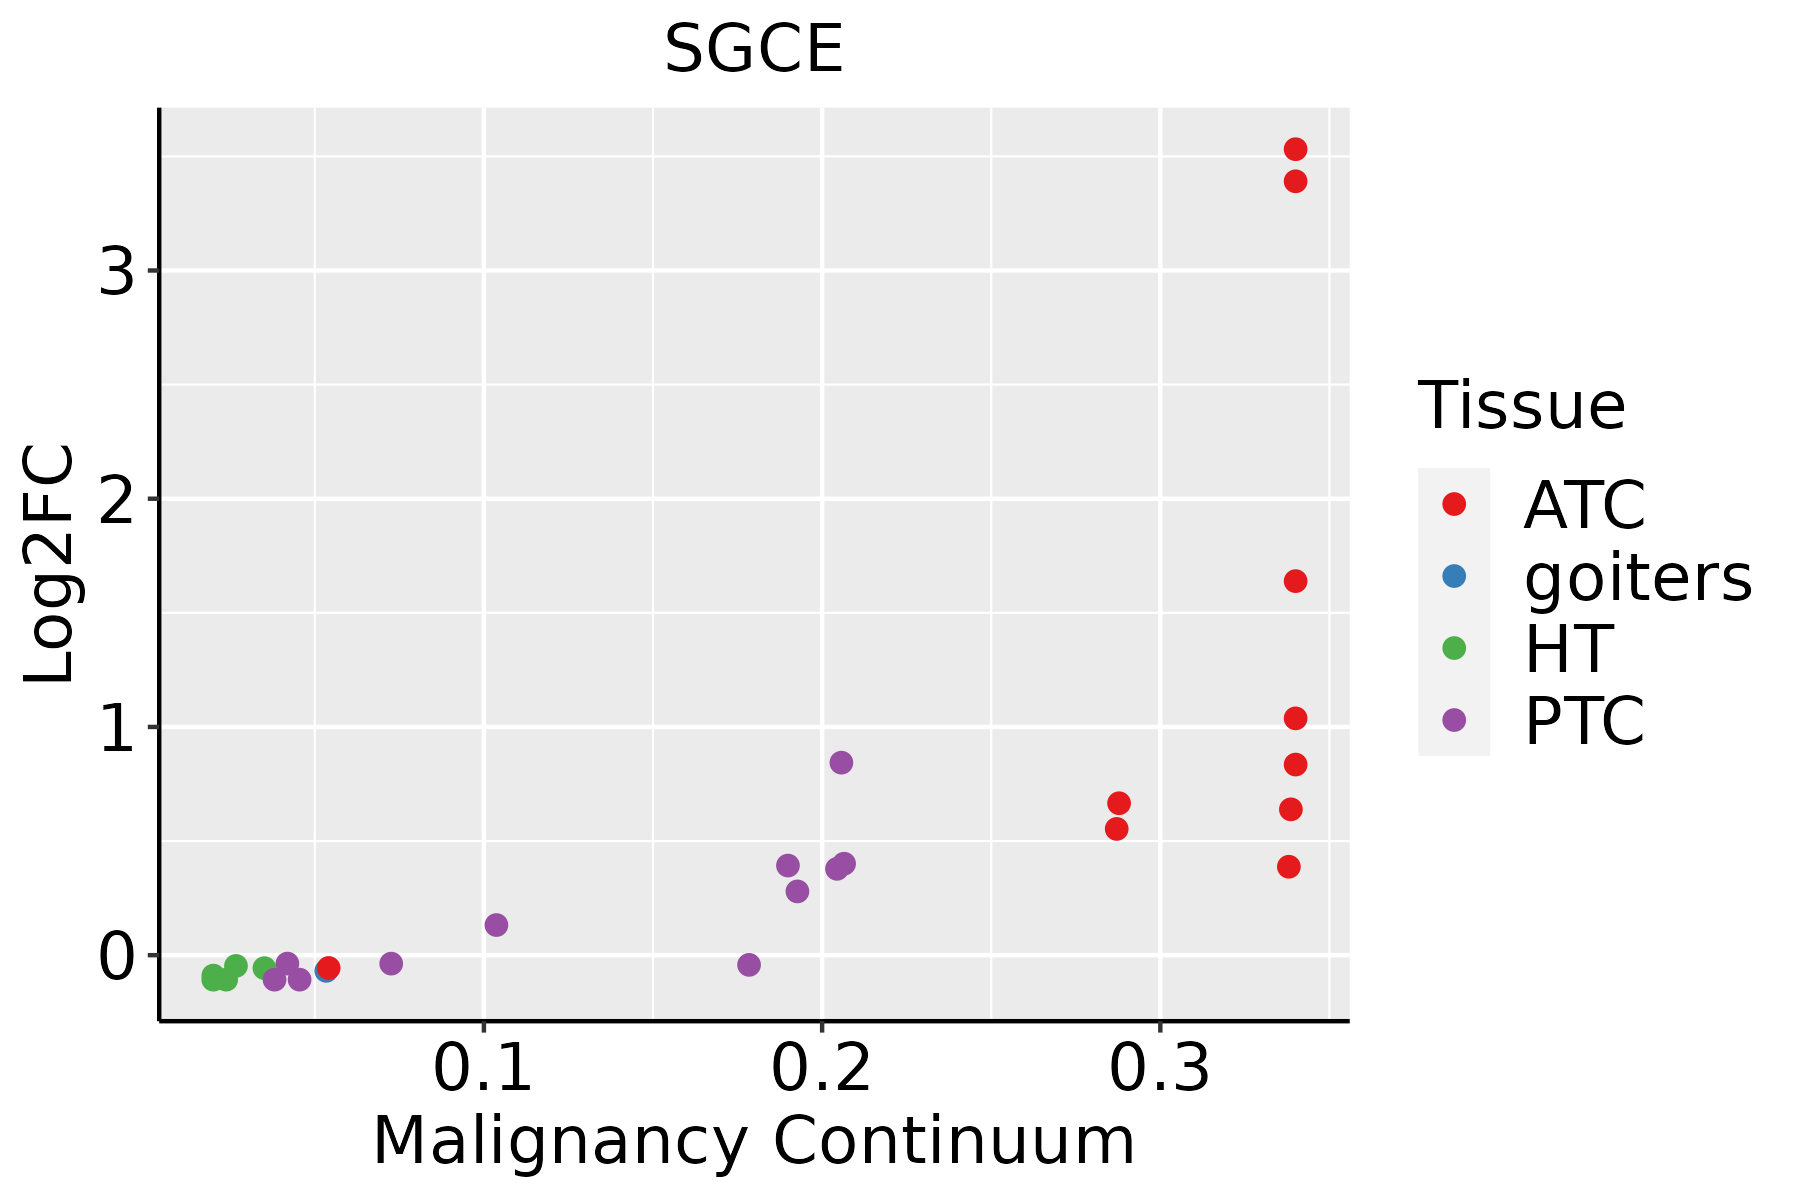 | ATC: Anaplastic thyroid cancer |
| HT: Hashimoto's thyroiditis | ||
| PTC: Papillary thyroid cancer |
| ∗log2FC in expression of this searched gene in stem-like cells from each diseased tissue sample relative to stem-like cells in normal samples in each tissue plotted against the malignancy continuum. Samples are colored based on if they are from different disease stage. |
Top |
Malignant transformation related pathway analysis |
| Find out the enriched GO biological processes and KEGG pathways involved in transition from healthy to precancer to cancer |
| Tissue | Disease Stage | Enriched GO biological Processes |
| Colorectum | AD |  |
| Colorectum | SER |  |
| Colorectum | MSS |  |
| Colorectum | MSI-H |  |
| Colorectum | FAP |  |
| ∗Top 15 enriched GO BP terms are showed in the bar plot of each disease state in each tissue. Each row represents a significant GO biological process which is colored according to the -log10(p.adjust). |
| Page: 1 2 3 4 5 6 7 8 9 |
| GO ID | Tissue | Disease Stage | Description | Gene Ratio | Bg Ratio | pvalue | p.adjust | Count |
| GO:00075172 | Breast | IDC | muscle organ development | 38/1434 | 327/18723 | 6.63e-03 | 4.62e-02 | 38 |
| GO:00075171 | Breast | DCIS | muscle organ development | 37/1390 | 327/18723 | 6.86e-03 | 4.75e-02 | 37 |
| GO:003158919 | Esophagus | ESCC | cell-substrate adhesion | 221/8552 | 363/18723 | 3.06e-09 | 6.62e-08 | 221 |
| GO:000716018 | Esophagus | ESCC | cell-matrix adhesion | 141/8552 | 233/18723 | 3.33e-06 | 3.71e-05 | 141 |
| GO:003158912 | Liver | Cirrhotic | cell-substrate adhesion | 128/4634 | 363/18723 | 4.10e-06 | 6.90e-05 | 128 |
| GO:000716011 | Liver | Cirrhotic | cell-matrix adhesion | 85/4634 | 233/18723 | 4.06e-05 | 4.83e-04 | 85 |
| GO:003158922 | Liver | HCC | cell-substrate adhesion | 188/7958 | 363/18723 | 2.00e-04 | 1.55e-03 | 188 |
| GO:000716021 | Liver | HCC | cell-matrix adhesion | 123/7958 | 233/18723 | 9.34e-04 | 5.47e-03 | 123 |
| GO:003158917 | Oral cavity | OSCC | cell-substrate adhesion | 193/7305 | 363/18723 | 2.48e-08 | 4.82e-07 | 193 |
| GO:000716016 | Oral cavity | OSCC | cell-matrix adhesion | 125/7305 | 233/18723 | 3.76e-06 | 4.45e-05 | 125 |
| GO:003158932 | Oral cavity | NEOLP | cell-substrate adhesion | 93/2005 | 363/18723 | 4.93e-16 | 2.93e-13 | 93 |
| GO:000716023 | Oral cavity | NEOLP | cell-matrix adhesion | 62/2005 | 233/18723 | 6.73e-12 | 1.14e-09 | 62 |
| GO:000751714 | Oral cavity | NEOLP | muscle organ development | 56/2005 | 327/18723 | 2.65e-04 | 2.70e-03 | 56 |
| GO:0031589111 | Thyroid | PTC | cell-substrate adhesion | 169/5968 | 363/18723 | 2.73e-09 | 7.57e-08 | 169 |
| GO:000716020 | Thyroid | PTC | cell-matrix adhesion | 109/5968 | 233/18723 | 1.28e-06 | 1.84e-05 | 109 |
| GO:003158928 | Thyroid | ATC | cell-substrate adhesion | 195/6293 | 363/18723 | 1.58e-15 | 1.17e-13 | 195 |
| GO:0007160111 | Thyroid | ATC | cell-matrix adhesion | 128/6293 | 233/18723 | 1.49e-11 | 5.41e-10 | 128 |
| GO:000751716 | Thyroid | ATC | muscle organ development | 139/6293 | 327/18723 | 4.45e-04 | 2.64e-03 | 139 |
| Page: 1 |
| Pathway ID | Tissue | Disease Stage | Description | Gene Ratio | Bg Ratio | pvalue | p.adjust | qvalue | Count |
| Page: 1 |
Top |
Cell-cell communication analysis |
| Identification of potential cell-cell interactions between two cell types and their ligand-receptor pairs for different disease states |
| Ligand | Receptor | LRpair | Pathway | Tissue | Disease Stage |
| Page: 1 |
Top |
Single-cell gene regulatory network inference analysis |
| Find out the significant the regulons (TFs) and the target genes of each regulon across cell types for different disease states |
| TF | Cell Type | Tissue | Disease Stage | Target Gene | RSS | Regulon Activity |
| ∗The dot plots of a searched regulon are shown for all cell subpopulations in each disease state of each tissue based on the regulon specific score inferred using pySCENIC and by calculating the average expression. |
| Page: 1 |
Top |
Somatic mutation of malignant transformation related genes |
| Annotation of somatic variants for genes involved in malignant transformation |
| Hugo Symbol | Variant Class | Variant Classification | dbSNP RS | HGVSc | HGVSp | HGVSp Short | SWISSPROT | BIOTYPE | SIFT | PolyPhen | Tumor Sample Barcode | Tissue | Histology | Sex | Age | Stage | Therapy Types | Drugs | Outcome |
| SGCE | SNV | Missense_Mutation | novel | c.374N>C | p.Lys125Thr | p.K125T | O43556 | protein_coding | tolerated(0.14) | possibly_damaging(0.535) | TCGA-AC-A3W7-01 | Breast | breast invasive carcinoma | Female | >=65 | I/II | Hormone Therapy | femara | SD |
| SGCE | SNV | Missense_Mutation | c.729G>C | p.Gln243His | p.Q243H | O43556 | protein_coding | tolerated(0.1) | benign(0.007) | TCGA-B6-A0I8-01 | Breast | breast invasive carcinoma | Female | <65 | I/II | Unknown | Unknown | PD | |
| SGCE | SNV | Missense_Mutation | novel | c.1162C>T | p.Pro388Ser | p.P388S | O43556 | protein_coding | tolerated(0.09) | probably_damaging(0.95) | TCGA-BH-A42U-01 | Breast | breast invasive carcinoma | Female | >=65 | I/II | Unknown | Unknown | SD |
| SGCE | SNV | Missense_Mutation | c.388N>C | p.Glu130Gln | p.E130Q | O43556 | protein_coding | deleterious(0.04) | probably_damaging(0.943) | TCGA-C5-A3HD-01 | Cervix | cervical & endocervical cancer | Female | <65 | I/II | Chemotherapy | cisplatin | SD | |
| SGCE | SNV | Missense_Mutation | c.148N>A | p.Val50Ile | p.V50I | O43556 | protein_coding | deleterious(0.04) | possibly_damaging(0.661) | TCGA-AA-3673-01 | Colorectum | colon adenocarcinoma | Female | <65 | I/II | Unknown | Unknown | SD | |
| SGCE | SNV | Missense_Mutation | novel | c.21N>T | p.Trp7Cys | p.W7C | O43556 | protein_coding | deleterious_low_confidence(0) | probably_damaging(0.974) | TCGA-AA-A00N-01 | Colorectum | colon adenocarcinoma | Male | >=65 | I/II | Unknown | Unknown | PD |
| SGCE | SNV | Missense_Mutation | rs370800943 | c.1157N>T | p.Thr386Met | p.T386M | O43556 | protein_coding | deleterious(0) | probably_damaging(0.999) | TCGA-AD-6901-01 | Colorectum | colon adenocarcinoma | Male | >=65 | I/II | Chemotherapy | xeloda | PD |
| SGCE | SNV | Missense_Mutation | novel | c.32A>G | p.Asp11Gly | p.D11G | O43556 | protein_coding | deleterious_low_confidence(0.02) | benign(0.06) | TCGA-AD-6964-01 | Colorectum | colon adenocarcinoma | Male | <65 | III/IV | Chemotherapy | folfox | PD |
| SGCE | SNV | Missense_Mutation | novel | c.902A>G | p.Tyr301Cys | p.Y301C | O43556 | protein_coding | deleterious(0) | probably_damaging(0.973) | TCGA-F5-6814-01 | Colorectum | rectum adenocarcinoma | Male | <65 | I/II | Unknown | Unknown | SD |
| SGCE | SNV | Missense_Mutation | novel | c.55G>T | p.Gly19Cys | p.G19C | O43556 | protein_coding | tolerated_low_confidence(0.09) | possibly_damaging(0.713) | TCGA-A5-A0G2-01 | Endometrium | uterine corpus endometrioid carcinoma | Female | <65 | III/IV | Unknown | Unknown | SD |
| Page: 1 2 3 4 5 6 |
Top |
Related drugs of malignant transformation related genes |
| Identification of chemicals and drugs interact with genes involved in malignant transfromation |
| (DGIdb 4.0) |
| Entrez ID | Symbol | Category | Interaction Types | Drug Claim Name | Drug Name | PMIDs |
| Page: 1 |

Copyright 2023-Present -The University of Texas Health Science Center at Houston |