
|
|||||
|
 | |
| |
| |
| |
| |
| |
|
Gene: SGCB |
Gene summary for SGCB |
| Gene information | Species | Human | Gene symbol | SGCB | Gene ID | 6443 |
| Gene name | sarcoglycan beta | |
| Gene Alias | A3b | |
| Cytomap | 4q12 | |
| Gene Type | protein-coding | GO ID | GO:0001944 | UniProtAcc | Q16585 |
Top |
Malignant transformation analysis |
| Identification of the aberrant gene expression in precancerous and cancerous lesions by comparing the gene expression of stem-like cells in diseased tissues with normal stem cells |
| Entrez ID | Symbol | Replicates | Species | Organ | Tissue | Adj P-value | Log2FC | Malignancy |
| 6443 | SGCB | LZE4T | Human | Esophagus | ESCC | 1.25e-07 | 1.61e-01 | 0.0811 |
| 6443 | SGCB | LZE7T | Human | Esophagus | ESCC | 5.06e-07 | 5.35e-01 | 0.0667 |
| 6443 | SGCB | LZE24T | Human | Esophagus | ESCC | 2.61e-07 | 7.43e-02 | 0.0596 |
| 6443 | SGCB | P2T-E | Human | Esophagus | ESCC | 9.76e-27 | 4.46e-01 | 0.1177 |
| 6443 | SGCB | P4T-E | Human | Esophagus | ESCC | 1.20e-24 | 5.30e-01 | 0.1323 |
| 6443 | SGCB | P5T-E | Human | Esophagus | ESCC | 6.39e-05 | 1.47e-01 | 0.1327 |
| 6443 | SGCB | P8T-E | Human | Esophagus | ESCC | 1.14e-11 | 3.16e-01 | 0.0889 |
| 6443 | SGCB | P9T-E | Human | Esophagus | ESCC | 2.19e-07 | 2.58e-01 | 0.1131 |
| 6443 | SGCB | P10T-E | Human | Esophagus | ESCC | 5.57e-21 | 3.52e-01 | 0.116 |
| 6443 | SGCB | P11T-E | Human | Esophagus | ESCC | 2.54e-23 | 8.19e-01 | 0.1426 |
| 6443 | SGCB | P12T-E | Human | Esophagus | ESCC | 6.80e-25 | 4.64e-01 | 0.1122 |
| 6443 | SGCB | P15T-E | Human | Esophagus | ESCC | 1.48e-12 | 3.34e-01 | 0.1149 |
| 6443 | SGCB | P16T-E | Human | Esophagus | ESCC | 9.61e-14 | 2.23e-01 | 0.1153 |
| 6443 | SGCB | P17T-E | Human | Esophagus | ESCC | 1.02e-06 | 3.84e-01 | 0.1278 |
| 6443 | SGCB | P19T-E | Human | Esophagus | ESCC | 3.41e-06 | 6.97e-01 | 0.1662 |
| 6443 | SGCB | P20T-E | Human | Esophagus | ESCC | 1.52e-02 | 1.18e-01 | 0.1124 |
| 6443 | SGCB | P21T-E | Human | Esophagus | ESCC | 4.38e-15 | 2.92e-01 | 0.1617 |
| 6443 | SGCB | P22T-E | Human | Esophagus | ESCC | 7.40e-30 | 5.64e-01 | 0.1236 |
| 6443 | SGCB | P24T-E | Human | Esophagus | ESCC | 6.34e-12 | 3.41e-01 | 0.1287 |
| 6443 | SGCB | P26T-E | Human | Esophagus | ESCC | 2.32e-21 | 4.13e-01 | 0.1276 |
| Page: 1 2 3 4 5 |
| Tissue | Expression Dynamics | Abbreviation |
| Esophagus | 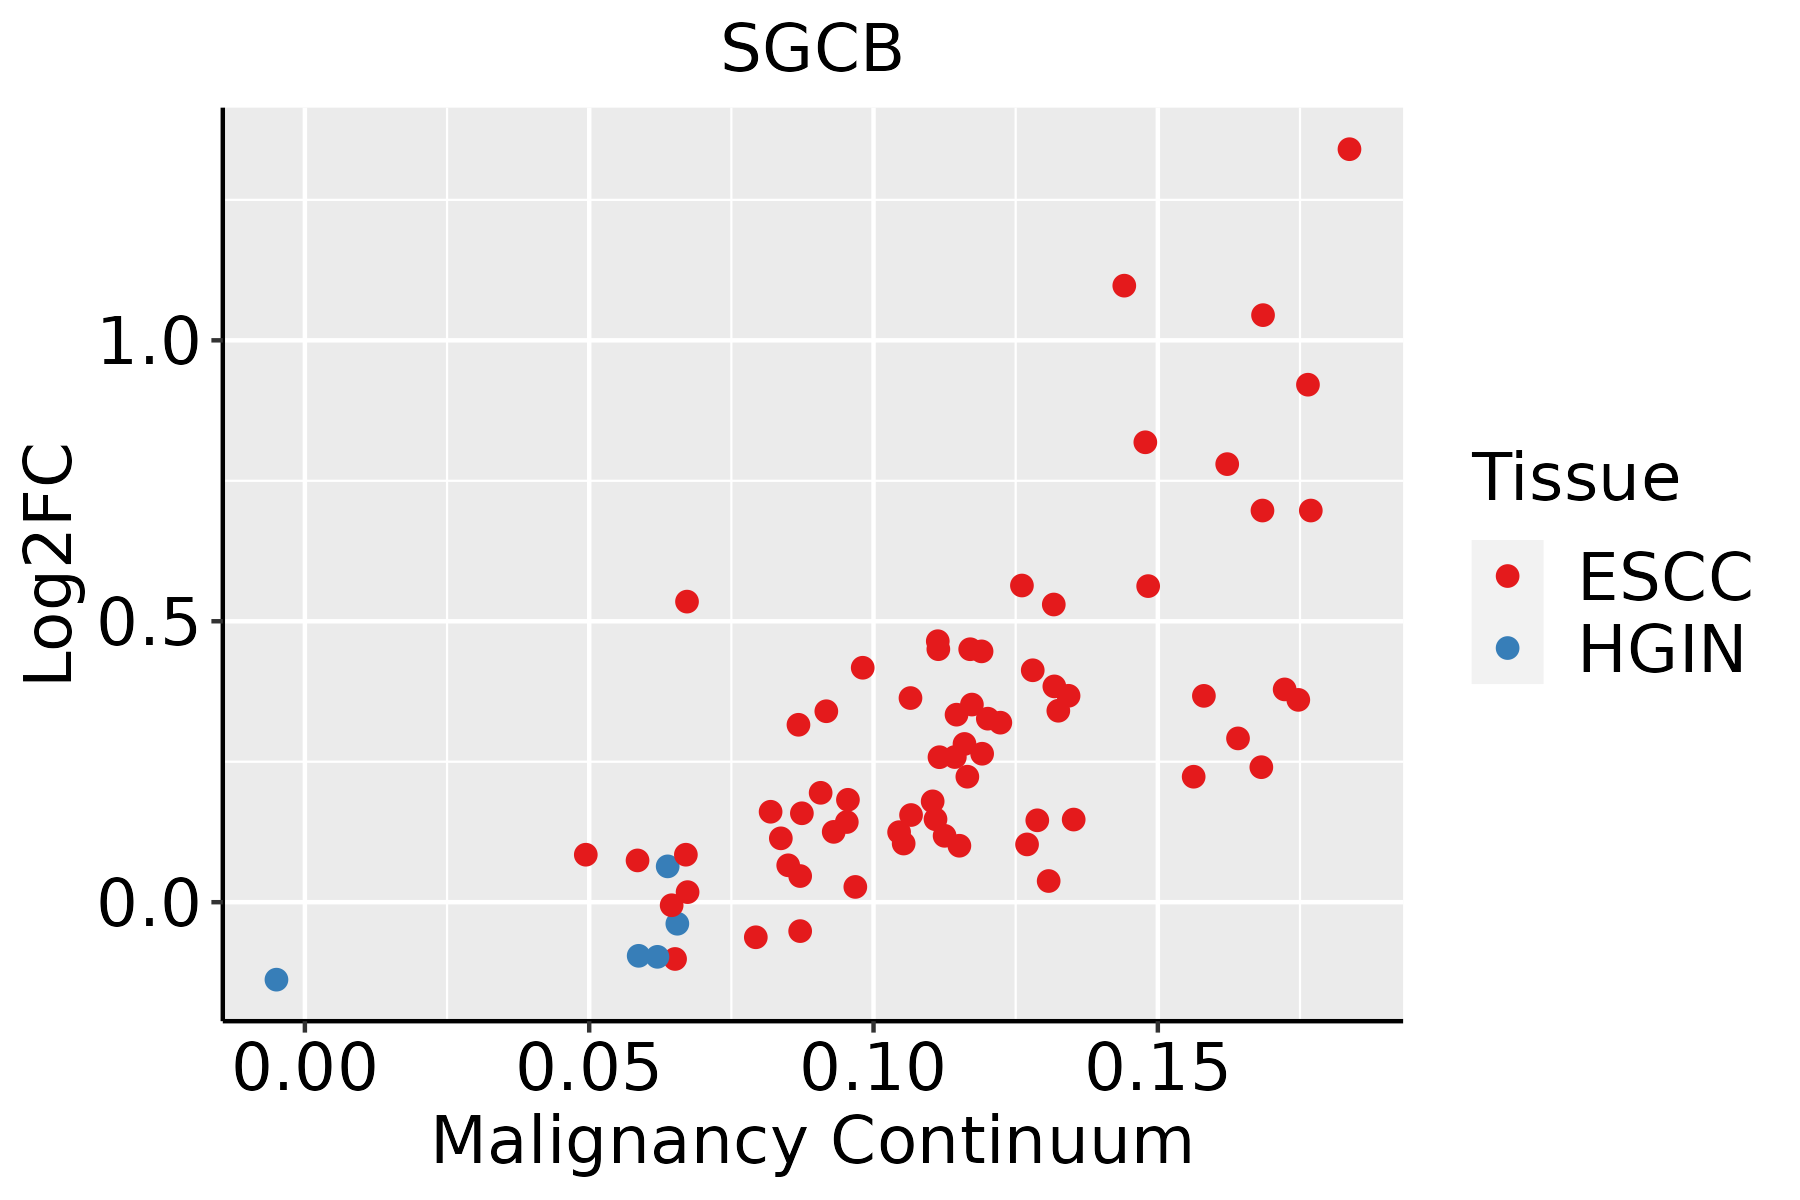 | ESCC: Esophageal squamous cell carcinoma |
| HGIN: High-grade intraepithelial neoplasias | ||
| LGIN: Low-grade intraepithelial neoplasias | ||
| Liver | 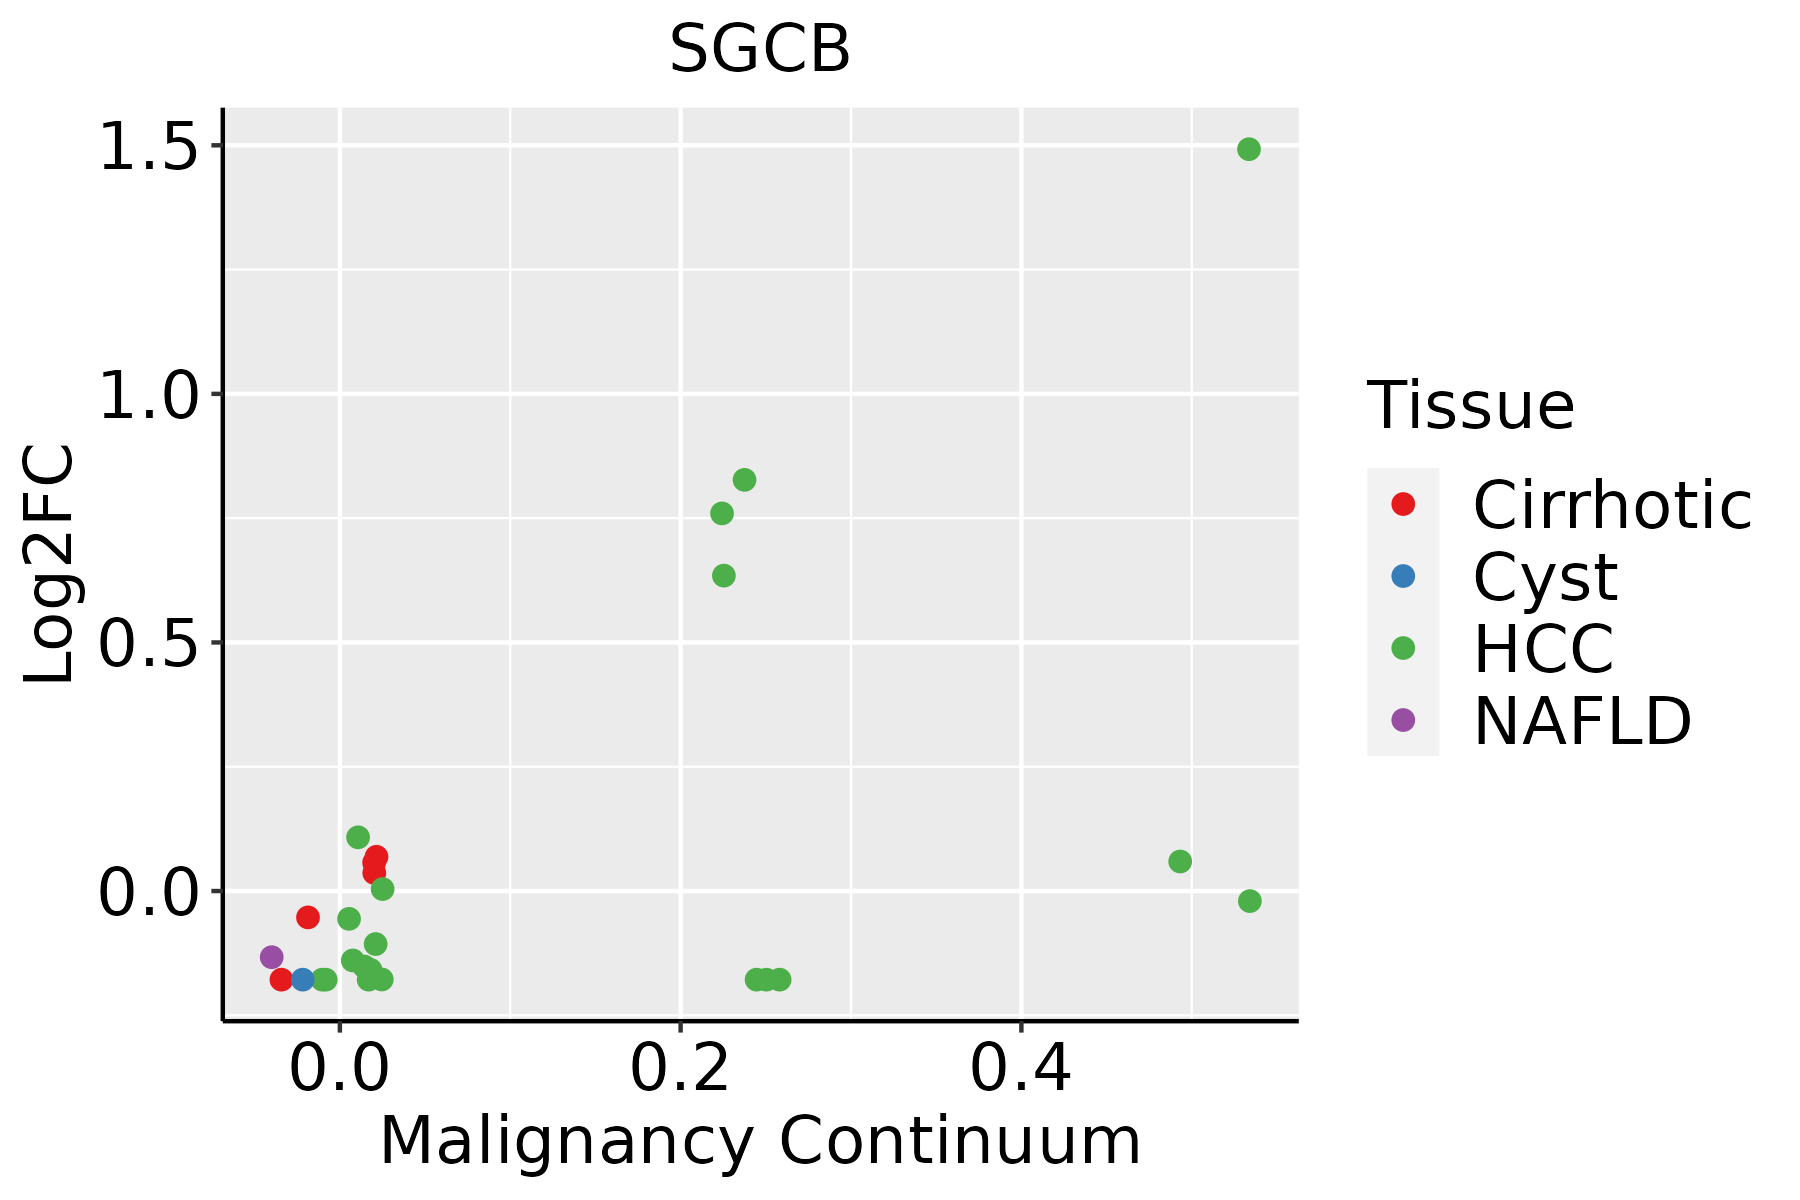 | HCC: Hepatocellular carcinoma |
| NAFLD: Non-alcoholic fatty liver disease | ||
| Oral Cavity | 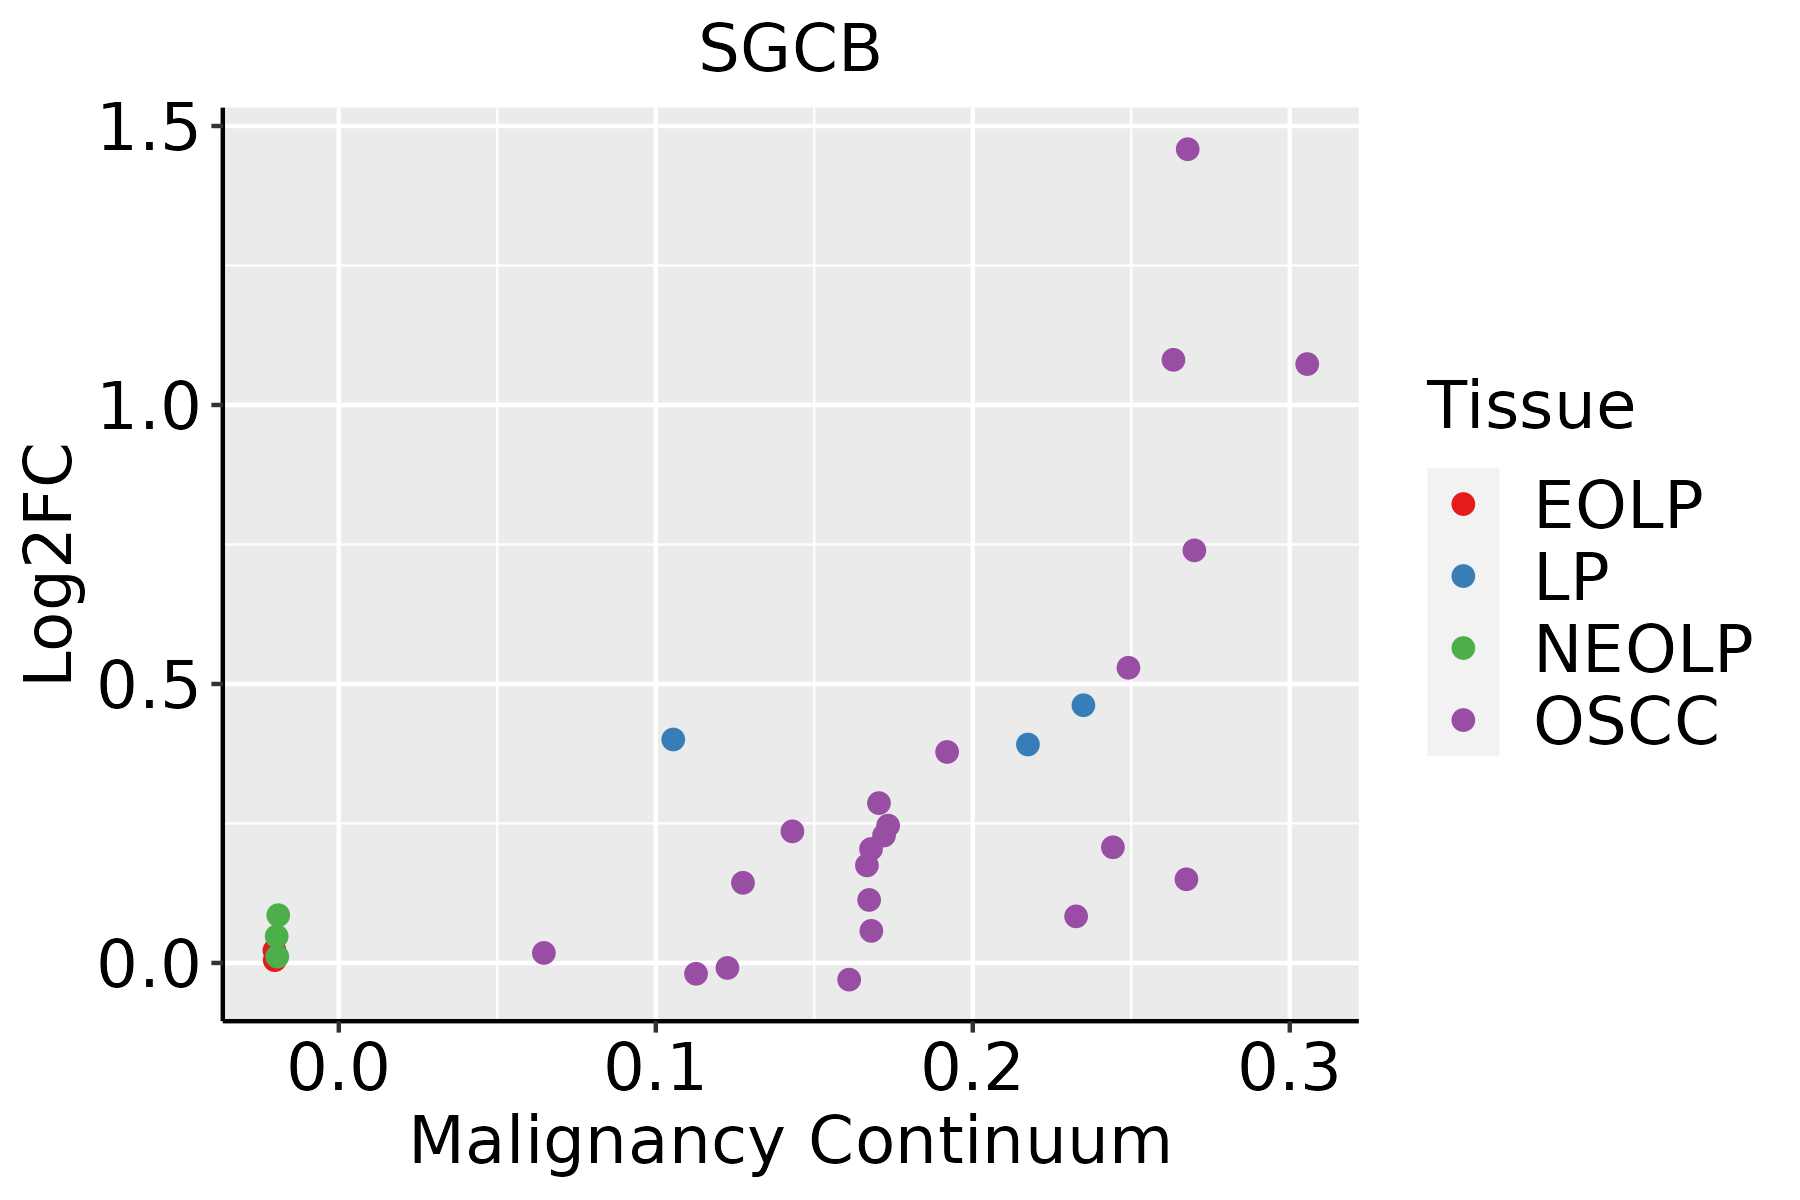 | EOLP: Erosive Oral lichen planus |
| LP: leukoplakia | ||
| NEOLP: Non-erosive oral lichen planus | ||
| OSCC: Oral squamous cell carcinoma | ||
| Thyroid |  | ATC: Anaplastic thyroid cancer |
| HT: Hashimoto's thyroiditis | ||
| PTC: Papillary thyroid cancer |
| ∗log2FC in expression of this searched gene in stem-like cells from each diseased tissue sample relative to stem-like cells in normal samples in each tissue plotted against the malignancy continuum. Samples are colored based on if they are from different disease stage. |
Top |
Malignant transformation related pathway analysis |
| Find out the enriched GO biological processes and KEGG pathways involved in transition from healthy to precancer to cancer |
| Tissue | Disease Stage | Enriched GO biological Processes |
| Colorectum | AD |  |
| Colorectum | SER |  |
| Colorectum | MSS |  |
| Colorectum | MSI-H |  |
| Colorectum | FAP |  |
| ∗Top 15 enriched GO BP terms are showed in the bar plot of each disease state in each tissue. Each row represents a significant GO biological process which is colored according to the -log10(p.adjust). |
| Page: 1 2 3 4 5 6 7 8 9 |
| GO ID | Tissue | Disease Stage | Description | Gene Ratio | Bg Ratio | pvalue | p.adjust | Count |
| GO:006053716 | Esophagus | ESCC | muscle tissue development | 211/8552 | 403/18723 | 3.84e-03 | 1.56e-02 | 211 |
| GO:00970841 | Esophagus | ESCC | vascular associated smooth muscle cell development | 9/8552 | 10/18723 | 5.09e-03 | 1.92e-02 | 9 |
| GO:00350512 | Esophagus | ESCC | cardiocyte differentiation | 86/8552 | 156/18723 | 1.09e-02 | 3.68e-02 | 86 |
| GO:001470615 | Esophagus | ESCC | striated muscle tissue development | 197/8552 | 384/18723 | 1.46e-02 | 4.74e-02 | 197 |
| GO:00605378 | Oral cavity | OSCC | muscle tissue development | 185/7305 | 403/18723 | 2.60e-03 | 1.14e-02 | 185 |
| GO:00426927 | Oral cavity | OSCC | muscle cell differentiation | 175/7305 | 384/18723 | 4.79e-03 | 1.92e-02 | 175 |
| GO:00147067 | Oral cavity | OSCC | striated muscle tissue development | 174/7305 | 384/18723 | 6.45e-03 | 2.40e-02 | 174 |
| GO:0097084 | Oral cavity | OSCC | vascular associated smooth muscle cell development | 8/7305 | 10/18723 | 1.03e-02 | 3.53e-02 | 8 |
| GO:006053719 | Thyroid | PTC | muscle tissue development | 156/5968 | 403/18723 | 1.98e-03 | 1.06e-02 | 156 |
| GO:001470617 | Thyroid | PTC | striated muscle tissue development | 144/5968 | 384/18723 | 1.05e-02 | 4.22e-02 | 144 |
| GO:006053724 | Thyroid | ATC | muscle tissue development | 181/6293 | 403/18723 | 1.27e-06 | 1.62e-05 | 181 |
| GO:001470622 | Thyroid | ATC | striated muscle tissue development | 168/6293 | 384/18723 | 1.91e-05 | 1.73e-04 | 168 |
| GO:004269216 | Thyroid | ATC | muscle cell differentiation | 165/6293 | 384/18723 | 7.17e-05 | 5.46e-04 | 165 |
| GO:000751716 | Thyroid | ATC | muscle organ development | 139/6293 | 327/18723 | 4.45e-04 | 2.64e-03 | 139 |
| GO:004873811 | Thyroid | ATC | cardiac muscle tissue development | 103/6293 | 236/18723 | 7.93e-04 | 4.37e-03 | 103 |
| GO:005114617 | Thyroid | ATC | striated muscle cell differentiation | 119/6293 | 283/18723 | 1.74e-03 | 8.70e-03 | 119 |
| GO:005500112 | Thyroid | ATC | muscle cell development | 81/6293 | 184/18723 | 2.02e-03 | 9.60e-03 | 81 |
| GO:003505111 | Thyroid | ATC | cardiocyte differentiation | 70/6293 | 156/18723 | 2.18e-03 | 1.02e-02 | 70 |
| GO:00970842 | Thyroid | ATC | vascular associated smooth muscle cell development | 8/6293 | 10/18723 | 3.60e-03 | 1.58e-02 | 8 |
| Page: 1 |
| Pathway ID | Tissue | Disease Stage | Description | Gene Ratio | Bg Ratio | pvalue | p.adjust | qvalue | Count |
| hsa0541630 | Esophagus | ESCC | Viral myocarditis | 41/4205 | 60/8465 | 2.59e-03 | 7.05e-03 | 3.61e-03 | 41 |
| hsa05416114 | Esophagus | ESCC | Viral myocarditis | 41/4205 | 60/8465 | 2.59e-03 | 7.05e-03 | 3.61e-03 | 41 |
| hsa0541614 | Liver | Cirrhotic | Viral myocarditis | 28/2530 | 60/8465 | 4.38e-03 | 1.68e-02 | 1.03e-02 | 28 |
| hsa0541615 | Liver | Cirrhotic | Viral myocarditis | 28/2530 | 60/8465 | 4.38e-03 | 1.68e-02 | 1.03e-02 | 28 |
| hsa0541629 | Oral cavity | OSCC | Viral myocarditis | 39/3704 | 60/8465 | 7.13e-04 | 2.09e-03 | 1.07e-03 | 39 |
| hsa05416113 | Oral cavity | OSCC | Viral myocarditis | 39/3704 | 60/8465 | 7.13e-04 | 2.09e-03 | 1.07e-03 | 39 |
| Page: 1 |
Top |
Cell-cell communication analysis |
| Identification of potential cell-cell interactions between two cell types and their ligand-receptor pairs for different disease states |
| Ligand | Receptor | LRpair | Pathway | Tissue | Disease Stage |
| Page: 1 |
Top |
Single-cell gene regulatory network inference analysis |
| Find out the significant the regulons (TFs) and the target genes of each regulon across cell types for different disease states |
| TF | Cell Type | Tissue | Disease Stage | Target Gene | RSS | Regulon Activity |
| ∗The dot plots of a searched regulon are shown for all cell subpopulations in each disease state of each tissue based on the regulon specific score inferred using pySCENIC and by calculating the average expression. |
| Page: 1 |
Top |
Somatic mutation of malignant transformation related genes |
| Annotation of somatic variants for genes involved in malignant transformation |
| Hugo Symbol | Variant Class | Variant Classification | dbSNP RS | HGVSc | HGVSp | HGVSp Short | SWISSPROT | BIOTYPE | SIFT | PolyPhen | Tumor Sample Barcode | Tissue | Histology | Sex | Age | Stage | Therapy Types | Drugs | Outcome |
| SGCB | SNV | Missense_Mutation | novel | c.898G>T | p.Val300Leu | p.V300L | Q16585 | protein_coding | deleterious(0.02) | probably_damaging(0.989) | TCGA-AN-A046-01 | Breast | breast invasive carcinoma | Female | >=65 | I/II | Unknown | Unknown | SD |
| SGCB | SNV | Missense_Mutation | c.82N>A | p.Glu28Lys | p.E28K | Q16585 | protein_coding | tolerated(0.12) | probably_damaging(0.971) | TCGA-BH-A0HF-01 | Breast | breast invasive carcinoma | Female | >=65 | I/II | Hormone Therapy | arimidex | SD | |
| SGCB | SNV | Missense_Mutation | c.128N>T | p.Gly43Val | p.G43V | Q16585 | protein_coding | deleterious(0) | probably_damaging(0.998) | TCGA-BH-A0HN-01 | Breast | breast invasive carcinoma | Female | >=65 | I/II | Hormone Therapy | arimidex | SD | |
| SGCB | SNV | Missense_Mutation | c.119T>A | p.Phe40Tyr | p.F40Y | Q16585 | protein_coding | deleterious(0) | probably_damaging(0.931) | TCGA-BH-A1FH-01 | Breast | breast invasive carcinoma | Female | <65 | III/IV | Unknown | Unknown | PD | |
| SGCB | deletion | Frame_Shift_Del | novel | c.362delN | p.Pro121LeufsTer7 | p.P121Lfs*7 | Q16585 | protein_coding | TCGA-D8-A27V-01 | Breast | breast invasive carcinoma | Female | <65 | I/II | Hormone Therapy | tamoxiphen | SD | ||
| SGCB | SNV | Missense_Mutation | novel | c.521G>T | p.Arg174Met | p.R174M | Q16585 | protein_coding | deleterious(0.01) | probably_damaging(0.997) | TCGA-2W-A8YY-01 | Cervix | cervical & endocervical cancer | Female | <65 | I/II | Chemotherapy | cisplatin | CR |
| SGCB | SNV | Missense_Mutation | novel | c.7G>A | p.Ala3Thr | p.A3T | Q16585 | protein_coding | tolerated_low_confidence(0.92) | possibly_damaging(0.483) | TCGA-5M-AAT6-01 | Colorectum | colon adenocarcinoma | Female | <65 | III/IV | Unknown | Unknown | PD |
| SGCB | SNV | Missense_Mutation | rs201439705 | c.392N>A | p.Arg131Gln | p.R131Q | Q16585 | protein_coding | tolerated(0.18) | benign(0.207) | TCGA-A6-2686-01 | Colorectum | colon adenocarcinoma | Female | >=65 | I/II | Unknown | Unknown | SD |
| SGCB | SNV | Missense_Mutation | rs555514820 | c.271N>T | p.Arg91Cys | p.R91C | Q16585 | protein_coding | deleterious(0) | probably_damaging(0.998) | TCGA-A6-6653-01 | Colorectum | colon adenocarcinoma | Male | >=65 | I/II | Unknown | Unknown | SD |
| SGCB | SNV | Missense_Mutation | c.594G>T | p.Leu198Phe | p.L198F | Q16585 | protein_coding | tolerated(0.08) | probably_damaging(0.998) | TCGA-AA-3697-01 | Colorectum | colon adenocarcinoma | Male | >=65 | I/II | Unknown | Unknown | SD |
| Page: 1 2 3 4 5 6 |
Top |
Related drugs of malignant transformation related genes |
| Identification of chemicals and drugs interact with genes involved in malignant transfromation |
| (DGIdb 4.0) |
| Entrez ID | Symbol | Category | Interaction Types | Drug Claim Name | Drug Name | PMIDs |
| Page: 1 |

Copyright 2023-Present -The University of Texas Health Science Center at Houston |