
|
|||||
|
 | |
| |
| |
| |
| |
| |
|
Gene: SFXN3 |
Gene summary for SFXN3 |
| Gene information | Species | Human | Gene symbol | SFXN3 | Gene ID | 81855 |
| Gene name | sideroflexin 3 | |
| Gene Alias | BA108L7.2 | |
| Cytomap | 10q24.31 | |
| Gene Type | protein-coding | GO ID | GO:0003333 | UniProtAcc | A0A1P0AYU5 |
Top |
Malignant transformation analysis |
| Identification of the aberrant gene expression in precancerous and cancerous lesions by comparing the gene expression of stem-like cells in diseased tissues with normal stem cells |
| Entrez ID | Symbol | Replicates | Species | Organ | Tissue | Adj P-value | Log2FC | Malignancy |
| 81855 | SFXN3 | LZE4T | Human | Esophagus | ESCC | 2.41e-05 | 1.34e-01 | 0.0811 |
| 81855 | SFXN3 | LZE24T | Human | Esophagus | ESCC | 5.89e-03 | 2.24e-01 | 0.0596 |
| 81855 | SFXN3 | P2T-E | Human | Esophagus | ESCC | 2.10e-11 | 8.27e-02 | 0.1177 |
| 81855 | SFXN3 | P4T-E | Human | Esophagus | ESCC | 4.51e-06 | 2.07e-01 | 0.1323 |
| 81855 | SFXN3 | P5T-E | Human | Esophagus | ESCC | 3.36e-08 | 1.34e-01 | 0.1327 |
| 81855 | SFXN3 | P8T-E | Human | Esophagus | ESCC | 1.19e-06 | 1.07e-01 | 0.0889 |
| 81855 | SFXN3 | P10T-E | Human | Esophagus | ESCC | 4.30e-18 | 8.42e-02 | 0.116 |
| 81855 | SFXN3 | P11T-E | Human | Esophagus | ESCC | 1.45e-13 | 5.68e-01 | 0.1426 |
| 81855 | SFXN3 | P12T-E | Human | Esophagus | ESCC | 3.10e-09 | 1.55e-01 | 0.1122 |
| 81855 | SFXN3 | P15T-E | Human | Esophagus | ESCC | 3.45e-06 | 1.86e-01 | 0.1149 |
| 81855 | SFXN3 | P16T-E | Human | Esophagus | ESCC | 3.10e-13 | 1.99e-01 | 0.1153 |
| 81855 | SFXN3 | P17T-E | Human | Esophagus | ESCC | 2.68e-02 | 3.44e-01 | 0.1278 |
| 81855 | SFXN3 | P19T-E | Human | Esophagus | ESCC | 3.00e-04 | 4.63e-01 | 0.1662 |
| 81855 | SFXN3 | P21T-E | Human | Esophagus | ESCC | 7.37e-15 | 2.75e-01 | 0.1617 |
| 81855 | SFXN3 | P22T-E | Human | Esophagus | ESCC | 1.28e-09 | 9.95e-02 | 0.1236 |
| 81855 | SFXN3 | P23T-E | Human | Esophagus | ESCC | 4.30e-02 | 1.13e-01 | 0.108 |
| 81855 | SFXN3 | P24T-E | Human | Esophagus | ESCC | 5.57e-10 | 2.04e-01 | 0.1287 |
| 81855 | SFXN3 | P26T-E | Human | Esophagus | ESCC | 8.66e-13 | 1.34e-01 | 0.1276 |
| 81855 | SFXN3 | P27T-E | Human | Esophagus | ESCC | 1.50e-02 | 1.28e-01 | 0.1055 |
| 81855 | SFXN3 | P28T-E | Human | Esophagus | ESCC | 4.56e-05 | 1.23e-01 | 0.1149 |
| Page: 1 2 3 4 |
| Tissue | Expression Dynamics | Abbreviation |
| Esophagus | 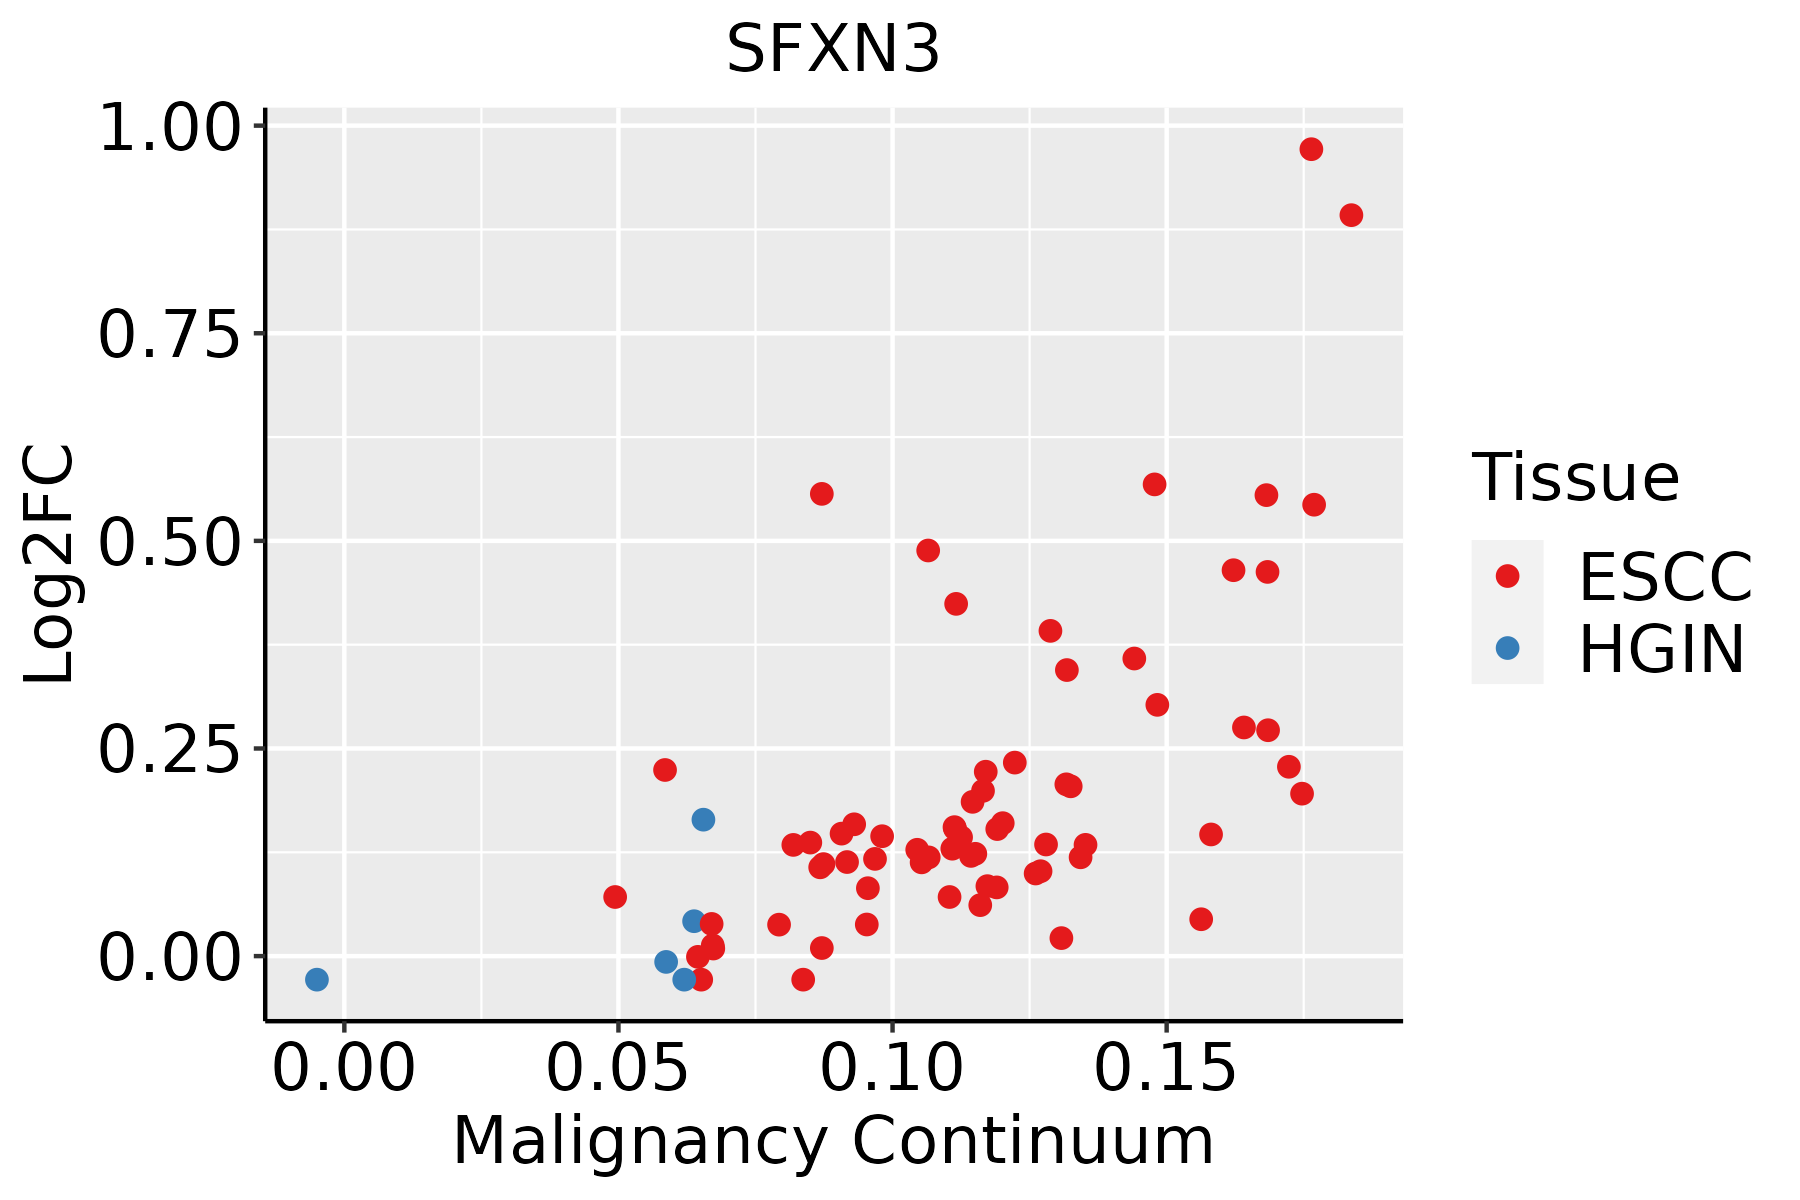 | ESCC: Esophageal squamous cell carcinoma |
| HGIN: High-grade intraepithelial neoplasias | ||
| LGIN: Low-grade intraepithelial neoplasias | ||
| Liver |  | HCC: Hepatocellular carcinoma |
| NAFLD: Non-alcoholic fatty liver disease | ||
| Oral Cavity |  | EOLP: Erosive Oral lichen planus |
| LP: leukoplakia | ||
| NEOLP: Non-erosive oral lichen planus | ||
| OSCC: Oral squamous cell carcinoma | ||
| Thyroid | 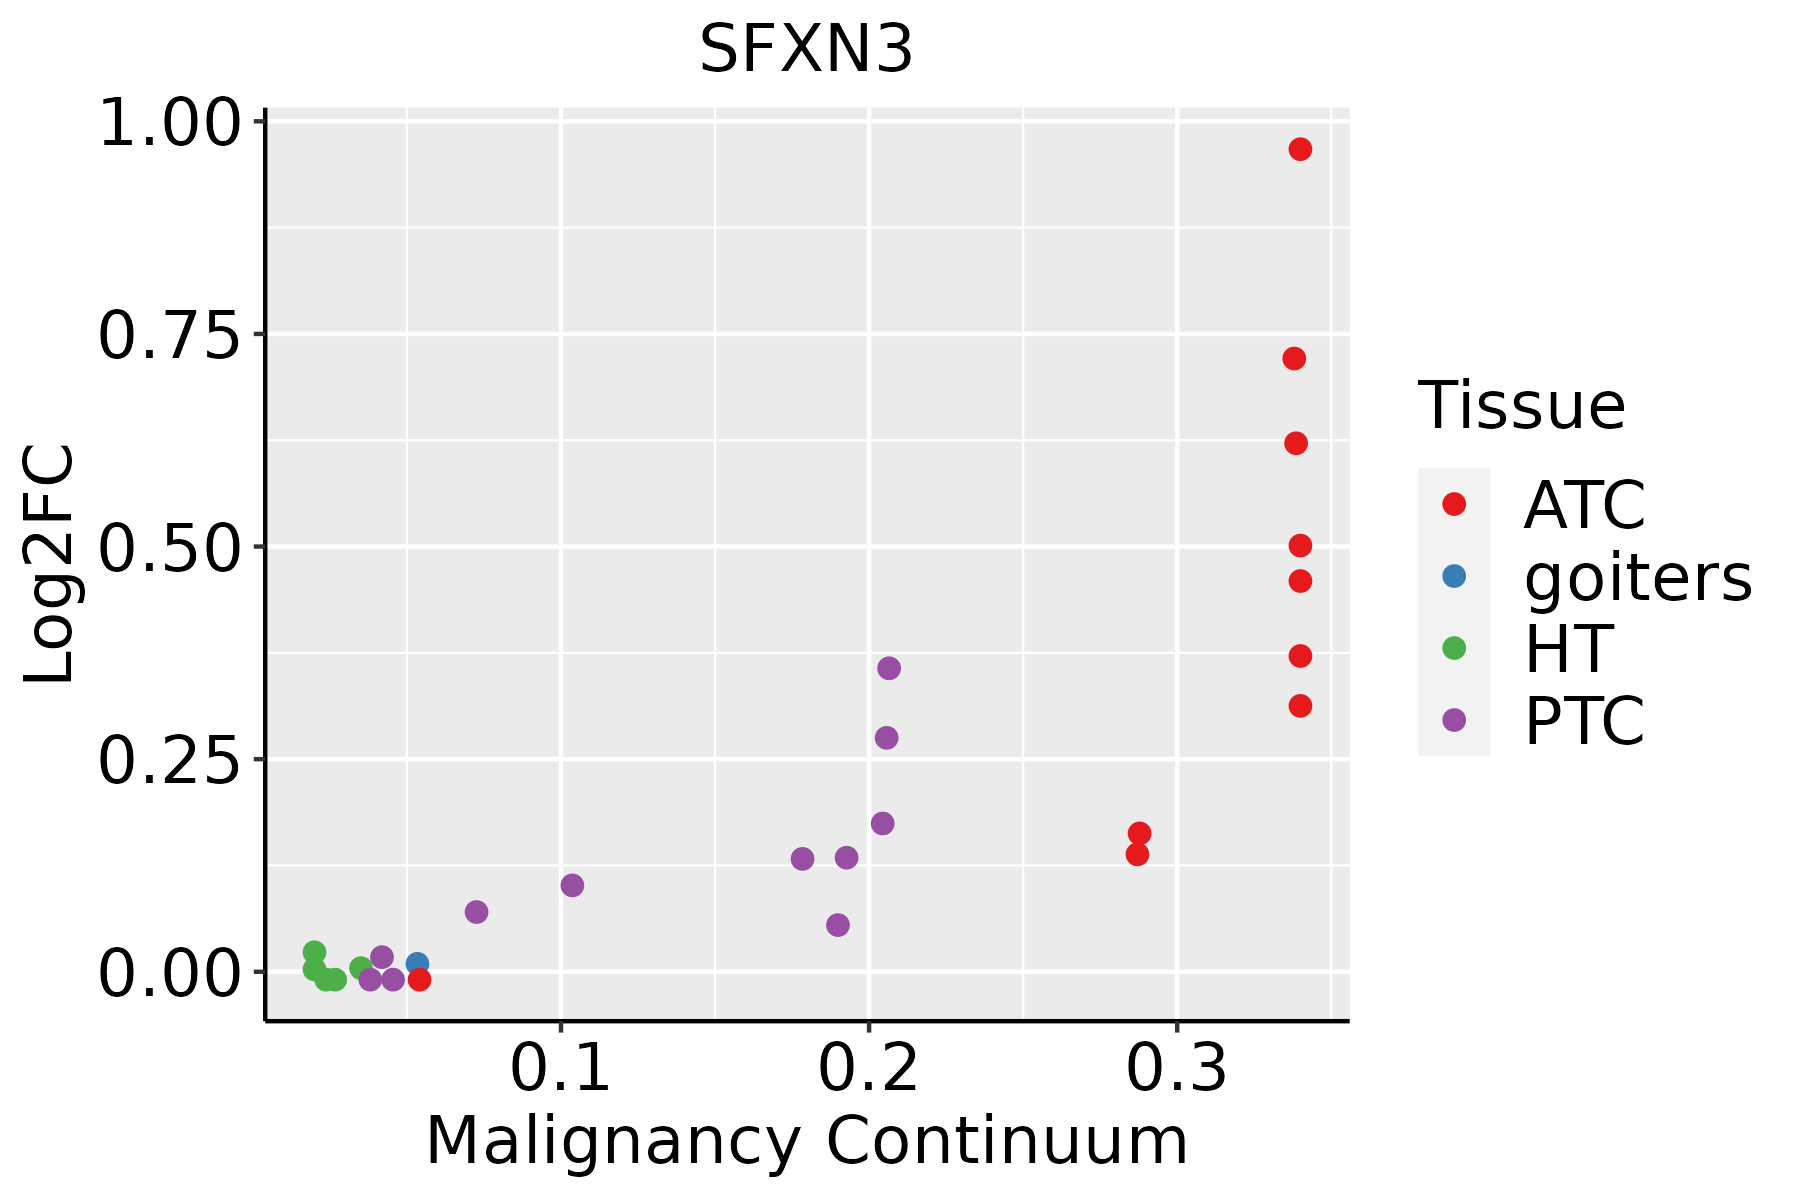 | ATC: Anaplastic thyroid cancer |
| HT: Hashimoto's thyroiditis | ||
| PTC: Papillary thyroid cancer |
| ∗log2FC in expression of this searched gene in stem-like cells from each diseased tissue sample relative to stem-like cells in normal samples in each tissue plotted against the malignancy continuum. Samples are colored based on if they are from different disease stage. |
Top |
Malignant transformation related pathway analysis |
| Find out the enriched GO biological processes and KEGG pathways involved in transition from healthy to precancer to cancer |
| Tissue | Disease Stage | Enriched GO biological Processes |
| Colorectum | AD |  |
| Colorectum | SER |  |
| Colorectum | MSS |  |
| Colorectum | MSI-H |  |
| Colorectum | FAP |  |
| ∗Top 15 enriched GO BP terms are showed in the bar plot of each disease state in each tissue. Each row represents a significant GO biological process which is colored according to the -log10(p.adjust). |
| Page: 1 2 3 4 5 6 7 8 9 |
| GO ID | Tissue | Disease Stage | Description | Gene Ratio | Bg Ratio | pvalue | p.adjust | Count |
| GO:0006839110 | Esophagus | ESCC | mitochondrial transport | 187/8552 | 254/18723 | 8.35e-20 | 9.81e-18 | 187 |
| GO:1990542110 | Esophagus | ESCC | mitochondrial transmembrane transport | 72/8552 | 102/18723 | 2.94e-07 | 4.23e-06 | 72 |
| GO:000683912 | Liver | HCC | mitochondrial transport | 184/7958 | 254/18723 | 2.30e-22 | 3.83e-20 | 184 |
| GO:199054212 | Liver | HCC | mitochondrial transmembrane transport | 78/7958 | 102/18723 | 2.73e-12 | 1.26e-10 | 78 |
| GO:000683918 | Oral cavity | OSCC | mitochondrial transport | 162/7305 | 254/18723 | 8.96e-16 | 6.52e-14 | 162 |
| GO:199054218 | Oral cavity | OSCC | mitochondrial transmembrane transport | 56/7305 | 102/18723 | 8.06e-04 | 4.32e-03 | 56 |
| GO:0032329 | Oral cavity | OSCC | serine transport | 9/7305 | 11/18723 | 4.85e-03 | 1.92e-02 | 9 |
| GO:000683919 | Oral cavity | LP | mitochondrial transport | 119/4623 | 254/18723 | 1.06e-14 | 1.33e-12 | 119 |
| GO:199054219 | Oral cavity | LP | mitochondrial transmembrane transport | 37/4623 | 102/18723 | 5.93e-03 | 3.53e-02 | 37 |
| GO:00323291 | Oral cavity | LP | serine transport | 7/4623 | 11/18723 | 7.01e-03 | 3.96e-02 | 7 |
| GO:000683928 | Thyroid | PTC | mitochondrial transport | 150/5968 | 254/18723 | 2.76e-19 | 3.34e-17 | 150 |
| GO:199054225 | Thyroid | PTC | mitochondrial transmembrane transport | 57/5968 | 102/18723 | 4.49e-07 | 7.38e-06 | 57 |
| GO:000683929 | Thyroid | ATC | mitochondrial transport | 151/6293 | 254/18723 | 2.07e-17 | 2.14e-15 | 151 |
| GO:199054226 | Thyroid | ATC | mitochondrial transmembrane transport | 57/6293 | 102/18723 | 3.05e-06 | 3.49e-05 | 57 |
| GO:00323292 | Thyroid | ATC | serine transport | 8/6293 | 11/18723 | 9.31e-03 | 3.44e-02 | 8 |
| Page: 1 |
| Pathway ID | Tissue | Disease Stage | Description | Gene Ratio | Bg Ratio | pvalue | p.adjust | qvalue | Count |
| Page: 1 |
Top |
Cell-cell communication analysis |
| Identification of potential cell-cell interactions between two cell types and their ligand-receptor pairs for different disease states |
| Ligand | Receptor | LRpair | Pathway | Tissue | Disease Stage |
| Page: 1 |
Top |
Single-cell gene regulatory network inference analysis |
| Find out the significant the regulons (TFs) and the target genes of each regulon across cell types for different disease states |
| TF | Cell Type | Tissue | Disease Stage | Target Gene | RSS | Regulon Activity |
| ∗The dot plots of a searched regulon are shown for all cell subpopulations in each disease state of each tissue based on the regulon specific score inferred using pySCENIC and by calculating the average expression. |
| Page: 1 |
Top |
Somatic mutation of malignant transformation related genes |
| Annotation of somatic variants for genes involved in malignant transformation |
| Hugo Symbol | Variant Class | Variant Classification | dbSNP RS | HGVSc | HGVSp | HGVSp Short | SWISSPROT | BIOTYPE | SIFT | PolyPhen | Tumor Sample Barcode | Tissue | Histology | Sex | Age | Stage | Therapy Types | Drugs | Outcome |
| SFXN3 | SNV | Missense_Mutation | rs138356625 | c.283N>T | p.Arg95Cys | p.R95C | Q9BWM7 | protein_coding | deleterious(0) | probably_damaging(0.999) | TCGA-EW-A1IZ-01 | Breast | breast invasive carcinoma | Female | <65 | III/IV | Chemotherapy | taxotere | SD |
| SFXN3 | SNV | Missense_Mutation | c.931G>A | p.Glu311Lys | p.E311K | Q9BWM7 | protein_coding | tolerated(1) | benign(0.001) | TCGA-GM-A2DO-01 | Breast | breast invasive carcinoma | Female | <65 | I/II | Hormone Therapy | tamoxiphen | CR | |
| SFXN3 | SNV | Missense_Mutation | novel | c.896G>A | p.Ser299Asn | p.S299N | Q9BWM7 | protein_coding | tolerated(0.18) | benign(0.03) | TCGA-MA-AA3Z-01 | Cervix | cervical & endocervical cancer | Female | <65 | I/II | Unknown | Unknown | SD |
| SFXN3 | SNV | Missense_Mutation | c.494C>T | p.Ala165Val | p.A165V | Q9BWM7 | protein_coding | deleterious(0) | probably_damaging(0.998) | TCGA-A6-6781-01 | Colorectum | colon adenocarcinoma | Male | <65 | III/IV | Chemotherapy | oxaliplatin | SD | |
| SFXN3 | SNV | Missense_Mutation | c.200N>T | p.Thr67Ile | p.T67I | Q9BWM7 | protein_coding | deleterious(0.01) | probably_damaging(0.93) | TCGA-AD-6895-01 | Colorectum | colon adenocarcinoma | Male | >=65 | III/IV | Unknown | Unknown | SD | |
| SFXN3 | SNV | Missense_Mutation | novel | c.707G>T | p.Arg236Ile | p.R236I | Q9BWM7 | protein_coding | deleterious(0) | probably_damaging(0.967) | TCGA-F5-6814-01 | Colorectum | rectum adenocarcinoma | Male | <65 | I/II | Unknown | Unknown | SD |
| SFXN3 | SNV | Missense_Mutation | c.685A>G | p.Ile229Val | p.I229V | Q9BWM7 | protein_coding | tolerated(0.06) | benign(0.277) | TCGA-G5-6233-01 | Colorectum | rectum adenocarcinoma | Male | >=65 | III/IV | Chemotherapy | 5-fluorouracil | PD | |
| SFXN3 | SNV | Missense_Mutation | rs763079710 | c.113N>A | p.Arg38Gln | p.R38Q | Q9BWM7 | protein_coding | deleterious(0.04) | possibly_damaging(0.889) | TCGA-A5-A0G2-01 | Endometrium | uterine corpus endometrioid carcinoma | Female | <65 | III/IV | Unknown | Unknown | SD |
| SFXN3 | SNV | Missense_Mutation | rs146965455 | c.202N>A | p.Glu68Lys | p.E68K | Q9BWM7 | protein_coding | tolerated(0.55) | benign(0.147) | TCGA-A5-A0G2-01 | Endometrium | uterine corpus endometrioid carcinoma | Female | <65 | III/IV | Unknown | Unknown | SD |
| SFXN3 | SNV | Missense_Mutation | novel | c.639N>T | p.Glu213Asp | p.E213D | Q9BWM7 | protein_coding | tolerated(0.14) | benign(0.119) | TCGA-A5-A0G2-01 | Endometrium | uterine corpus endometrioid carcinoma | Female | <65 | III/IV | Unknown | Unknown | SD |
| Page: 1 2 3 4 |
Top |
Related drugs of malignant transformation related genes |
| Identification of chemicals and drugs interact with genes involved in malignant transfromation |
| (DGIdb 4.0) |
| Entrez ID | Symbol | Category | Interaction Types | Drug Claim Name | Drug Name | PMIDs |
| Page: 1 |

Copyright 2023-Present -The University of Texas Health Science Center at Houston |