Schematic overview of the cellular and molecular mechanisms involved in the cancer progression, including the proposed cellular and molecular mechanisms in cancer cells trajectory. AT1: alveolar type 1 cells; AT2: alveolar type 2 cells; AAH: atypical adenomatous hyperplasia; AIS: adenocarcinoma in situ; MIA: minimally invasive adenocarcinoma; IA: invasive adenocarcinoma; EMT: epithelial-mesenchymal transition

Home

Download

Statistics

Help

Contact

Center for Computational Systems Medicine
leaf

Gene summary

leaf

Malignant transformation analysis

leaf

Malignant transformation related pathway analysis

leaf

Cell-cell communication analysis

leaf

Single-cell gene regulatory network inference analysis

leaf

Somatic mutation of malignant transformation related genes

leaf

Related drugs of malignant transformation related genes

Gene: SFXN1

Gene summary for SFXN1

check button Gene summary.

Gene informationSpeciesHuman
Gene symbol

SFXN1

Gene ID

94081

Gene namesideroflexin 1
Gene AliasSLC56A1
Cytomap5q35.2
Gene Typeprotein-coding
GO ID

GO:0003333

UniProtAcc

Q9H9B4


Top

Malignant transformation analysis

check button Identification of the aberrant gene expression in precancerous and cancerous lesions by comparing the gene expression of stem-like cells in diseased tissues with normal stem cells
check button Malignant transformation involving gene list.
Entrez IDSymbolReplicatesSpeciesOrganTissueAdj P-valueLog2FCMalignancy
94081SFXN1HTA11_347_2000001011HumanColorectumAD1.41e-063.60e-01-0.1954
94081SFXN1A015-C-203HumanColorectumFAP1.62e-08-2.17e-01-0.1294
94081SFXN1A002-C-201HumanColorectumFAP1.13e-06-2.77e-010.0324
94081SFXN1A002-C-205HumanColorectumFAP1.24e-06-2.75e-01-0.1236
94081SFXN1A015-C-006HumanColorectumFAP3.88e-03-2.04e-01-0.0994
94081SFXN1A015-C-106HumanColorectumFAP9.46e-03-1.53e-01-0.0511
94081SFXN1A002-C-114HumanColorectumFAP1.98e-03-2.19e-01-0.1561
94081SFXN1A015-C-104HumanColorectumFAP1.83e-07-1.74e-01-0.1899
94081SFXN1A001-C-014HumanColorectumFAP4.36e-05-1.47e-010.0135
94081SFXN1A002-C-016HumanColorectumFAP1.96e-08-2.35e-010.0521
94081SFXN1A002-C-116HumanColorectumFAP6.12e-08-2.50e-01-0.0452
94081SFXN1A014-C-008HumanColorectumFAP2.72e-03-2.69e-01-0.191
94081SFXN1A018-E-020HumanColorectumFAP6.78e-03-1.25e-01-0.2034
94081SFXN1F034HumanColorectumFAP2.49e-07-2.51e-01-0.0665
94081SFXN1F072BHumanColorectumFAP2.35e-02-2.25e-010.257
94081SFXN1CRC-3-11773HumanColorectumCRC1.48e-02-1.70e-010.2564
94081SFXN1LZE2DHumanEsophagusHGIN1.09e-021.96e-010.0642
94081SFXN1LZE2THumanEsophagusESCC5.82e-081.53e+000.082
94081SFXN1LZE4THumanEsophagusESCC8.25e-206.24e-010.0811
94081SFXN1LZE5THumanEsophagusESCC9.82e-042.09e-010.0514
Page: 1 2 3 4 5 6 7 

check button Transcriptomic changes along malignancy continuum.
TissueExpression DynamicsAbbreviation
Colorectum (GSE201348)The image shows the transcriptomic changes along malignancy continuum.log2FC in expression of this searched gene in stem-like cells from each diseased tissue sample relative to stem-like cells in normal samples in each tissue plotted against the malignancy continuum. Samples are colored based on if they are from different disease stage.
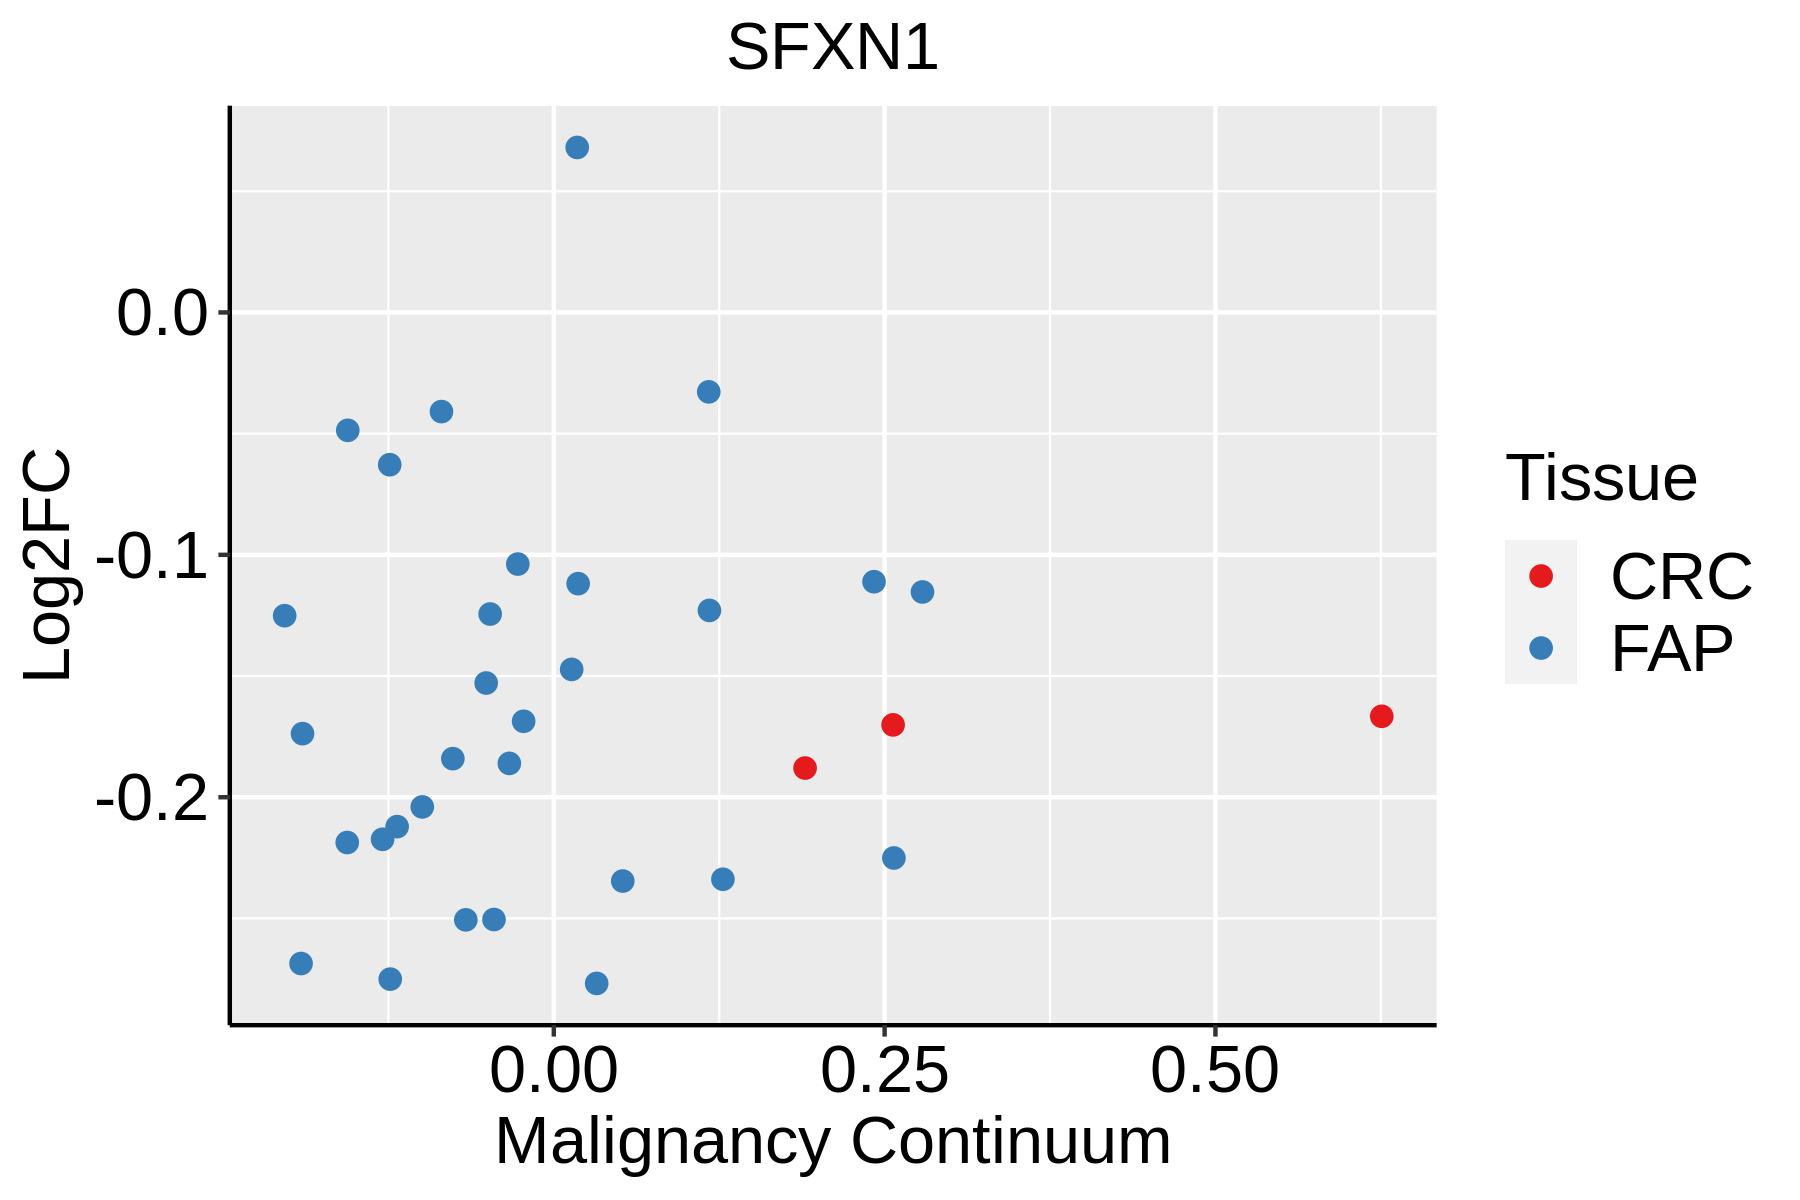
FAP: Familial adenomatous polyposis
CRC: Colorectal cancer
Colorectum (HTA11)The image shows the transcriptomic changes along malignancy continuum.log2FC in expression of this searched gene in stem-like cells from each diseased tissue sample relative to stem-like cells in normal samples in each tissue plotted against the malignancy continuum. Samples are colored based on if they are from different disease stage.AD: Adenomas
SER: Sessile serrated lesions
MSI-H: Microsatellite-high colorectal cancer
MSS: Microsatellite stable colorectal cancer
EsophagusThe image shows the transcriptomic changes along malignancy continuum.log2FC in expression of this searched gene in stem-like cells from each diseased tissue sample relative to stem-like cells in normal samples in each tissue plotted against the malignancy continuum. Samples are colored based on if they are from different disease stage.ESCC: Esophageal squamous cell carcinoma
HGIN: High-grade intraepithelial neoplasias
LGIN: Low-grade intraepithelial neoplasias
LiverThe image shows the transcriptomic changes along malignancy continuum.log2FC in expression of this searched gene in stem-like cells from each diseased tissue sample relative to stem-like cells in normal samples in each tissue plotted against the malignancy continuum. Samples are colored based on if they are from different disease stage.
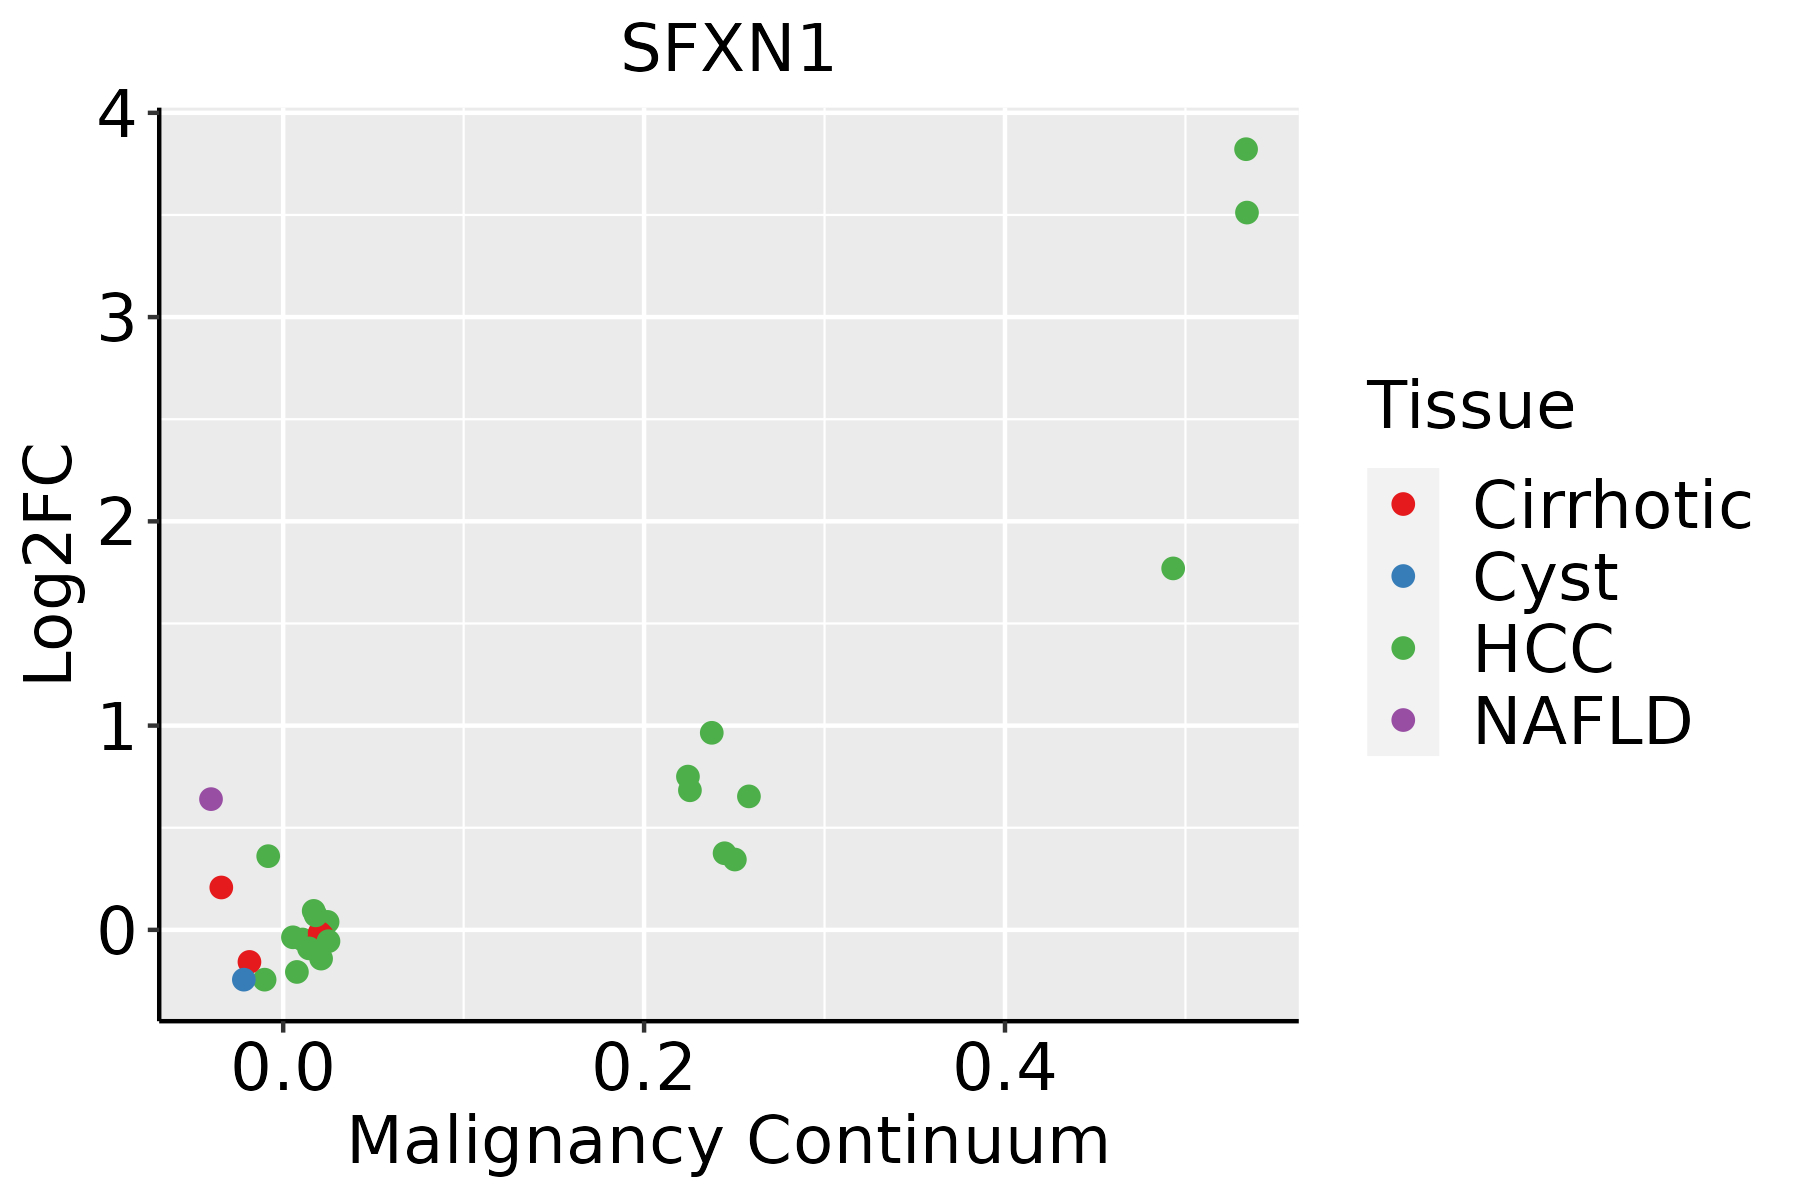
HCC: Hepatocellular carcinoma
NAFLD: Non-alcoholic fatty liver disease
Oral CavityThe image shows the transcriptomic changes along malignancy continuum.log2FC in expression of this searched gene in stem-like cells from each diseased tissue sample relative to stem-like cells in normal samples in each tissue plotted against the malignancy continuum. Samples are colored based on if they are from different disease stage.
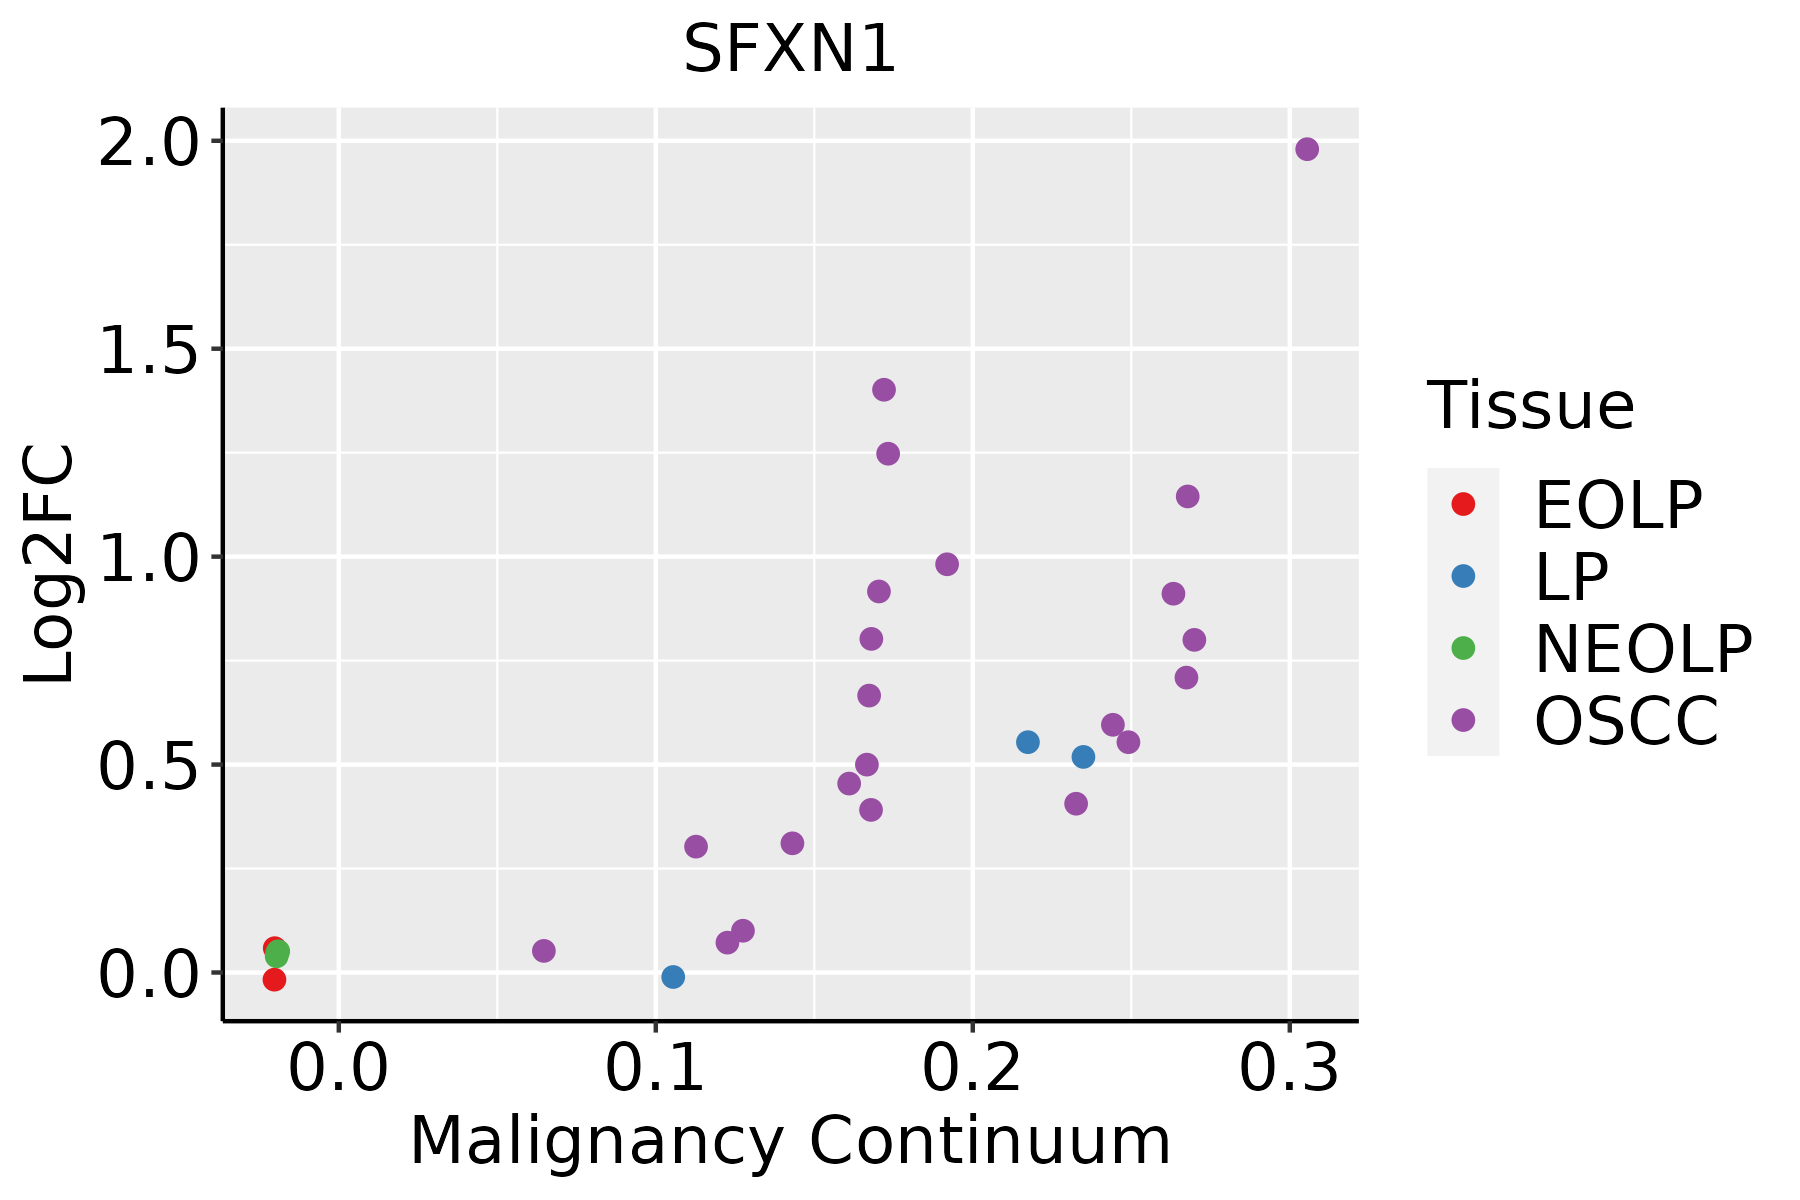
EOLP: Erosive Oral lichen planus
LP: leukoplakia
NEOLP: Non-erosive oral lichen planus
OSCC: Oral squamous cell carcinoma
SkinThe image shows the transcriptomic changes along malignancy continuum.log2FC in expression of this searched gene in stem-like cells from each diseased tissue sample relative to stem-like cells in normal samples in each tissue plotted against the malignancy continuum. Samples are colored based on if they are from different disease stage.AK: Actinic keratosis
cSCC: Cutaneous squamous cell carcinoma
SCCIS:squamous cell carcinoma in situ
ThyroidThe image shows the transcriptomic changes along malignancy continuum.log2FC in expression of this searched gene in stem-like cells from each diseased tissue sample relative to stem-like cells in normal samples in each tissue plotted against the malignancy continuum. Samples are colored based on if they are from different disease stage.
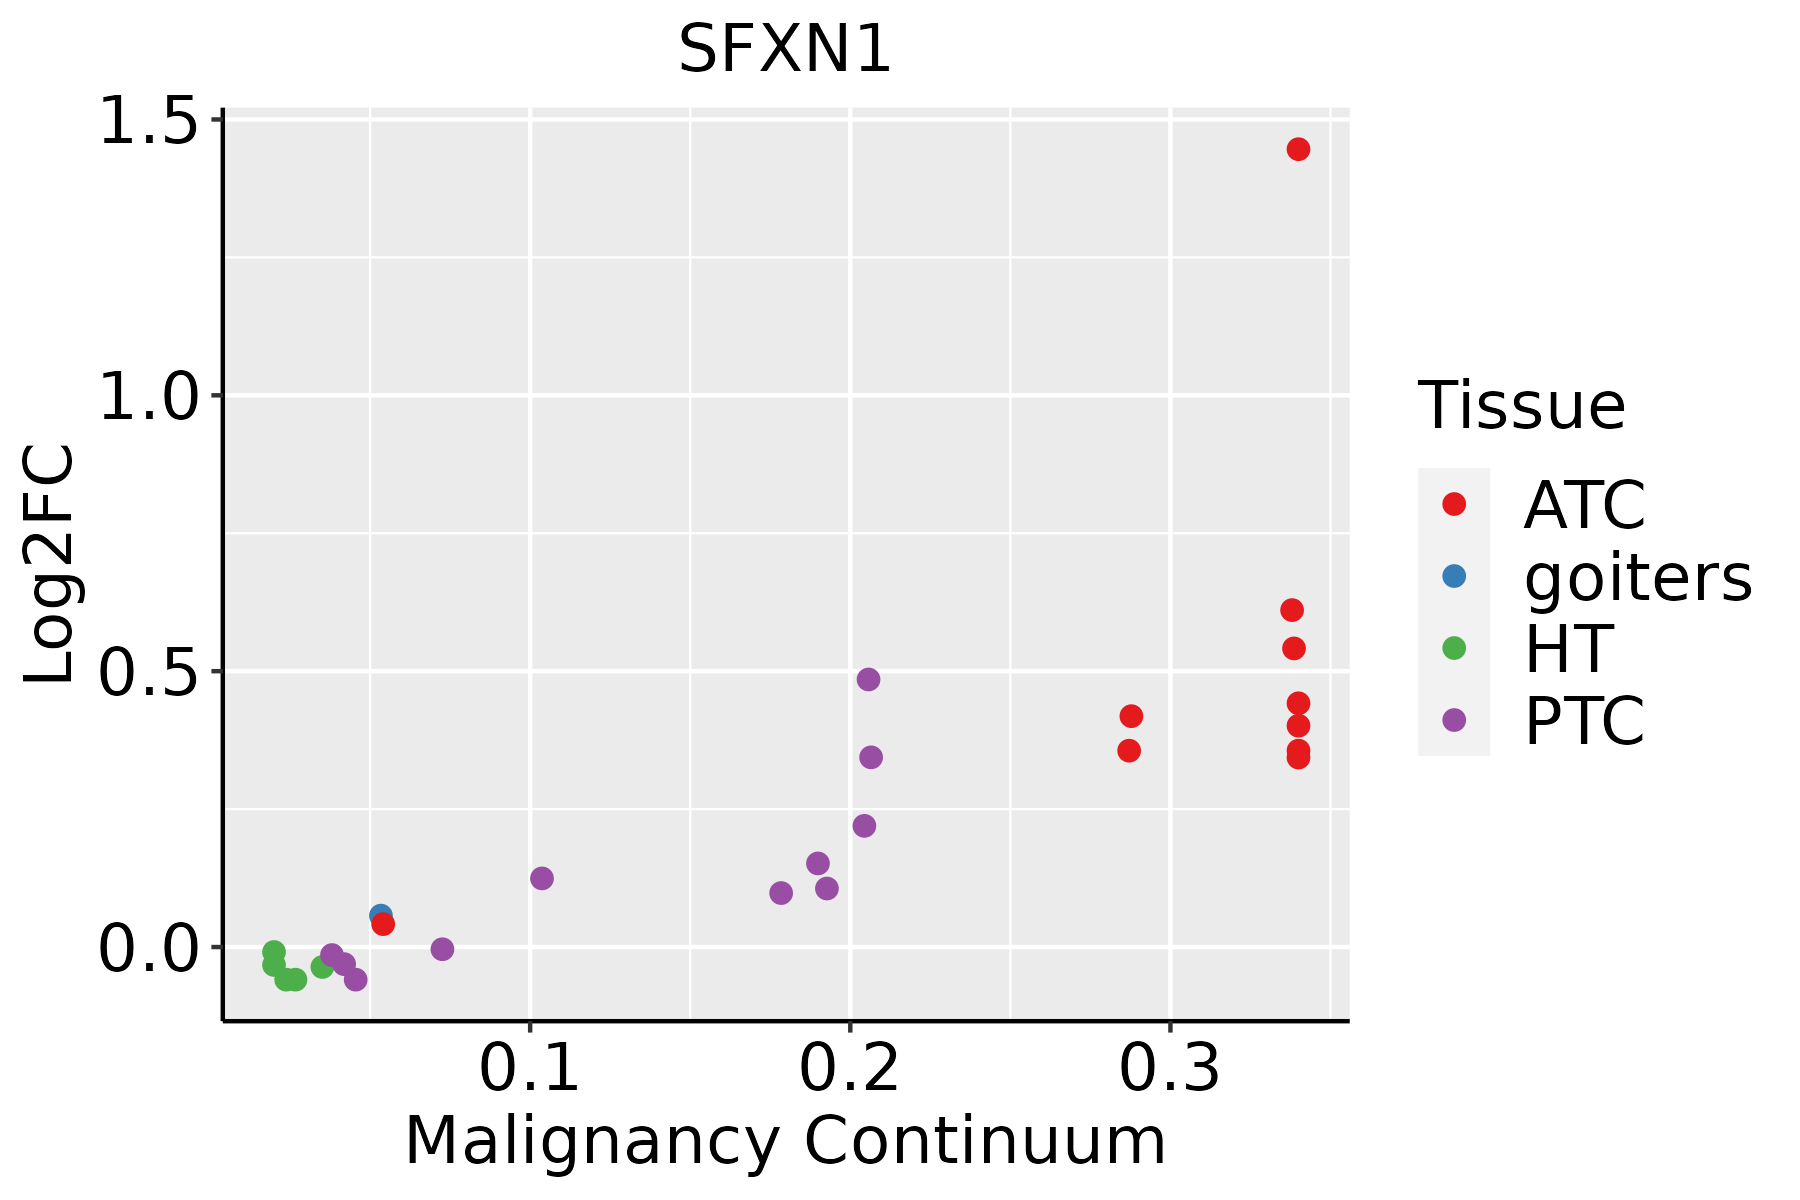
ATC: Anaplastic thyroid cancer
HT: Hashimoto's thyroiditis
PTC: Papillary thyroid cancer
∗log2FC in expression of this searched gene in stem-like cells from each diseased tissue sample relative to stem-like cells in normal samples in each tissue plotted against the malignancy continuum. Samples are colored based on if they are from different disease stage.

Top

Malignant transformation related pathway analysis

check buttonFind out the enriched GO biological processes and KEGG pathways involved in transition from healthy to precancer to cancer
check button Figure of enriched GO biological processes.
TissueDisease StageEnriched GO biological Processes
ColorectumADGO analysis - Figure of enriched GO biological processes: Top 15 enriched GO BP terms are showed in the bar plot of each disease state in each tissue. Each row represents a significant GO biological process which is colored according to the -log10(p.adjust).
ColorectumSERGO analysis - Figure of enriched GO biological processes: Top 15 enriched GO BP terms are showed in the bar plot of each disease state in each tissue. Each row represents a significant GO biological process which is colored according to the -log10(p.adjust).
ColorectumMSSGO analysis - Figure of enriched GO biological processes: Top 15 enriched GO BP terms are showed in the bar plot of each disease state in each tissue. Each row represents a significant GO biological process which is colored according to the -log10(p.adjust).
ColorectumMSI-HGO analysis - Figure of enriched GO biological processes: Top 15 enriched GO BP terms are showed in the bar plot of each disease state in each tissue. Each row represents a significant GO biological process which is colored according to the -log10(p.adjust).
ColorectumFAPGO analysis - Figure of enriched GO biological processes: Top 15 enriched GO BP terms are showed in the bar plot of each disease state in each tissue. Each row represents a significant GO biological process which is colored according to the -log10(p.adjust).
∗Top 15 enriched GO BP terms are showed in the bar plot of each disease state in each tissue. Each row represents a significant GO biological process which is colored according to the -log10(p.adjust).
Page: 1 2 3 4 5 6 7 8 9 

check button Enriched GO biological processes.
GO IDTissueDisease StageDescriptionGene RatioBg Ratiopvaluep.adjustCount
GO:0006839ColorectumADmitochondrial transport102/3918254/187231.87e-123.08e-10102
GO:1990542ColorectumADmitochondrial transmembrane transport47/3918102/187231.09e-086.52e-0747
GO:0006730ColorectumADone-carbon metabolic process18/391840/187235.36e-045.74e-0318
GO:19905423ColorectumFAPmitochondrial transmembrane transport29/2622102/187231.09e-041.80e-0329
GO:00068394ColorectumFAPmitochondrial transport55/2622254/187235.58e-046.24e-0355
GO:000683920EsophagusHGINmitochondrial transport74/2587254/187231.32e-101.32e-0874
GO:199054220EsophagusHGINmitochondrial transmembrane transport29/2587102/187238.52e-051.87e-0329
GO:0006839110EsophagusESCCmitochondrial transport187/8552254/187238.35e-209.81e-18187
GO:1990542110EsophagusESCCmitochondrial transmembrane transport72/8552102/187232.94e-074.23e-0672
GO:00068397LiverCirrhoticmitochondrial transport112/4634254/187231.03e-116.66e-10112
GO:19905425LiverCirrhoticmitochondrial transmembrane transport41/4634102/187234.08e-043.37e-0341
GO:00067303LiverCirrhoticone-carbon metabolic process17/463440/187231.04e-024.61e-0217
GO:000683912LiverHCCmitochondrial transport184/7958254/187232.30e-223.83e-20184
GO:199054212LiverHCCmitochondrial transmembrane transport78/7958102/187232.73e-121.26e-1078
GO:000683918Oral cavityOSCCmitochondrial transport162/7305254/187238.96e-166.52e-14162
GO:199054218Oral cavityOSCCmitochondrial transmembrane transport56/7305102/187238.06e-044.32e-0356
GO:0032329Oral cavityOSCCserine transport9/730511/187234.85e-031.92e-029
GO:000683927SkincSCCmitochondrial transport124/4864254/187233.54e-152.81e-13124
GO:199054224SkincSCCmitochondrial transmembrane transport43/4864102/187232.68e-042.16e-0343
GO:00067304SkincSCCone-carbon metabolic process18/486440/187237.10e-033.40e-0218
Page: 1 2 

check button Enriched KEGG pathways.
Pathway IDTissueDisease StageDescriptionGene RatioBg Ratiopvaluep.adjustqvalueCount
Page: 1 

Top

Cell-cell communication analysis

check buttonIdentification of potential cell-cell interactions between two cell types and their ligand-receptor pairs for different disease states
LigandReceptorLRpairPathwayTissueDisease Stage
Page: 1 

Top

Single-cell gene regulatory network inference analysis

check buttonFind out the significant the regulons (TFs) and the target genes of each regulon across cell types for different disease states
TFCell TypeTissueDisease StageTarget GeneRSSRegulon Activity
∗The dot plots of a searched regulon are shown for all cell subpopulations in each disease state of each tissue based on the regulon specific score inferred using pySCENIC and by calculating the average expression.
Page: 1 

Top

Somatic mutation of malignant transformation related genes

check buttonAnnotation of somatic variants for genes involved in malignant transformation
Hugo SymbolVariant ClassVariant ClassificationdbSNP RSHGVScHGVSpHGVSp ShortSWISSPROTBIOTYPESIFTPolyPhenTumor Sample BarcodeTissueHistologySexAgeStageTherapy TypesDrugsOutcome
SFXN1SNVMissense_Mutationnovelc.785G>Tp.Trp262Leup.W262LQ9H9B4protein_codingtolerated(0.2)benign(0.007)TCGA-AC-A5EH-01Breastbreast invasive carcinomaFemale>=65I/IIUnknownUnknownSD
SFXN1insertionIn_Frame_Insnovelc.939_940insGCATTGCCACAAATGGTTTTTCCAACAp.Leu313_Arg314insAlaLeuProGlnMetValPheProThrp.L313_R314insALPQMVFPTQ9H9B4protein_codingTCGA-BH-A0EE-01Breastbreast invasive carcinomaFemale>=65I/IIChemotherapydocetaxelSD
SFXN1SNVMissense_Mutationc.671N>Cp.Gln224Prop.Q224PQ9H9B4protein_codingtolerated(0.1)possibly_damaging(0.811)TCGA-EK-A2RN-01Cervixcervical & endocervical cancerFemale<65I/IIUnknownUnknownSD
SFXN1SNVMissense_Mutationc.158N>Gp.Asp53Glyp.D53GQ9H9B4protein_codingtolerated(0.23)benign(0.102)TCGA-A6-5665-01Colorectumcolon adenocarcinomaFemale>=65I/IIUnknownUnknownPD
SFXN1SNVMissense_Mutationrs374767128c.475N>Ap.Val159Ilep.V159IQ9H9B4protein_codingdeleterious(0.02)possibly_damaging(0.474)TCGA-AA-3811-01Colorectumcolon adenocarcinomaFemale>=65III/IVUnknownUnknownPD
SFXN1SNVMissense_Mutationrs374767128c.475N>Ap.Val159Ilep.V159IQ9H9B4protein_codingdeleterious(0.02)possibly_damaging(0.474)TCGA-EI-6509-01Colorectumrectum adenocarcinomaMale<65III/IVChemotherapyfolfoxPD
SFXN1SNVMissense_Mutationnovelc.738N>Ap.Phe246Leup.F246LQ9H9B4protein_codingtolerated(0.55)benign(0.006)TCGA-A5-A2K5-01Endometriumuterine corpus endometrioid carcinomaFemale>=65I/IIUnknownUnknownSD
SFXN1SNVMissense_Mutationnovelc.897N>Tp.Glu299Aspp.E299DQ9H9B4protein_codingdeleterious(0.02)probably_damaging(1)TCGA-AP-A051-01Endometriumuterine corpus endometrioid carcinomaFemale>=65I/IIUnknownUnknownSD
SFXN1SNVMissense_Mutationnovelc.74N>Tp.Ala25Valp.A25VQ9H9B4protein_codingtolerated(0.41)probably_damaging(0.938)TCGA-AP-A059-01Endometriumuterine corpus endometrioid carcinomaFemale>=65I/IIUnknownUnknownSD
SFXN1SNVMissense_Mutationnovelc.778N>Cp.Phe260Leup.F260LQ9H9B4protein_codingtolerated(0.49)benign(0.005)TCGA-AP-A05O-01Endometriumuterine corpus endometrioid carcinomaFemale>=65I/IIChemotherapycarboplatinPD
Page: 1 2 3 4 

Top

Related drugs of malignant transformation related genes

check buttonIdentification of chemicals and drugs interact with genes involved in malignant transfromation
(DGIdb 4.0)
Entrez IDSymbolCategoryInteraction TypesDrug Claim NameDrug NamePMIDs
Page: 1