
|
|||||
|
 | |
| |
| |
| |
| |
| |
|
Gene: SFTPC |
Gene summary for SFTPC |
| Gene information | Species | Human | Gene symbol | SFTPC | Gene ID | 6440 |
| Gene name | surfactant protein C | |
| Gene Alias | BRICD6 | |
| Cytomap | 8p21.3 | |
| Gene Type | protein-coding | GO ID | GO:0007585 | UniProtAcc | A0A0A0MTC9 |
Top |
Malignant transformation analysis |
| Identification of the aberrant gene expression in precancerous and cancerous lesions by comparing the gene expression of stem-like cells in diseased tissues with normal stem cells |
| Entrez ID | Symbol | Replicates | Species | Organ | Tissue | Adj P-value | Log2FC | Malignancy |
| 6440 | SFTPC | TD9 | Human | Lung | IAC | 1.81e-16 | -2.04e+00 | 0.088 |
| 6440 | SFTPC | RNA-P10T1-P10T1-1 | Human | Lung | AIS | 4.09e-08 | -5.97e-01 | -0.0764 |
| 6440 | SFTPC | RNA-P10T1-P10T1-2 | Human | Lung | AIS | 1.78e-04 | -5.56e-01 | -0.1028 |
| 6440 | SFTPC | RNA-P10T2-P10T2-1 | Human | Lung | AAH | 3.61e-04 | -2.42e-01 | -0.1271 |
| 6440 | SFTPC | RNA-P10T2-P10T2-2 | Human | Lung | AAH | 2.73e-05 | -2.70e-01 | -0.1406 |
| 6440 | SFTPC | RNA-P10T2-P10T2-3 | Human | Lung | AAH | 1.07e-03 | -2.88e-01 | -0.1408 |
| 6440 | SFTPC | RNA-P10T2-P10T2-4 | Human | Lung | AAH | 6.13e-05 | -2.73e-01 | -0.138 |
| 6440 | SFTPC | RNA-P17T-P17T-2 | Human | Lung | IAC | 1.36e-17 | -2.89e+00 | 0.3371 |
| 6440 | SFTPC | RNA-P17T-P17T-4 | Human | Lung | IAC | 3.02e-27 | -2.81e+00 | 0.343 |
| 6440 | SFTPC | RNA-P17T-P17T-6 | Human | Lung | IAC | 1.86e-16 | -2.89e+00 | 0.3385 |
| 6440 | SFTPC | RNA-P17T-P17T-8 | Human | Lung | IAC | 8.17e-20 | -2.89e+00 | 0.3329 |
| 6440 | SFTPC | RNA-P18T-P18T-2 | Human | Lung | IAC | 1.51e-17 | -2.64e+00 | 0.1129 |
| 6440 | SFTPC | RNA-P18T-P18T-4 | Human | Lung | IAC | 4.05e-10 | -2.38e+00 | 0.1024 |
| 6440 | SFTPC | RNA-P18T-P18T-6 | Human | Lung | IAC | 3.91e-17 | -2.26e+00 | 0.0856 |
| 6440 | SFTPC | RNA-P18T-P18T-8 | Human | Lung | IAC | 3.98e-16 | -2.61e+00 | 0.1151 |
| 6440 | SFTPC | RNA-P23T2-P23T2-1 | Human | Lung | MIAC | 7.75e-16 | -1.48e+00 | -0.037 |
| 6440 | SFTPC | RNA-P23T2-P23T2-2 | Human | Lung | MIAC | 1.16e-17 | -2.27e+00 | -0.028 |
| 6440 | SFTPC | RNA-P23T2-P23T2-4 | Human | Lung | MIAC | 6.78e-13 | -2.44e+00 | -0.0272 |
| 6440 | SFTPC | RNA-P24T2-P24T2-2 | Human | Lung | IAC | 1.02e-11 | -2.89e+00 | 0.0057 |
| 6440 | SFTPC | RNA-P25T1-P25T1-1 | Human | Lung | AIS | 3.94e-02 | -1.80e-01 | -0.2116 |
| Page: 1 2 3 |
| Tissue | Expression Dynamics | Abbreviation |
| Lung | 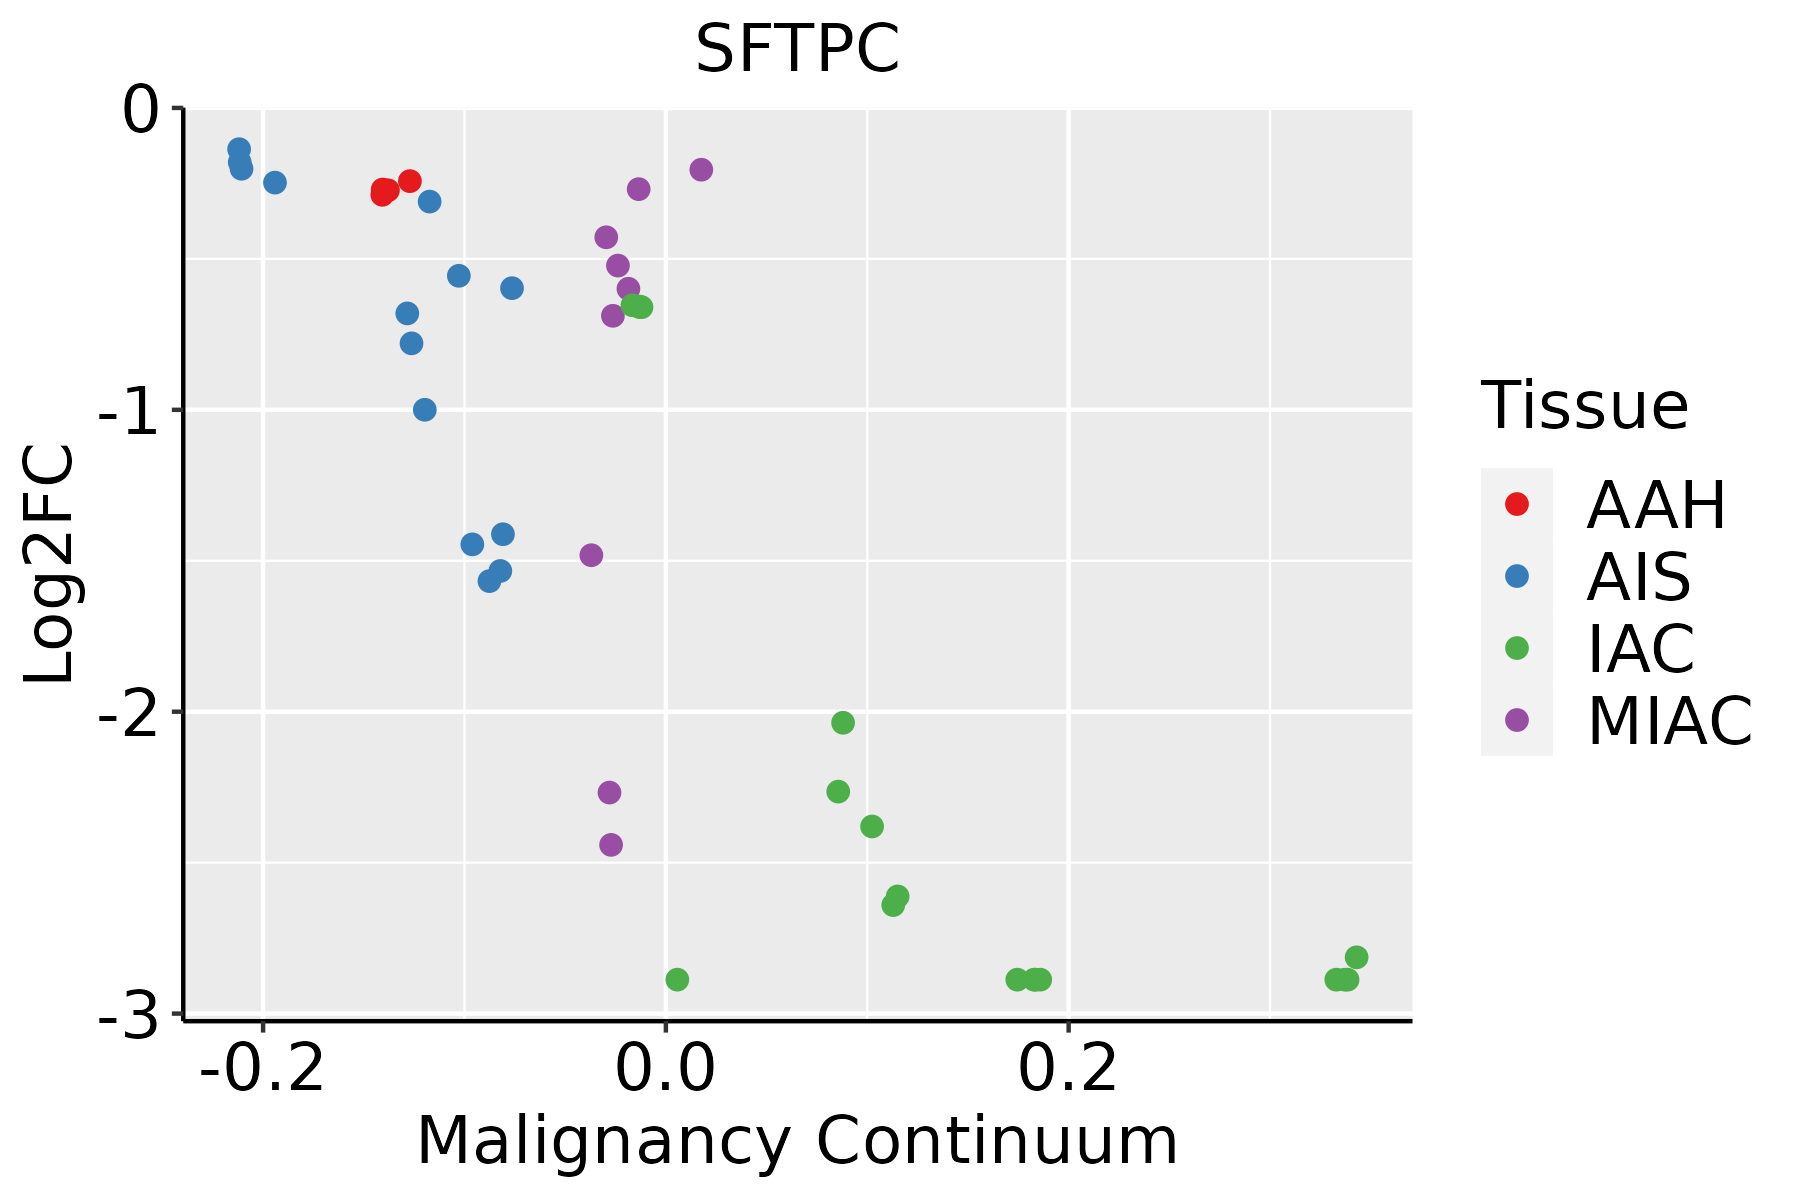 | AAH: Atypical adenomatous hyperplasia |
| AIS: Adenocarcinoma in situ | ||
| IAC: Invasive lung adenocarcinoma | ||
| MIA: Minimally invasive adenocarcinoma |
| ∗log2FC in expression of this searched gene in stem-like cells from each diseased tissue sample relative to stem-like cells in normal samples in each tissue plotted against the malignancy continuum. Samples are colored based on if they are from different disease stage. |
Top |
Malignant transformation related pathway analysis |
| Find out the enriched GO biological processes and KEGG pathways involved in transition from healthy to precancer to cancer |
| Tissue | Disease Stage | Enriched GO biological Processes |
| Colorectum | AD |  |
| Colorectum | SER |  |
| Colorectum | MSS |  |
| Colorectum | MSI-H |  |
| Colorectum | FAP |  |
| ∗Top 15 enriched GO BP terms are showed in the bar plot of each disease state in each tissue. Each row represents a significant GO biological process which is colored according to the -log10(p.adjust). |
| Page: 1 2 3 4 5 6 7 8 9 |
| GO ID | Tissue | Disease Stage | Description | Gene Ratio | Bg Ratio | pvalue | p.adjust | Count |
| GO:0007585 | Lung | IAC | respiratory gaseous exchange by respiratory system | 18/2061 | 68/18723 | 2.99e-04 | 4.82e-03 | 18 |
| GO:00075851 | Lung | AIS | respiratory gaseous exchange by respiratory system | 15/1849 | 68/18723 | 2.24e-03 | 2.38e-02 | 15 |
| GO:00075852 | Lung | AAH | respiratory gaseous exchange by respiratory system | 8/613 | 68/18723 | 1.65e-03 | 4.01e-02 | 8 |
| GO:00075853 | Lung | MIAC | respiratory gaseous exchange by respiratory system | 11/967 | 68/18723 | 6.76e-04 | 1.59e-02 | 11 |
| Page: 1 |
| Pathway ID | Tissue | Disease Stage | Description | Gene Ratio | Bg Ratio | pvalue | p.adjust | qvalue | Count |
| Page: 1 |
Top |
Cell-cell communication analysis |
| Identification of potential cell-cell interactions between two cell types and their ligand-receptor pairs for different disease states |
| Ligand | Receptor | LRpair | Pathway | Tissue | Disease Stage |
| Page: 1 |
Top |
Single-cell gene regulatory network inference analysis |
| Find out the significant the regulons (TFs) and the target genes of each regulon across cell types for different disease states |
| TF | Cell Type | Tissue | Disease Stage | Target Gene | RSS | Regulon Activity |
| ∗The dot plots of a searched regulon are shown for all cell subpopulations in each disease state of each tissue based on the regulon specific score inferred using pySCENIC and by calculating the average expression. |
| Page: 1 |
Top |
Somatic mutation of malignant transformation related genes |
| Annotation of somatic variants for genes involved in malignant transformation |
| Hugo Symbol | Variant Class | Variant Classification | dbSNP RS | HGVSc | HGVSp | HGVSp Short | SWISSPROT | BIOTYPE | SIFT | PolyPhen | Tumor Sample Barcode | Tissue | Histology | Sex | Age | Stage | Therapy Types | Drugs | Outcome |
| SFTPC | SNV | Missense_Mutation | novel | c.466N>A | p.Val156Met | p.V156M | P11686 | protein_coding | tolerated(0.44) | benign(0.005) | TCGA-2W-A8YY-01 | Cervix | cervical & endocervical cancer | Female | <65 | I/II | Chemotherapy | cisplatin | CR |
| SFTPC | SNV | Missense_Mutation | rs75902455 | c.68N>A | p.Arg23Gln | p.R23Q | P11686 | protein_coding | tolerated_low_confidence(0.24) | benign(0.08) | TCGA-CA-6717-01 | Colorectum | colon adenocarcinoma | Male | <65 | I/II | Chemotherapy | oxaliplatin | CR |
| SFTPC | SNV | Missense_Mutation | c.350N>G | p.Pro117Arg | p.P117R | P11686 | protein_coding | tolerated(0.77) | probably_damaging(0.956) | TCGA-G4-6314-01 | Colorectum | colon adenocarcinoma | Female | >=65 | III/IV | Ancillary | leucovorin | SD | |
| SFTPC | SNV | Missense_Mutation | c.224N>T | p.Ala75Val | p.A75V | P11686 | protein_coding | deleterious(0) | possibly_damaging(0.616) | TCGA-G4-6586-01 | Colorectum | colon adenocarcinoma | Female | >=65 | I/II | Unknown | Unknown | SD | |
| SFTPC | SNV | Missense_Mutation | rs199854076 | c.103C>T | p.Arg35Cys | p.R35C | P11686 | protein_coding | tolerated(0.15) | probably_damaging(0.997) | TCGA-A5-A0G2-01 | Endometrium | uterine corpus endometrioid carcinoma | Female | <65 | III/IV | Unknown | Unknown | SD |
| SFTPC | SNV | Missense_Mutation | novel | c.401T>G | p.Leu134Arg | p.L134R | P11686 | protein_coding | deleterious(0) | probably_damaging(0.991) | TCGA-A5-A0G2-01 | Endometrium | uterine corpus endometrioid carcinoma | Female | <65 | III/IV | Unknown | Unknown | SD |
| SFTPC | SNV | Missense_Mutation | novel | c.40N>T | p.Pro14Ser | p.P14S | P11686 | protein_coding | deleterious(0) | probably_damaging(0.969) | TCGA-AJ-A3NE-01 | Endometrium | uterine corpus endometrioid carcinoma | Female | <65 | I/II | Unknown | Unknown | SD |
| SFTPC | SNV | Missense_Mutation | c.502N>T | p.Asp168Tyr | p.D168Y | P11686 | protein_coding | deleterious(0.01) | benign(0.381) | TCGA-AP-A0LM-01 | Endometrium | uterine corpus endometrioid carcinoma | Female | <65 | III/IV | Chemotherapy | cisplatin | SD | |
| SFTPC | SNV | Missense_Mutation | rs777139008 | c.77N>C | p.Ile26Thr | p.I26T | P11686 | protein_coding | deleterious(0) | probably_damaging(0.976) | TCGA-D1-A175-01 | Endometrium | uterine corpus endometrioid carcinoma | Female | <65 | I/II | Chemotherapy | paclitaxel | SD |
| SFTPC | deletion | Frame_Shift_Del | novel | c.362_405delNNNNNNNNNNNNNNNNNNNNNNNNNNNNNNNNNNNNNNNNNNNN | p.Tyr122SerfsTer3 | p.Y122Sfs*3 | P11686 | protein_coding | TCGA-UB-A7MB-01 | Liver | liver hepatocellular carcinoma | Male | <65 | I/II | Targeted Molecular therapy | sorafenib | PD |
| Page: 1 2 |
Top |
Related drugs of malignant transformation related genes |
| Identification of chemicals and drugs interact with genes involved in malignant transfromation |
| (DGIdb 4.0) |
| Entrez ID | Symbol | Category | Interaction Types | Drug Claim Name | Drug Name | PMIDs |
| Page: 1 |

Copyright 2023-Present -The University of Texas Health Science Center at Houston |