
|
|||||
|
 | |
| |
| |
| |
| |
| |
|
Gene: SFTPB |
Gene summary for SFTPB |
| Gene information | Species | Human | Gene symbol | SFTPB | Gene ID | 6439 |
| Gene name | surfactant protein B | |
| Gene Alias | PSP-B | |
| Cytomap | 2p11.2 | |
| Gene Type | protein-coding | GO ID | GO:0006629 | UniProtAcc | D6W5L6 |
Top |
Malignant transformation analysis |
| Identification of the aberrant gene expression in precancerous and cancerous lesions by comparing the gene expression of stem-like cells in diseased tissues with normal stem cells |
| Entrez ID | Symbol | Replicates | Species | Organ | Tissue | Adj P-value | Log2FC | Malignancy |
| 6439 | SFTPB | HCC1 | Human | Liver | HCC | 3.12e-03 | 5.51e-01 | 0.5336 |
| 6439 | SFTPB | HCC2 | Human | Liver | HCC | 7.17e-15 | 1.12e+00 | 0.5341 |
| 6439 | SFTPB | HCC5 | Human | Liver | HCC | 9.51e-14 | 6.82e-01 | 0.4932 |
| 6439 | SFTPB | TD9 | Human | Lung | IAC | 3.80e-18 | -3.26e-01 | 0.088 |
| 6439 | SFTPB | RNA-P10T2-P10T2-1 | Human | Lung | AAH | 6.03e-04 | -1.49e-01 | -0.1271 |
| 6439 | SFTPB | RNA-P10T2-P10T2-2 | Human | Lung | AAH | 2.83e-03 | -1.41e-01 | -0.1406 |
| 6439 | SFTPB | RNA-P17T-P17T-2 | Human | Lung | IAC | 1.08e-36 | -2.60e+00 | 0.3371 |
| 6439 | SFTPB | RNA-P17T-P17T-4 | Human | Lung | IAC | 6.26e-37 | -2.35e+00 | 0.343 |
| 6439 | SFTPB | RNA-P17T-P17T-6 | Human | Lung | IAC | 3.94e-46 | -2.25e+00 | 0.3385 |
| 6439 | SFTPB | RNA-P17T-P17T-8 | Human | Lung | IAC | 1.43e-28 | -2.26e+00 | 0.3329 |
| 6439 | SFTPB | RNA-P18T-P18T-2 | Human | Lung | IAC | 2.11e-13 | -4.58e-01 | 0.1129 |
| 6439 | SFTPB | RNA-P18T-P18T-4 | Human | Lung | IAC | 1.24e-08 | -3.91e-01 | 0.1024 |
| 6439 | SFTPB | RNA-P18T-P18T-6 | Human | Lung | IAC | 1.57e-11 | -3.21e-01 | 0.0856 |
| 6439 | SFTPB | RNA-P18T-P18T-8 | Human | Lung | IAC | 1.06e-05 | -2.47e-01 | 0.1151 |
| 6439 | SFTPB | RNA-P23T2-P23T2-1 | Human | Lung | MIAC | 3.10e-10 | -2.44e-01 | -0.037 |
| 6439 | SFTPB | RNA-P23T2-P23T2-2 | Human | Lung | MIAC | 9.48e-09 | -1.94e-01 | -0.028 |
| 6439 | SFTPB | RNA-P23T2-P23T2-4 | Human | Lung | MIAC | 1.32e-09 | -2.43e-01 | -0.0272 |
| 6439 | SFTPB | RNA-P24T2-P24T2-2 | Human | Lung | IAC | 2.54e-23 | -5.89e-01 | 0.0057 |
| 6439 | SFTPB | RNA-P25T1-P25T1-1 | Human | Lung | AIS | 5.25e-19 | -2.15e-01 | -0.2116 |
| 6439 | SFTPB | RNA-P25T1-P25T1-2 | Human | Lung | AIS | 7.16e-13 | -2.63e-01 | -0.1941 |
| Page: 1 2 3 |
| Tissue | Expression Dynamics | Abbreviation |
| Liver |  | HCC: Hepatocellular carcinoma |
| NAFLD: Non-alcoholic fatty liver disease | ||
| Lung | 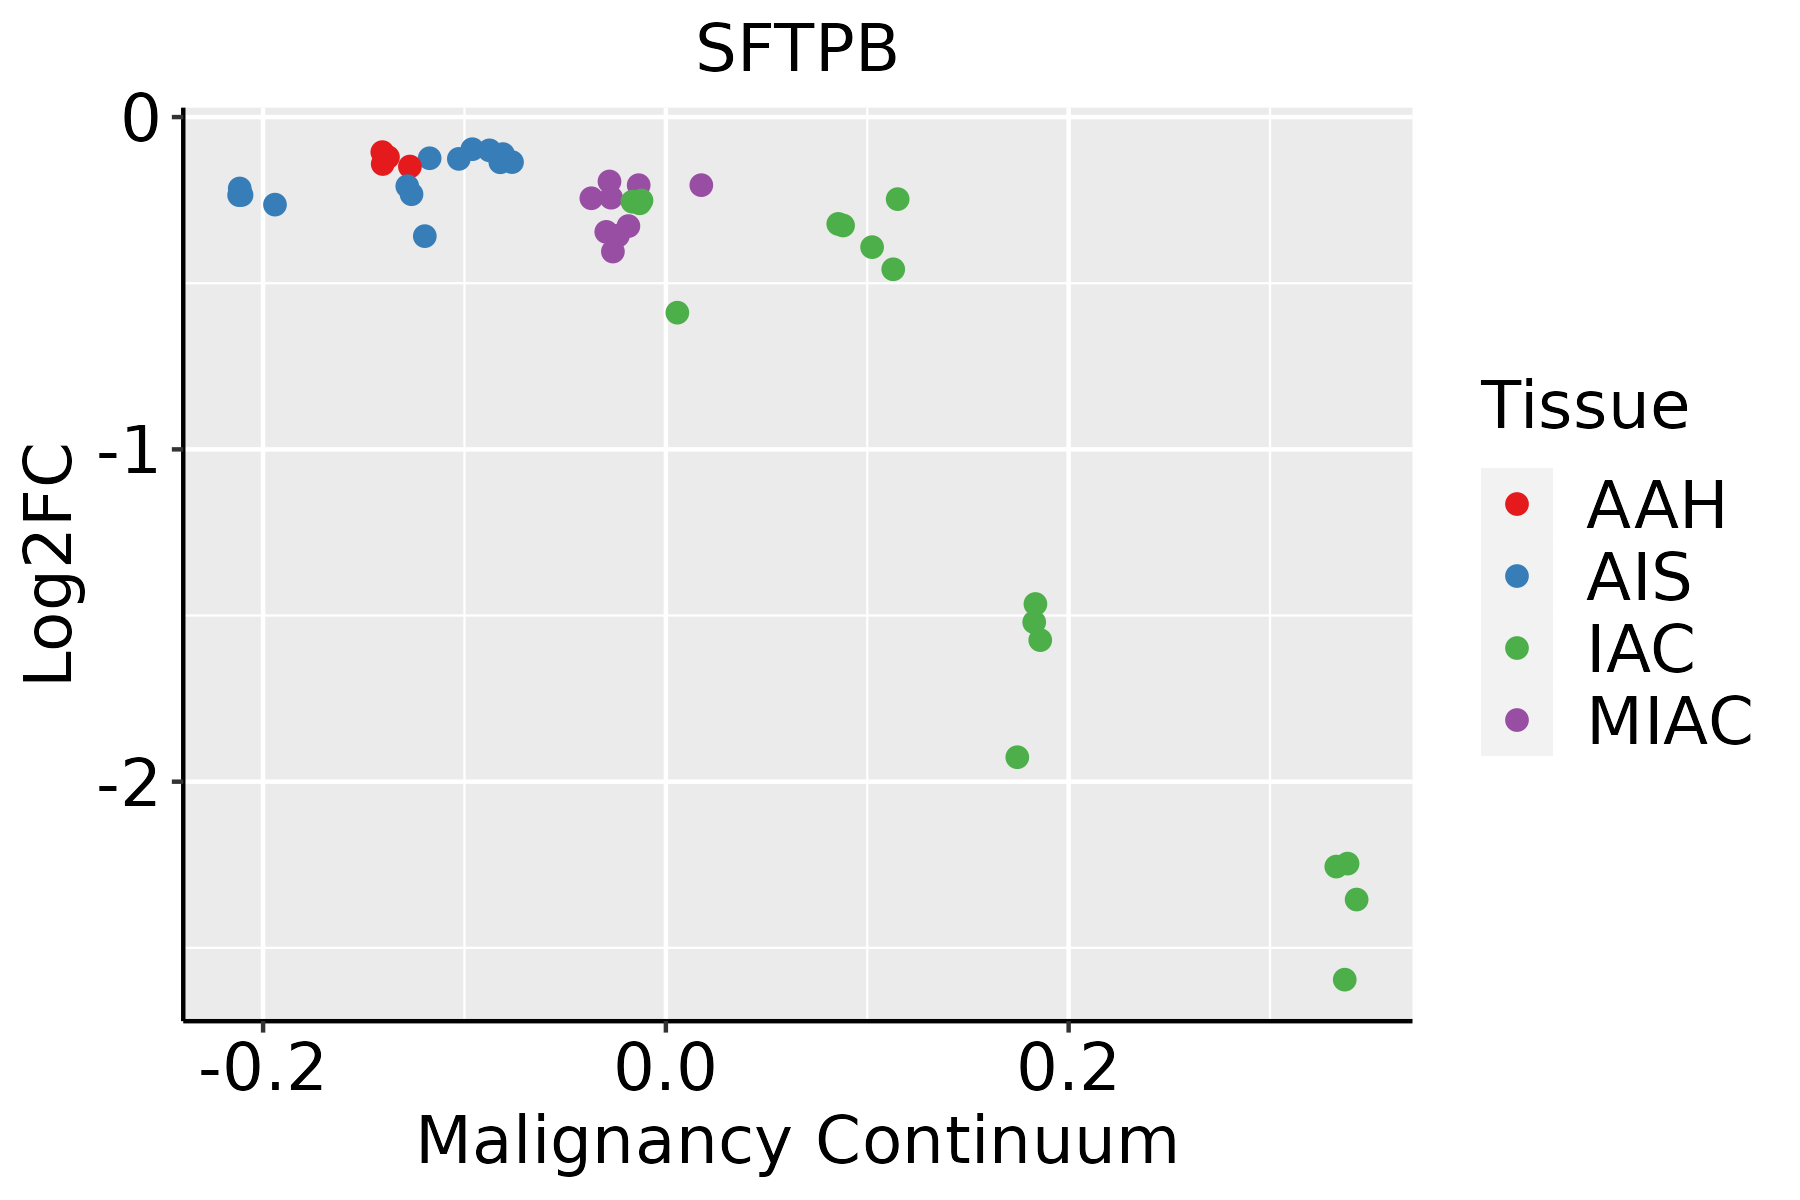 | AAH: Atypical adenomatous hyperplasia |
| AIS: Adenocarcinoma in situ | ||
| IAC: Invasive lung adenocarcinoma | ||
| MIA: Minimally invasive adenocarcinoma | ||
| Thyroid |  | ATC: Anaplastic thyroid cancer |
| HT: Hashimoto's thyroiditis | ||
| PTC: Papillary thyroid cancer |
| ∗log2FC in expression of this searched gene in stem-like cells from each diseased tissue sample relative to stem-like cells in normal samples in each tissue plotted against the malignancy continuum. Samples are colored based on if they are from different disease stage. |
Top |
Malignant transformation related pathway analysis |
| Find out the enriched GO biological processes and KEGG pathways involved in transition from healthy to precancer to cancer |
| Tissue | Disease Stage | Enriched GO biological Processes |
| Colorectum | AD |  |
| Colorectum | SER |  |
| Colorectum | MSS |  |
| Colorectum | MSI-H |  |
| Colorectum | FAP |  |
| ∗Top 15 enriched GO BP terms are showed in the bar plot of each disease state in each tissue. Each row represents a significant GO biological process which is colored according to the -log10(p.adjust). |
| Page: 1 2 3 4 5 6 7 8 9 |
| GO ID | Tissue | Disease Stage | Description | Gene Ratio | Bg Ratio | pvalue | p.adjust | Count |
| GO:00066431 | Liver | HCC | membrane lipid metabolic process | 115/7958 | 203/18723 | 3.17e-05 | 3.22e-04 | 115 |
| GO:0006665 | Liver | HCC | sphingolipid metabolic process | 85/7958 | 155/18723 | 1.27e-03 | 6.92e-03 | 85 |
| GO:0007585 | Lung | IAC | respiratory gaseous exchange by respiratory system | 18/2061 | 68/18723 | 2.99e-04 | 4.82e-03 | 18 |
| GO:00075851 | Lung | AIS | respiratory gaseous exchange by respiratory system | 15/1849 | 68/18723 | 2.24e-03 | 2.38e-02 | 15 |
| GO:00075852 | Lung | AAH | respiratory gaseous exchange by respiratory system | 8/613 | 68/18723 | 1.65e-03 | 4.01e-02 | 8 |
| GO:00075853 | Lung | MIAC | respiratory gaseous exchange by respiratory system | 11/967 | 68/18723 | 6.76e-04 | 1.59e-02 | 11 |
| Page: 1 |
| Pathway ID | Tissue | Disease Stage | Description | Gene Ratio | Bg Ratio | pvalue | p.adjust | qvalue | Count |
| Page: 1 |
Top |
Cell-cell communication analysis |
| Identification of potential cell-cell interactions between two cell types and their ligand-receptor pairs for different disease states |
| Ligand | Receptor | LRpair | Pathway | Tissue | Disease Stage |
| Page: 1 |
Top |
Single-cell gene regulatory network inference analysis |
| Find out the significant the regulons (TFs) and the target genes of each regulon across cell types for different disease states |
| TF | Cell Type | Tissue | Disease Stage | Target Gene | RSS | Regulon Activity |
| ∗The dot plots of a searched regulon are shown for all cell subpopulations in each disease state of each tissue based on the regulon specific score inferred using pySCENIC and by calculating the average expression. |
| Page: 1 |
Top |
Somatic mutation of malignant transformation related genes |
| Annotation of somatic variants for genes involved in malignant transformation |
| Hugo Symbol | Variant Class | Variant Classification | dbSNP RS | HGVSc | HGVSp | HGVSp Short | SWISSPROT | BIOTYPE | SIFT | PolyPhen | Tumor Sample Barcode | Tissue | Histology | Sex | Age | Stage | Therapy Types | Drugs | Outcome |
| SFTPB | SNV | Missense_Mutation | rs370785493 | c.1174N>A | p.Asp392Asn | p.D392N | protein_coding | tolerated_low_confidence(0.43) | benign(0.174) | TCGA-AN-A046-01 | Breast | breast invasive carcinoma | Female | >=65 | I/II | Unknown | Unknown | SD | |
| SFTPB | SNV | Missense_Mutation | c.109N>C | p.Trp37Arg | p.W37R | protein_coding | tolerated(0.83) | benign(0) | TCGA-D8-A1XK-01 | Breast | breast invasive carcinoma | Female | <65 | I/II | Chemotherapy | doxorubicine+cyclophosphamide | SD | ||
| SFTPB | SNV | Missense_Mutation | c.385G>C | p.Asp129His | p.D129H | protein_coding | deleterious(0.02) | probably_damaging(0.954) | TCGA-E2-A159-01 | Breast | breast invasive carcinoma | Female | <65 | I/II | Chemotherapy | cyclophosphamide | SD | ||
| SFTPB | insertion | Nonsense_Mutation | novel | c.1149_1150insACAGTCTGACACCAGAGCCCACTTCCAT | p.Pro384ThrfsTer3 | p.P384Tfs*3 | protein_coding | TCGA-AN-A0FX-01 | Breast | breast invasive carcinoma | Female | <65 | I/II | Unknown | Unknown | SD | |||
| SFTPB | deletion | Frame_Shift_Del | novel | c.958delC | p.Gln320ArgfsTer40 | p.Q320Rfs*40 | protein_coding | TCGA-D8-A27V-01 | Breast | breast invasive carcinoma | Female | <65 | I/II | Hormone Therapy | tamoxiphen | SD | |||
| SFTPB | SNV | Missense_Mutation | c.887N>T | p.Gly296Val | p.G296V | protein_coding | tolerated(0.08) | benign(0.235) | TCGA-A6-5661-01 | Colorectum | colon adenocarcinoma | Female | >=65 | I/II | Unknown | Unknown | SD | ||
| SFTPB | SNV | Missense_Mutation | rs370715446 | c.529N>T | p.Arg177Trp | p.R177W | protein_coding | deleterious(0.02) | benign(0) | TCGA-AA-3681-01 | Colorectum | colon adenocarcinoma | Female | >=65 | III/IV | Unknown | Unknown | SD | |
| SFTPB | SNV | Missense_Mutation | c.455T>G | p.Leu152Arg | p.L152R | protein_coding | deleterious(0) | probably_damaging(0.965) | TCGA-AD-A5EJ-01 | Colorectum | colon adenocarcinoma | Female | >=65 | I/II | Unknown | Unknown | SD | ||
| SFTPB | SNV | Missense_Mutation | c.671N>T | p.Arg224Met | p.R224M | protein_coding | deleterious(0) | possibly_damaging(0.599) | TCGA-G4-6628-01 | Colorectum | colon adenocarcinoma | Male | >=65 | I/II | Unknown | Unknown | SD | ||
| SFTPB | SNV | Missense_Mutation | rs138274558 | c.580N>T | p.Pro194Ser | p.P194S | protein_coding | deleterious(0.03) | possibly_damaging(0.587) | TCGA-AG-A002-01 | Colorectum | rectum adenocarcinoma | Male | <65 | I/II | Unknown | Unknown | SD |
| Page: 1 2 3 4 |
Top |
Related drugs of malignant transformation related genes |
| Identification of chemicals and drugs interact with genes involved in malignant transfromation |
| (DGIdb 4.0) |
| Entrez ID | Symbol | Category | Interaction Types | Drug Claim Name | Drug Name | PMIDs |
| 6439 | SFTPB | DRUGGABLE GENOME | STZ | STREPTOZOCIN | 1386745 |
| Page: 1 |

Copyright 2023-Present -The University of Texas Health Science Center at Houston |