
|
|||||
|
 | |
| |
| |
| |
| |
| |
|
Gene: SFTPA1 |
Gene summary for SFTPA1 |
| Gene information | Species | Human | Gene symbol | SFTPA1 | Gene ID | 653509 |
| Gene name | surfactant protein A1 | |
| Gene Alias | COLEC4 | |
| Cytomap | 10q22.3 | |
| Gene Type | protein-coding | GO ID | GO:0002252 | UniProtAcc | Q8IWL2 |
Top |
Malignant transformation analysis |
| Identification of the aberrant gene expression in precancerous and cancerous lesions by comparing the gene expression of stem-like cells in diseased tissues with normal stem cells |
| Entrez ID | Symbol | Replicates | Species | Organ | Tissue | Adj P-value | Log2FC | Malignancy |
| 653509 | SFTPA1 | TD9 | Human | Lung | IAC | 2.44e-11 | -1.30e+00 | 0.088 |
| 653509 | SFTPA1 | RNA-P10T1-P10T1-2 | Human | Lung | AIS | 1.88e-03 | -1.41e+00 | -0.1028 |
| 653509 | SFTPA1 | RNA-P10T1-P10T1-4 | Human | Lung | AIS | 8.34e-03 | -1.30e+00 | -0.1173 |
| 653509 | SFTPA1 | RNA-P10T2-P10T2-1 | Human | Lung | AAH | 1.73e-05 | -8.42e-01 | -0.1271 |
| 653509 | SFTPA1 | RNA-P10T2-P10T2-2 | Human | Lung | AAH | 4.80e-11 | -8.39e-01 | -0.1406 |
| 653509 | SFTPA1 | RNA-P10T2-P10T2-3 | Human | Lung | AAH | 3.14e-11 | -7.01e-01 | -0.1408 |
| 653509 | SFTPA1 | RNA-P10T2-P10T2-4 | Human | Lung | AAH | 2.76e-08 | -8.89e-01 | -0.138 |
| 653509 | SFTPA1 | RNA-P17T-P17T-2 | Human | Lung | IAC | 1.36e-09 | -2.27e+00 | 0.3371 |
| 653509 | SFTPA1 | RNA-P17T-P17T-4 | Human | Lung | IAC | 7.97e-10 | -2.46e+00 | 0.343 |
| 653509 | SFTPA1 | RNA-P17T-P17T-6 | Human | Lung | IAC | 7.97e-10 | -2.46e+00 | 0.3385 |
| 653509 | SFTPA1 | RNA-P17T-P17T-8 | Human | Lung | IAC | 3.05e-12 | -2.46e+00 | 0.3329 |
| 653509 | SFTPA1 | RNA-P18T-P18T-2 | Human | Lung | IAC | 1.60e-07 | -2.30e+00 | 0.1129 |
| 653509 | SFTPA1 | RNA-P18T-P18T-4 | Human | Lung | IAC | 1.31e-05 | -2.18e+00 | 0.1024 |
| 653509 | SFTPA1 | RNA-P18T-P18T-6 | Human | Lung | IAC | 1.01e-08 | -1.88e+00 | 0.0856 |
| 653509 | SFTPA1 | RNA-P18T-P18T-8 | Human | Lung | IAC | 3.56e-06 | -2.26e+00 | 0.1151 |
| 653509 | SFTPA1 | RNA-P23T2-P23T2-1 | Human | Lung | MIAC | 2.91e-06 | -1.35e+00 | -0.037 |
| 653509 | SFTPA1 | RNA-P23T2-P23T2-2 | Human | Lung | MIAC | 1.63e-09 | -1.32e+00 | -0.028 |
| 653509 | SFTPA1 | RNA-P23T2-P23T2-4 | Human | Lung | MIAC | 1.23e-06 | -1.95e+00 | -0.0272 |
| 653509 | SFTPA1 | RNA-P24T2-P24T2-2 | Human | Lung | IAC | 1.74e-06 | -2.46e+00 | 0.0057 |
| 653509 | SFTPA1 | RNA-P25T1-P25T1-1 | Human | Lung | AIS | 2.84e-03 | -2.45e-01 | -0.2116 |
| Page: 1 2 3 |
| Tissue | Expression Dynamics | Abbreviation |
| Lung | 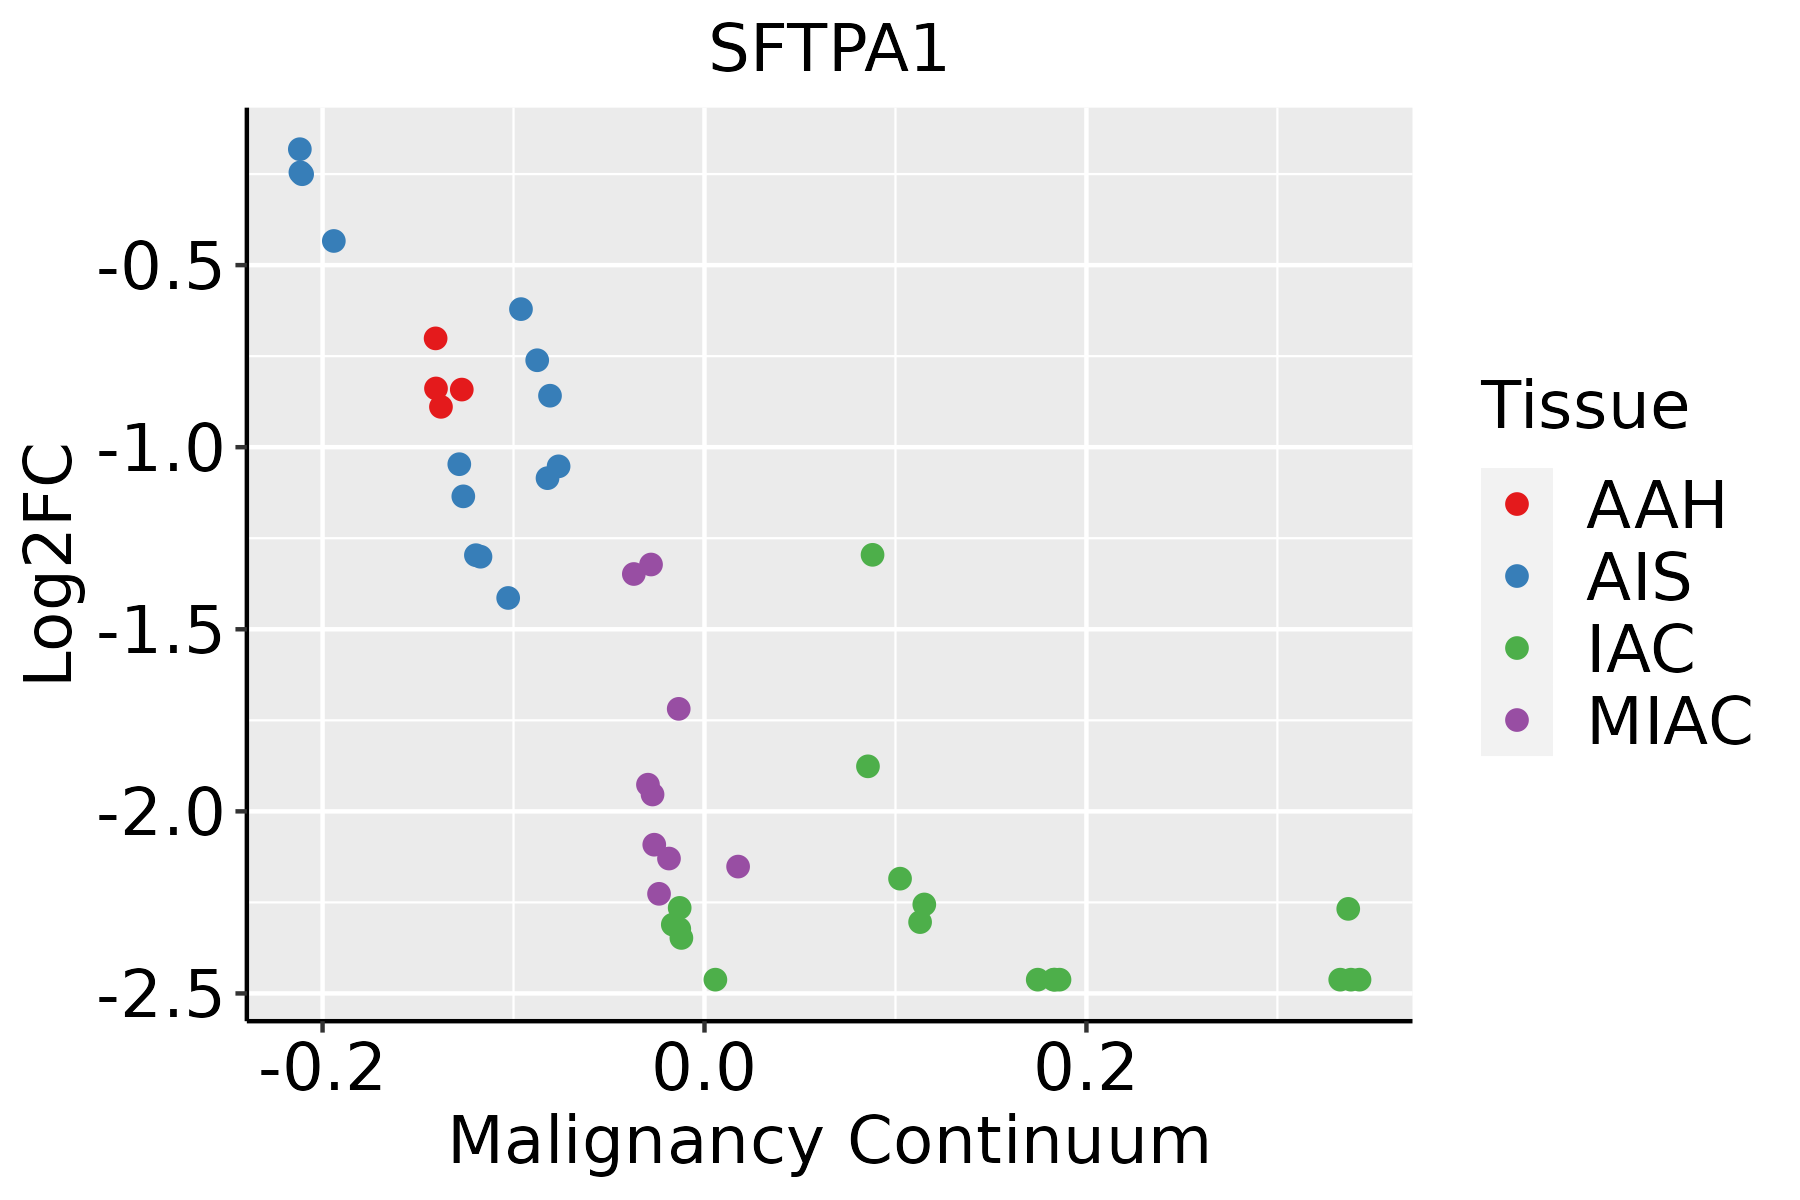 | AAH: Atypical adenomatous hyperplasia |
| AIS: Adenocarcinoma in situ | ||
| IAC: Invasive lung adenocarcinoma | ||
| MIA: Minimally invasive adenocarcinoma |
| ∗log2FC in expression of this searched gene in stem-like cells from each diseased tissue sample relative to stem-like cells in normal samples in each tissue plotted against the malignancy continuum. Samples are colored based on if they are from different disease stage. |
Top |
Malignant transformation related pathway analysis |
| Find out the enriched GO biological processes and KEGG pathways involved in transition from healthy to precancer to cancer |
| Tissue | Disease Stage | Enriched GO biological Processes |
| Colorectum | AD |  |
| Colorectum | SER |  |
| Colorectum | MSS |  |
| Colorectum | MSI-H |  |
| Colorectum | FAP |  |
| ∗Top 15 enriched GO BP terms are showed in the bar plot of each disease state in each tissue. Each row represents a significant GO biological process which is colored according to the -log10(p.adjust). |
| Page: 1 2 3 4 5 6 7 8 9 |
| GO ID | Tissue | Disease Stage | Description | Gene Ratio | Bg Ratio | pvalue | p.adjust | Count |
| GO:0007585 | Lung | IAC | respiratory gaseous exchange by respiratory system | 18/2061 | 68/18723 | 2.99e-04 | 4.82e-03 | 18 |
| GO:00075851 | Lung | AIS | respiratory gaseous exchange by respiratory system | 15/1849 | 68/18723 | 2.24e-03 | 2.38e-02 | 15 |
| GO:00075852 | Lung | AAH | respiratory gaseous exchange by respiratory system | 8/613 | 68/18723 | 1.65e-03 | 4.01e-02 | 8 |
| GO:00075853 | Lung | MIAC | respiratory gaseous exchange by respiratory system | 11/967 | 68/18723 | 6.76e-04 | 1.59e-02 | 11 |
| Page: 1 |
| Pathway ID | Tissue | Disease Stage | Description | Gene Ratio | Bg Ratio | pvalue | p.adjust | qvalue | Count |
| hsa0414516 | Lung | MIAC | Phagosome | 18/507 | 152/8465 | 4.17e-03 | 3.28e-02 | 2.37e-02 | 18 |
| hsa0414517 | Lung | MIAC | Phagosome | 18/507 | 152/8465 | 4.17e-03 | 3.28e-02 | 2.37e-02 | 18 |
| Page: 1 |
Top |
Cell-cell communication analysis |
| Identification of potential cell-cell interactions between two cell types and their ligand-receptor pairs for different disease states |
| Ligand | Receptor | LRpair | Pathway | Tissue | Disease Stage |
| Page: 1 |
Top |
Single-cell gene regulatory network inference analysis |
| Find out the significant the regulons (TFs) and the target genes of each regulon across cell types for different disease states |
| TF | Cell Type | Tissue | Disease Stage | Target Gene | RSS | Regulon Activity |
| ∗The dot plots of a searched regulon are shown for all cell subpopulations in each disease state of each tissue based on the regulon specific score inferred using pySCENIC and by calculating the average expression. |
| Page: 1 |
Top |
Somatic mutation of malignant transformation related genes |
| Annotation of somatic variants for genes involved in malignant transformation |
| Hugo Symbol | Variant Class | Variant Classification | dbSNP RS | HGVSc | HGVSp | HGVSp Short | SWISSPROT | BIOTYPE | SIFT | PolyPhen | Tumor Sample Barcode | Tissue | Histology | Sex | Age | Stage | Therapy Types | Drugs | Outcome |
| SFTPA1 | SNV | Missense_Mutation | rs771689192 | c.641N>A | p.Arg214His | p.R214H | Q8IWL2 | protein_coding | tolerated(0.82) | benign(0.003) | TCGA-E2-A9RU-01 | Breast | breast invasive carcinoma | Female | >=65 | III/IV | Hormone Therapy | arimidex | SD |
| SFTPA1 | deletion | Frame_Shift_Del | novel | c.433delT | p.Ser145ProfsTer2 | p.S145Pfs*2 | Q8IWL2 | protein_coding | TCGA-D8-A27V-01 | Breast | breast invasive carcinoma | Female | <65 | I/II | Hormone Therapy | tamoxiphen | SD | ||
| SFTPA1 | SNV | Missense_Mutation | novel | c.394C>G | p.Gln132Glu | p.Q132E | Q8IWL2 | protein_coding | tolerated(0.14) | benign(0.031) | TCGA-C5-A7CK-01 | Cervix | cervical & endocervical cancer | Female | <65 | I/II | Chemotherapy | cisplatin | SD |
| SFTPA1 | SNV | Missense_Mutation | c.586N>G | p.Tyr196Asp | p.Y196D | Q8IWL2 | protein_coding | deleterious(0) | benign(0.311) | TCGA-AA-A01K-01 | Colorectum | colon adenocarcinoma | Female | >=65 | III/IV | Chemotherapy | folinic | CR | |
| SFTPA1 | SNV | Missense_Mutation | c.758N>A | p.Cys253Tyr | p.C253Y | Q8IWL2 | protein_coding | deleterious(0) | probably_damaging(1) | TCGA-AZ-4313-01 | Colorectum | colon adenocarcinoma | Female | <65 | I/II | Unknown | Unknown | SD | |
| SFTPA1 | SNV | Missense_Mutation | rs876658000 | c.694N>A | p.Ala232Thr | p.A232T | Q8IWL2 | protein_coding | tolerated(0.15) | benign(0.2) | TCGA-CM-6171-01 | Colorectum | colon adenocarcinoma | Female | >=65 | I/II | Unknown | Unknown | SD |
| SFTPA1 | SNV | Missense_Mutation | novel | c.585N>T | p.Lys195Asn | p.K195N | Q8IWL2 | protein_coding | tolerated(0.13) | benign(0.034) | TCGA-A5-A0G1-01 | Endometrium | uterine corpus endometrioid carcinoma | Female | >=65 | I/II | Unknown | Unknown | SD |
| SFTPA1 | SNV | Missense_Mutation | rs564713521 | c.640N>T | p.Arg214Cys | p.R214C | Q8IWL2 | protein_coding | tolerated(0.12) | possibly_damaging(0.784) | TCGA-A5-A0VP-01 | Endometrium | uterine corpus endometrioid carcinoma | Female | >=65 | I/II | Unknown | Unknown | SD |
| SFTPA1 | SNV | Missense_Mutation | novel | c.775N>G | p.Thr259Ala | p.T259A | Q8IWL2 | protein_coding | tolerated(0.55) | benign(0.013) | TCGA-AP-A051-01 | Endometrium | uterine corpus endometrioid carcinoma | Female | >=65 | I/II | Unknown | Unknown | SD |
| SFTPA1 | SNV | Missense_Mutation | c.226N>A | p.Gly76Ser | p.G76S | Q8IWL2 | protein_coding | deleterious(0.01) | probably_damaging(1) | TCGA-AP-A059-01 | Endometrium | uterine corpus endometrioid carcinoma | Female | >=65 | I/II | Unknown | Unknown | SD |
| Page: 1 2 3 4 |
Top |
Related drugs of malignant transformation related genes |
| Identification of chemicals and drugs interact with genes involved in malignant transfromation |
| (DGIdb 4.0) |
| Entrez ID | Symbol | Category | Interaction Types | Drug Claim Name | Drug Name | PMIDs |
| 653509 | SFTPA1 | DRUGGABLE GENOME | IL-1RA | ANAKINRA | 8996657 | |
| 653509 | SFTPA1 | DRUGGABLE GENOME | DEXAMETHASONE | DEXAMETHASONE | 9486201,2015097,10781428,8969273,3194412,8906664,3382698,12538780,2610267,2014154,8572233 | |
| 653509 | SFTPA1 | DRUGGABLE GENOME | PMA | 8810290 | ||
| 653509 | SFTPA1 | DRUGGABLE GENOME | RECOMBINANT HUMAN KERATINOCYTE GROWTH FACTOR | 12740217 | ||
| 653509 | SFTPA1 | DRUGGABLE GENOME | AMIODARONE | AMIODARONE | 11597911 | |
| 653509 | SFTPA1 | DRUGGABLE GENOME | HEPARIN | HEPARIN | 7980398 | |
| 653509 | SFTPA1 | DRUGGABLE GENOME | RETINYL PALMITATE | 8023960 | ||
| 653509 | SFTPA1 | DRUGGABLE GENOME | 9-CIS-RETINOIC ACID | 8944731 | ||
| 653509 | SFTPA1 | DRUGGABLE GENOME | ALBUMIN | ALBUMIN HUMAN | 1314502 | |
| 653509 | SFTPA1 | DRUGGABLE GENOME | CORTISOL | HYDROCORTISONE | 9575874 |
| Page: 1 2 |

Copyright 2023-Present -The University of Texas Health Science Center at Houston |