
|
|||||
|
 | |
| |
| |
| |
| |
| |
|
Gene: SFT2D1 |
Gene summary for SFT2D1 |
| Gene information | Species | Human | Gene symbol | SFT2D1 | Gene ID | 113402 |
| Gene name | SFT2 domain containing 1 | |
| Gene Alias | C6orf83 | |
| Cytomap | 6q27 | |
| Gene Type | protein-coding | GO ID | GO:0006810 | UniProtAcc | Q8WV19 |
Top |
Malignant transformation analysis |
| Identification of the aberrant gene expression in precancerous and cancerous lesions by comparing the gene expression of stem-like cells in diseased tissues with normal stem cells |
| Entrez ID | Symbol | Replicates | Species | Organ | Tissue | Adj P-value | Log2FC | Malignancy |
| 113402 | SFT2D1 | HTA11_347_2000001011 | Human | Colorectum | AD | 1.21e-03 | 3.15e-01 | -0.1954 |
| 113402 | SFT2D1 | HTA11_99999970781_79442 | Human | Colorectum | MSS | 1.44e-03 | 3.64e-01 | 0.294 |
| 113402 | SFT2D1 | HTA11_99999965104_69814 | Human | Colorectum | MSS | 5.44e-06 | 4.90e-01 | 0.281 |
| 113402 | SFT2D1 | A015-C-203 | Human | Colorectum | FAP | 1.57e-04 | -1.89e-01 | -0.1294 |
| 113402 | SFT2D1 | A002-C-201 | Human | Colorectum | FAP | 4.59e-02 | -1.06e-01 | 0.0324 |
| 113402 | SFT2D1 | A002-C-205 | Human | Colorectum | FAP | 1.69e-04 | -1.57e-01 | -0.1236 |
| 113402 | SFT2D1 | A015-C-006 | Human | Colorectum | FAP | 4.77e-03 | -2.13e-01 | -0.0994 |
| 113402 | SFT2D1 | A015-C-106 | Human | Colorectum | FAP | 1.39e-02 | -1.28e-01 | -0.0511 |
| 113402 | SFT2D1 | A002-C-114 | Human | Colorectum | FAP | 1.62e-03 | -1.78e-01 | -0.1561 |
| 113402 | SFT2D1 | A015-C-104 | Human | Colorectum | FAP | 1.55e-04 | -1.65e-01 | -0.1899 |
| 113402 | SFT2D1 | A001-C-014 | Human | Colorectum | FAP | 1.42e-02 | -1.68e-01 | 0.0135 |
| 113402 | SFT2D1 | A002-C-116 | Human | Colorectum | FAP | 2.29e-03 | -1.33e-01 | -0.0452 |
| 113402 | SFT2D1 | A018-E-020 | Human | Colorectum | FAP | 3.87e-03 | -1.32e-01 | -0.2034 |
| 113402 | SFT2D1 | LZE2T | Human | Esophagus | ESCC | 3.63e-06 | 4.76e-01 | 0.082 |
| 113402 | SFT2D1 | LZE4T | Human | Esophagus | ESCC | 1.41e-19 | 3.01e-01 | 0.0811 |
| 113402 | SFT2D1 | LZE5T | Human | Esophagus | ESCC | 6.59e-05 | 6.68e-01 | 0.0514 |
| 113402 | SFT2D1 | LZE7T | Human | Esophagus | ESCC | 4.29e-09 | 7.39e-01 | 0.0667 |
| 113402 | SFT2D1 | LZE8T | Human | Esophagus | ESCC | 3.52e-14 | 6.20e-01 | 0.067 |
| 113402 | SFT2D1 | LZE20T | Human | Esophagus | ESCC | 2.99e-09 | 3.32e-01 | 0.0662 |
| 113402 | SFT2D1 | LZE22D1 | Human | Esophagus | HGIN | 4.04e-05 | 9.90e-02 | 0.0595 |
| Page: 1 2 3 4 5 6 7 8 |
| Tissue | Expression Dynamics | Abbreviation |
| Colorectum (GSE201348) |  | FAP: Familial adenomatous polyposis |
| CRC: Colorectal cancer | ||
| Colorectum (HTA11) |  | AD: Adenomas |
| SER: Sessile serrated lesions | ||
| MSI-H: Microsatellite-high colorectal cancer | ||
| MSS: Microsatellite stable colorectal cancer | ||
| Esophagus |  | ESCC: Esophageal squamous cell carcinoma |
| HGIN: High-grade intraepithelial neoplasias | ||
| LGIN: Low-grade intraepithelial neoplasias | ||
| Liver | 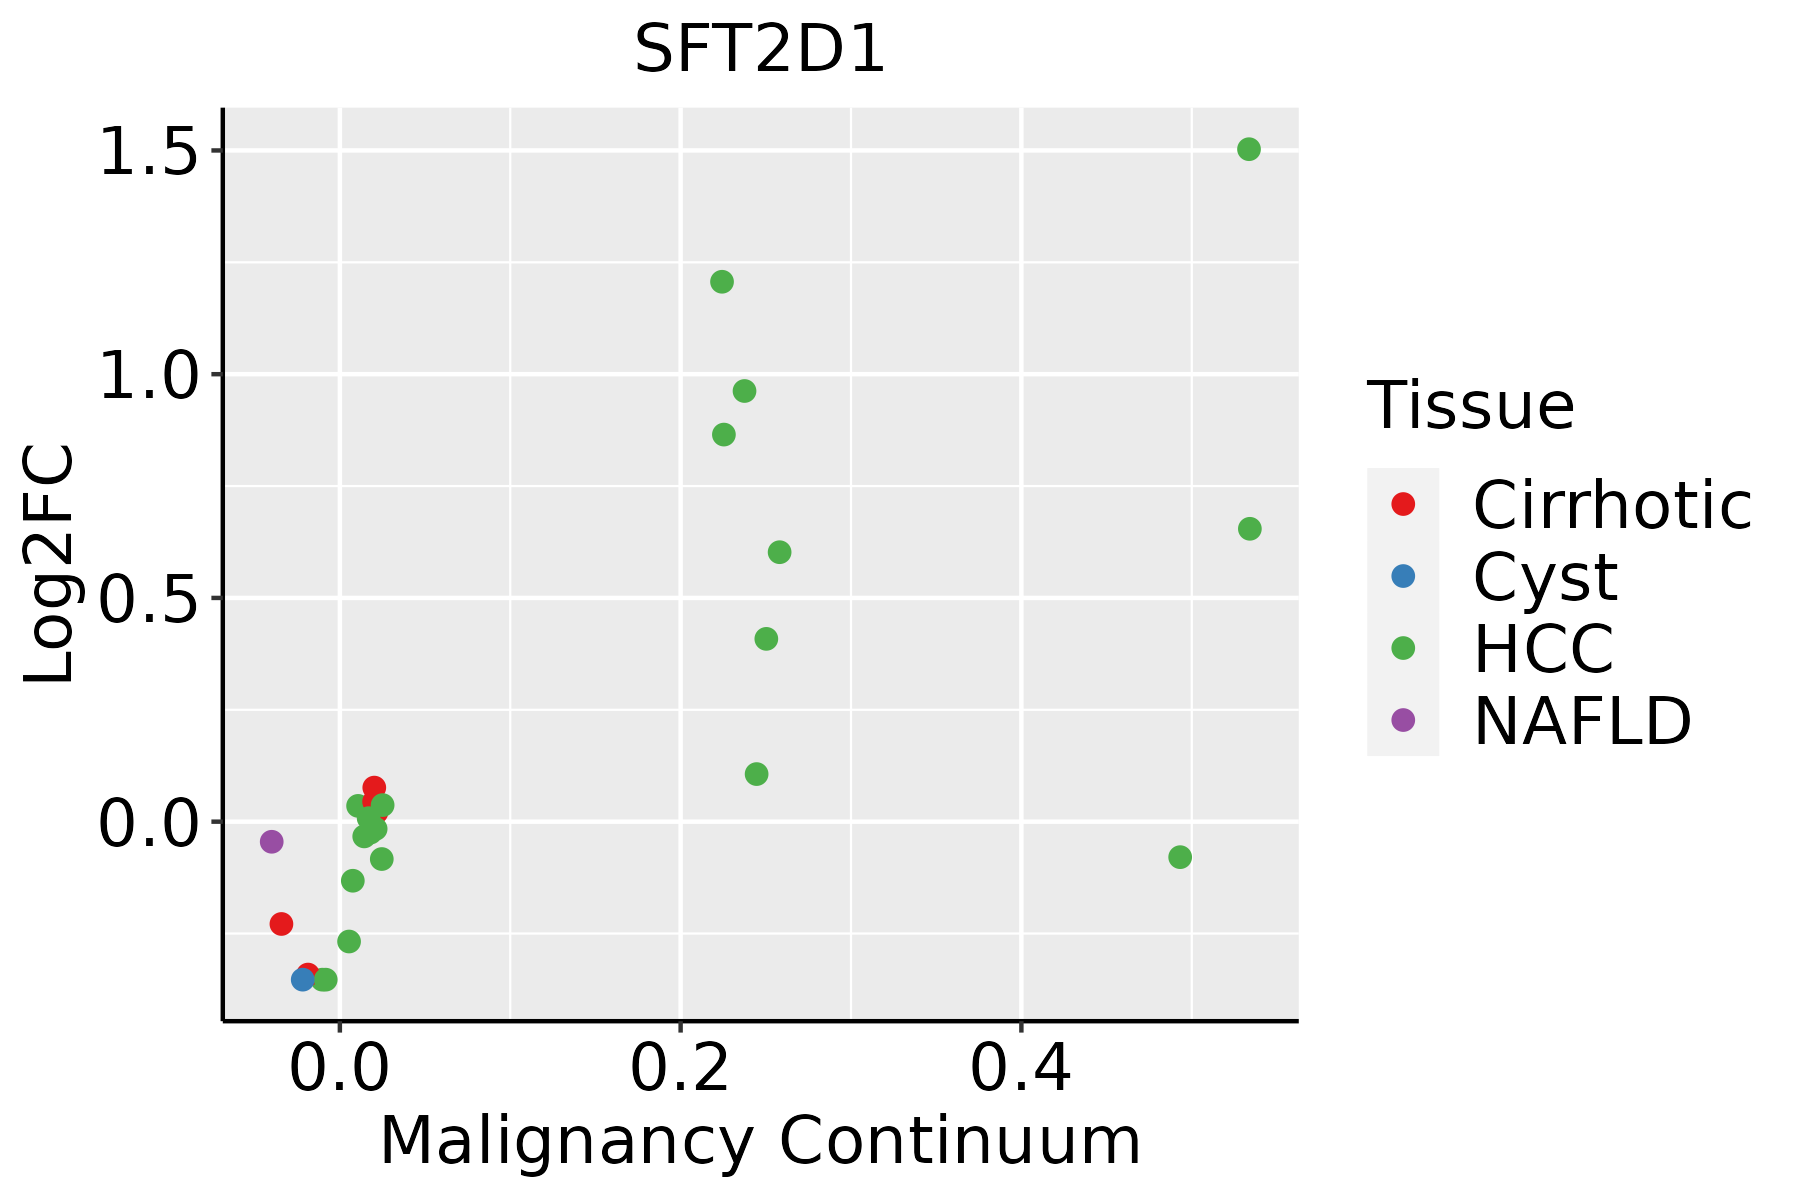 | HCC: Hepatocellular carcinoma |
| NAFLD: Non-alcoholic fatty liver disease | ||
| Oral Cavity | 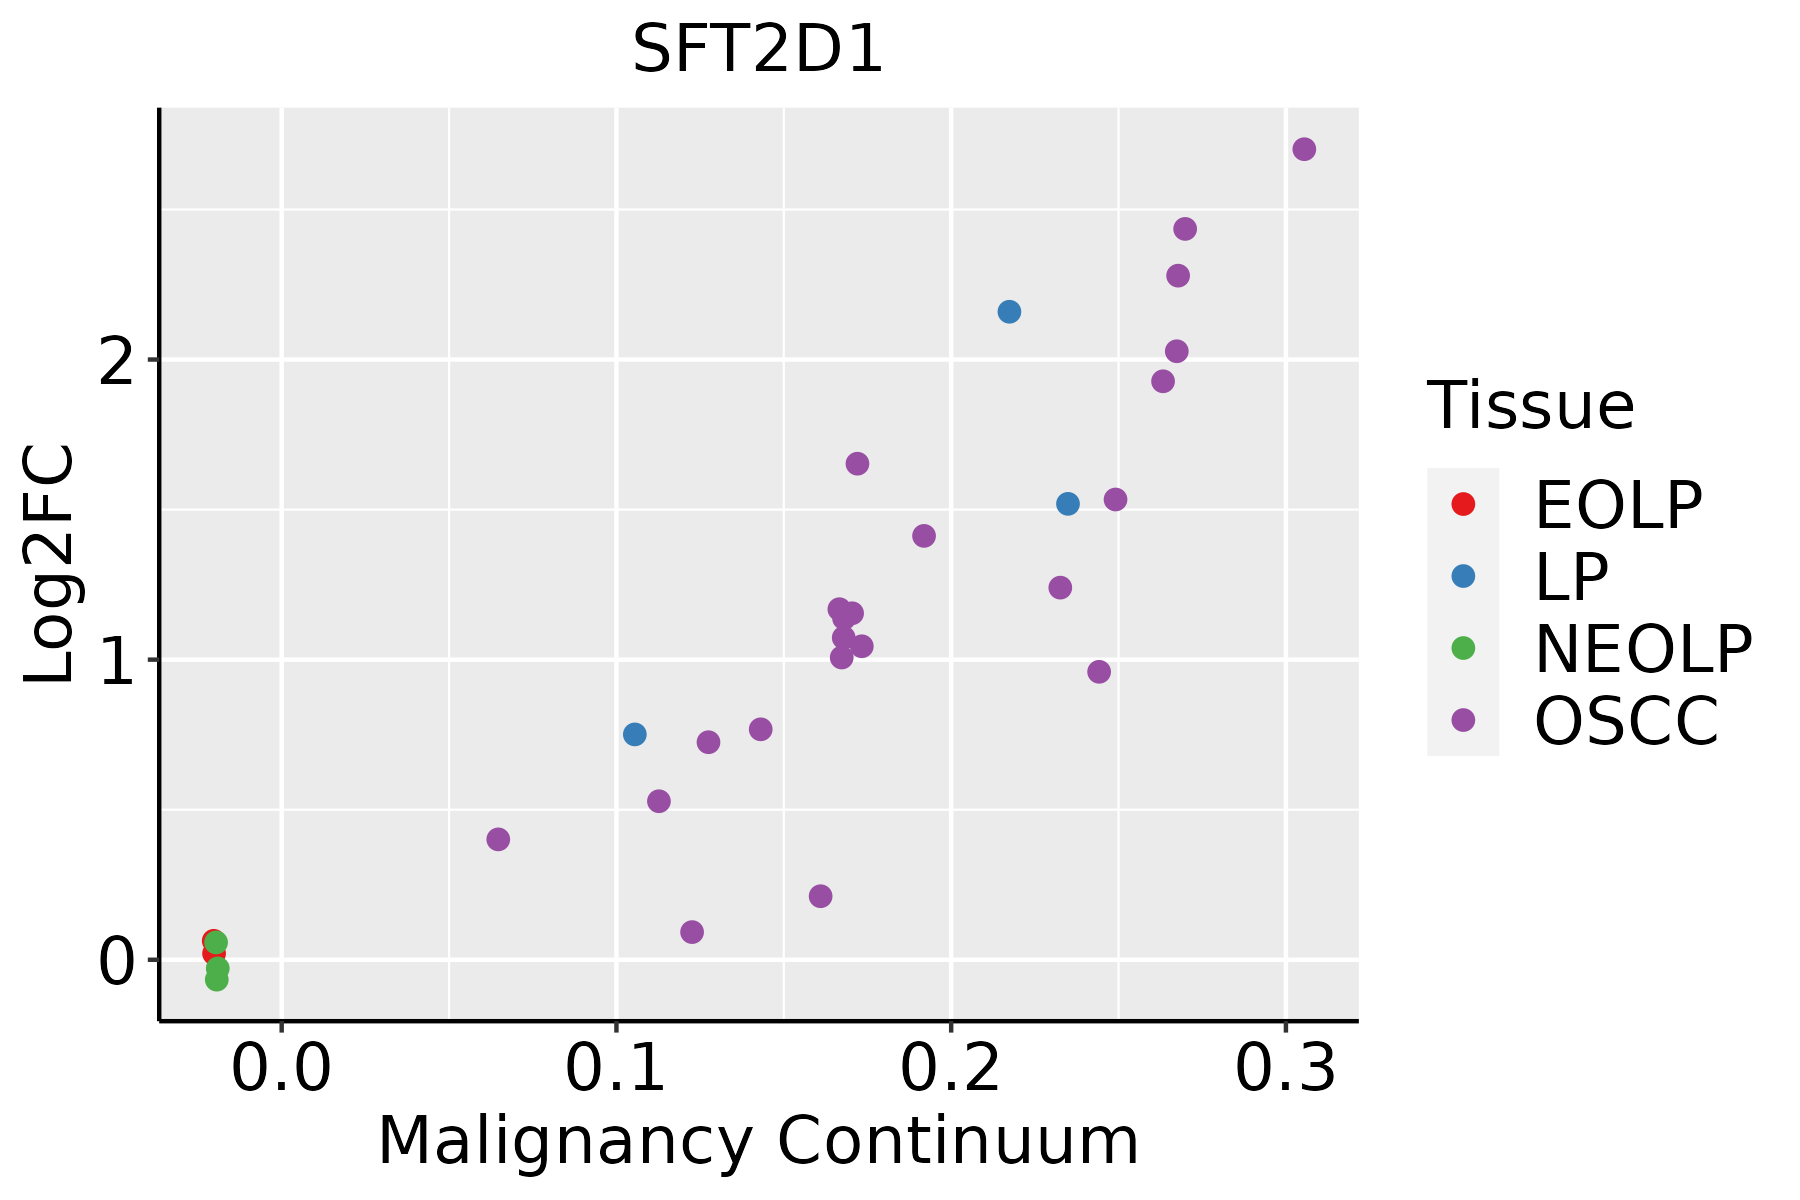 | EOLP: Erosive Oral lichen planus |
| LP: leukoplakia | ||
| NEOLP: Non-erosive oral lichen planus | ||
| OSCC: Oral squamous cell carcinoma | ||
| Prostate | 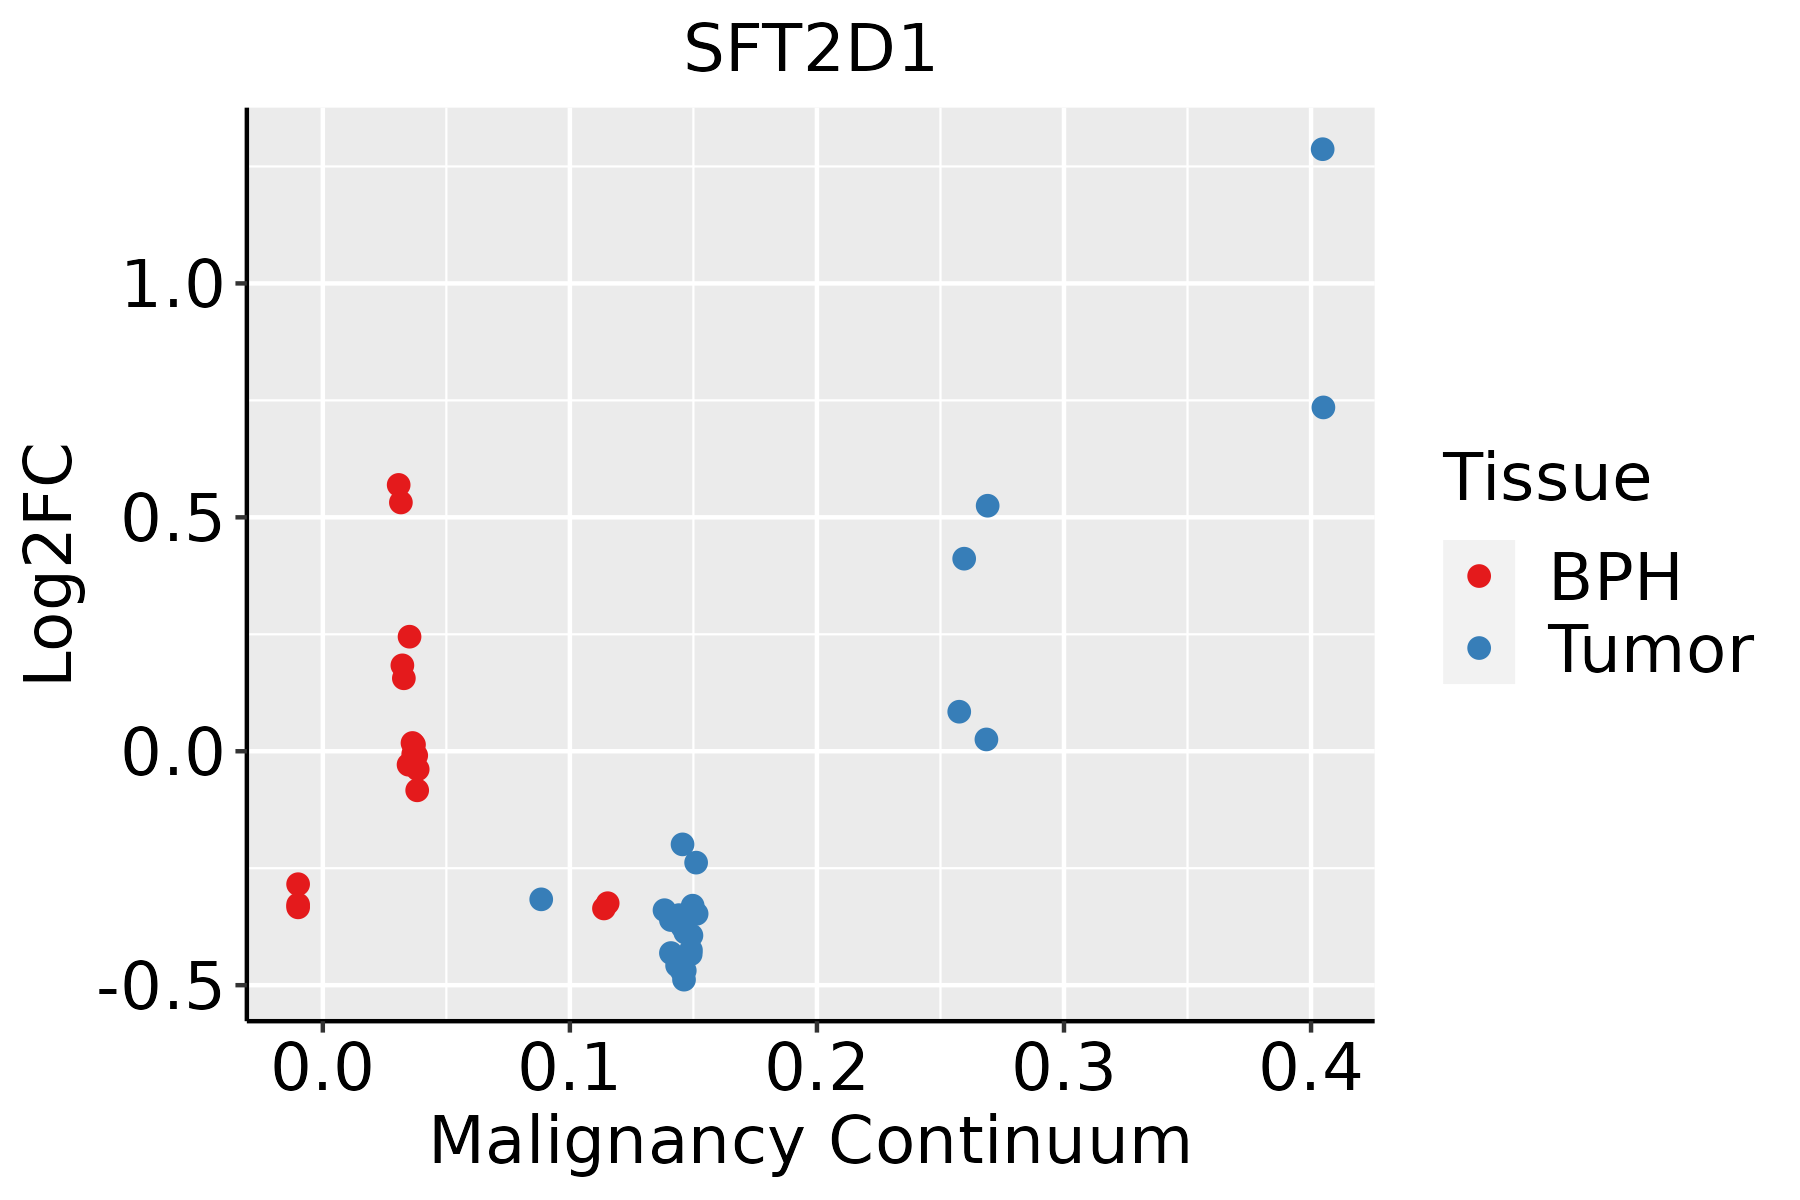 | BPH: Benign Prostatic Hyperplasia |
| Skin |  | AK: Actinic keratosis |
| cSCC: Cutaneous squamous cell carcinoma | ||
| SCCIS:squamous cell carcinoma in situ | ||
| Thyroid | 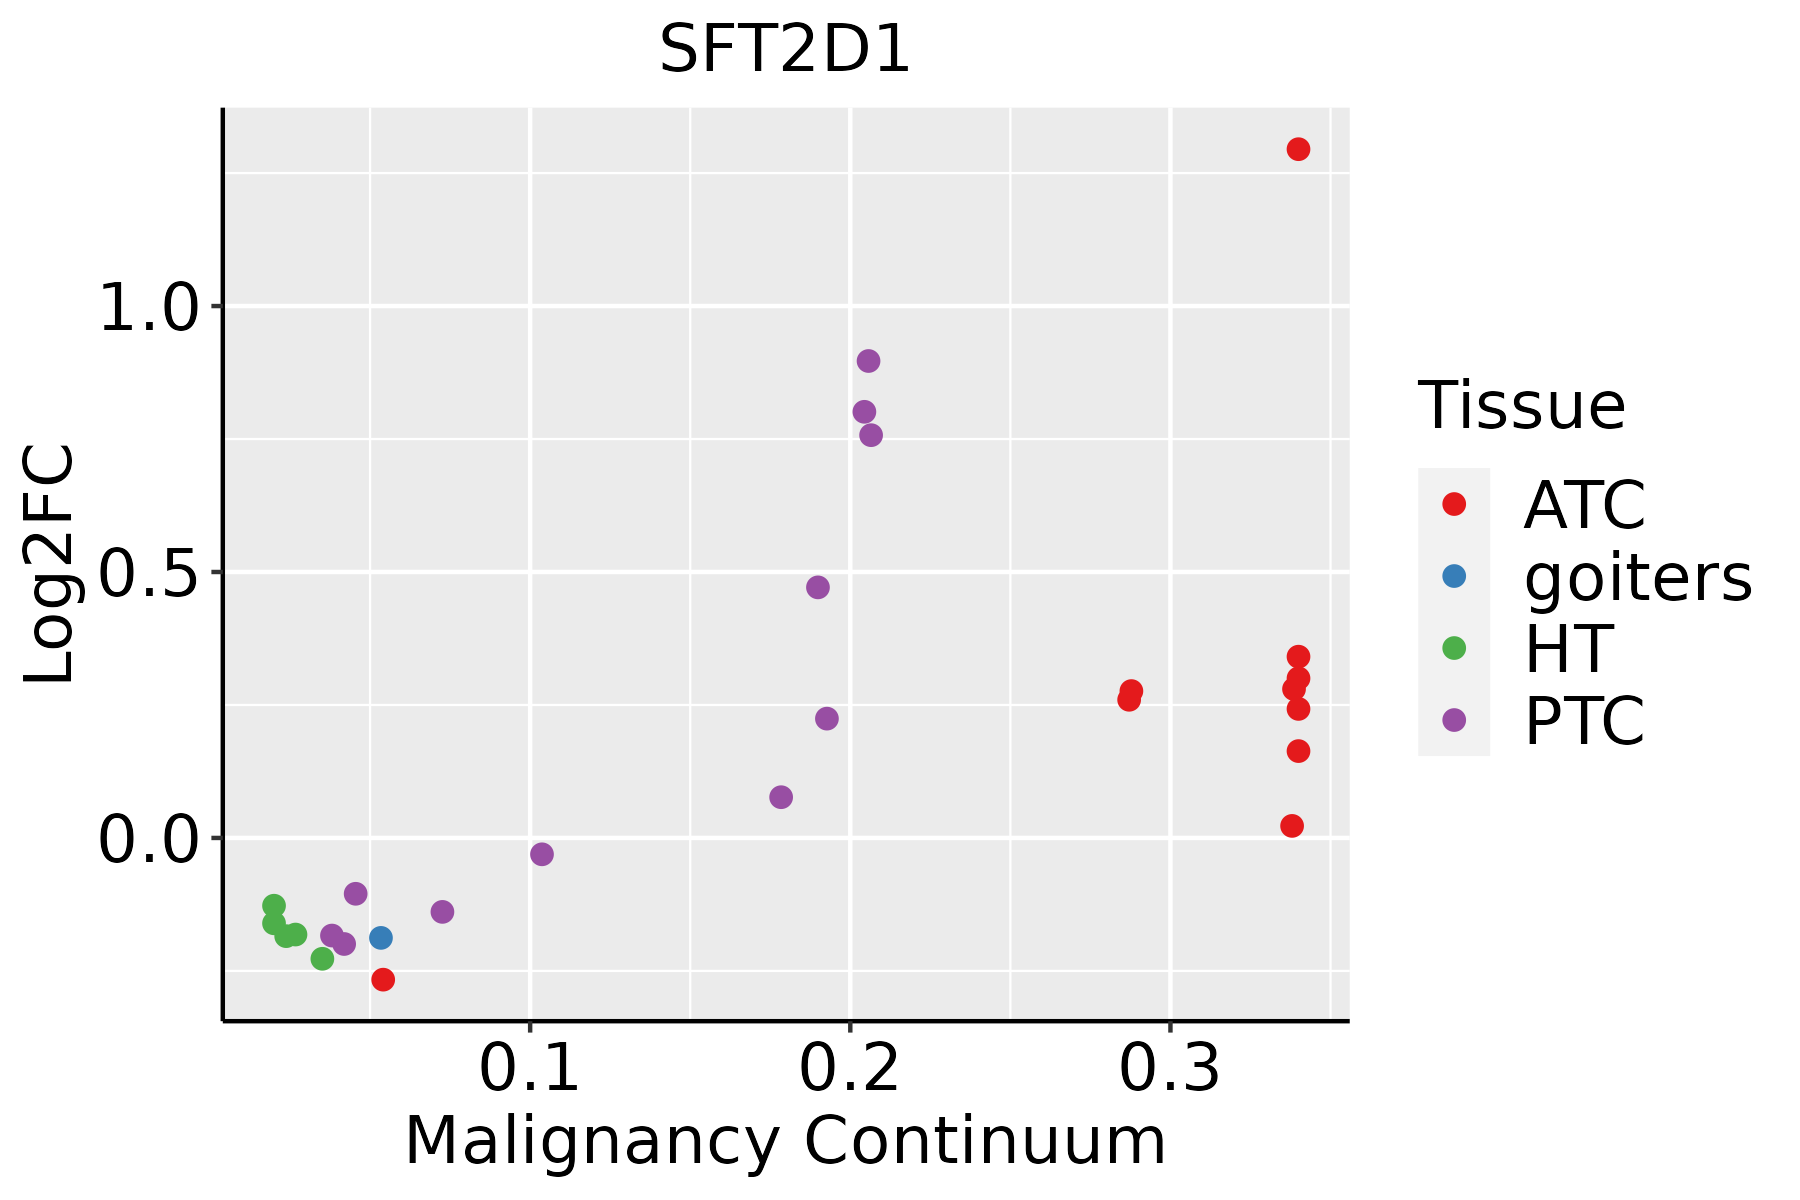 | ATC: Anaplastic thyroid cancer |
| HT: Hashimoto's thyroiditis | ||
| PTC: Papillary thyroid cancer |
| ∗log2FC in expression of this searched gene in stem-like cells from each diseased tissue sample relative to stem-like cells in normal samples in each tissue plotted against the malignancy continuum. Samples are colored based on if they are from different disease stage. |
Top |
Malignant transformation related pathway analysis |
| Find out the enriched GO biological processes and KEGG pathways involved in transition from healthy to precancer to cancer |
| Tissue | Disease Stage | Enriched GO biological Processes |
| Colorectum | AD |  |
| Colorectum | SER |  |
| Colorectum | MSS |  |
| Colorectum | MSI-H |  |
| Colorectum | FAP |  |
| ∗Top 15 enriched GO BP terms are showed in the bar plot of each disease state in each tissue. Each row represents a significant GO biological process which is colored according to the -log10(p.adjust). |
| Page: 1 2 3 4 5 6 7 8 9 |
| GO ID | Tissue | Disease Stage | Description | Gene Ratio | Bg Ratio | pvalue | p.adjust | Count |
| Page: 1 |
| Pathway ID | Tissue | Disease Stage | Description | Gene Ratio | Bg Ratio | pvalue | p.adjust | qvalue | Count |
| Page: 1 |
Top |
Cell-cell communication analysis |
| Identification of potential cell-cell interactions between two cell types and their ligand-receptor pairs for different disease states |
| Ligand | Receptor | LRpair | Pathway | Tissue | Disease Stage |
| Page: 1 |
Top |
Single-cell gene regulatory network inference analysis |
| Find out the significant the regulons (TFs) and the target genes of each regulon across cell types for different disease states |
| TF | Cell Type | Tissue | Disease Stage | Target Gene | RSS | Regulon Activity |
| ∗The dot plots of a searched regulon are shown for all cell subpopulations in each disease state of each tissue based on the regulon specific score inferred using pySCENIC and by calculating the average expression. |
| Page: 1 |
Top |
Somatic mutation of malignant transformation related genes |
| Annotation of somatic variants for genes involved in malignant transformation |
| Hugo Symbol | Variant Class | Variant Classification | dbSNP RS | HGVSc | HGVSp | HGVSp Short | SWISSPROT | BIOTYPE | SIFT | PolyPhen | Tumor Sample Barcode | Tissue | Histology | Sex | Age | Stage | Therapy Types | Drugs | Outcome |
| SFT2D1 | SNV | Missense_Mutation | c.138N>A | p.Phe46Leu | p.F46L | Q8WV19 | protein_coding | tolerated(1) | benign(0) | TCGA-AA-3510-01 | Colorectum | colon adenocarcinoma | Male | >=65 | I/II | Unknown | Unknown | SD | |
| SFT2D1 | SNV | Missense_Mutation | rs201063880 | c.133G>A | p.Val45Ile | p.V45I | Q8WV19 | protein_coding | tolerated(1) | benign(0.003) | TCGA-AA-A00N-01 | Colorectum | colon adenocarcinoma | Male | >=65 | I/II | Unknown | Unknown | PD |
| SFT2D1 | SNV | Missense_Mutation | rs201063880 | c.133N>A | p.Val45Ile | p.V45I | Q8WV19 | protein_coding | tolerated(1) | benign(0.003) | TCGA-CA-6717-01 | Colorectum | colon adenocarcinoma | Male | <65 | I/II | Chemotherapy | oxaliplatin | CR |
| SFT2D1 | SNV | Missense_Mutation | novel | c.464N>A | p.Ser155Tyr | p.S155Y | Q8WV19 | protein_coding | deleterious(0) | possibly_damaging(0.876) | TCGA-A5-A0G2-01 | Endometrium | uterine corpus endometrioid carcinoma | Female | <65 | III/IV | Unknown | Unknown | SD |
| SFT2D1 | SNV | Missense_Mutation | rs769925855 | c.211N>A | p.Gly71Ser | p.G71S | Q8WV19 | protein_coding | deleterious(0.02) | probably_damaging(1) | TCGA-A5-A0G2-01 | Endometrium | uterine corpus endometrioid carcinoma | Female | <65 | III/IV | Unknown | Unknown | SD |
| SFT2D1 | SNV | Missense_Mutation | novel | c.254N>A | p.Pro85His | p.P85H | Q8WV19 | protein_coding | deleterious(0) | probably_damaging(1) | TCGA-AX-A3G9-01 | Endometrium | uterine corpus endometrioid carcinoma | Female | <65 | III/IV | Chemotherapy | carboplatin | SD |
| SFT2D1 | SNV | Missense_Mutation | novel | c.250N>A | p.Gly84Arg | p.G84R | Q8WV19 | protein_coding | deleterious(0) | probably_damaging(1) | TCGA-EO-A22U-01 | Endometrium | uterine corpus endometrioid carcinoma | Female | >=65 | I/II | Unknown | Unknown | SD |
| SFT2D1 | SNV | Missense_Mutation | c.318N>T | p.Leu106Phe | p.L106F | Q8WV19 | protein_coding | tolerated(0.07) | possibly_damaging(0.55) | TCGA-97-7547-01 | Lung | lung adenocarcinoma | Female | >=65 | I/II | Chemotherapy | vinorelbine | PD | |
| SFT2D1 | SNV | Missense_Mutation | novel | c.461G>C | p.Cys154Ser | p.C154S | Q8WV19 | protein_coding | deleterious(0.04) | benign(0.396) | TCGA-MN-A4N5-01 | Lung | lung adenocarcinoma | Male | <65 | I/II | Unknown | Unknown | SD |
| SFT2D1 | SNV | Missense_Mutation | novel | c.378A>T | p.Leu126Phe | p.L126F | Q8WV19 | protein_coding | deleterious(0.01) | possibly_damaging(0.76) | TCGA-BR-8361-01 | Stomach | stomach adenocarcinoma | Female | >=65 | III/IV | Unknown | Unknown | SD |
| Page: 1 |
Top |
Related drugs of malignant transformation related genes |
| Identification of chemicals and drugs interact with genes involved in malignant transfromation |
| (DGIdb 4.0) |
| Entrez ID | Symbol | Category | Interaction Types | Drug Claim Name | Drug Name | PMIDs |
| Page: 1 |

Copyright 2023-Present -The University of Texas Health Science Center at Houston |