
|
|||||
|
 | |
| |
| |
| |
| |
| |
|
Gene: SFRP5 |
Gene summary for SFRP5 |
| Gene information | Species | Human | Gene symbol | SFRP5 | Gene ID | 6425 |
| Gene name | secreted frizzled related protein 5 | |
| Gene Alias | SARP3 | |
| Cytomap | 10q24.2 | |
| Gene Type | protein-coding | GO ID | GO:0003008 | UniProtAcc | Q5T4F7 |
Top |
Malignant transformation analysis |
| Identification of the aberrant gene expression in precancerous and cancerous lesions by comparing the gene expression of stem-like cells in diseased tissues with normal stem cells |
| Entrez ID | Symbol | Replicates | Species | Organ | Tissue | Adj P-value | Log2FC | Malignancy |
| 6425 | SFRP5 | S43 | Human | Liver | Cirrhotic | 1.06e-42 | 6.08e-01 | -0.0187 |
| 6425 | SFRP5 | HCC1_Meng | Human | Liver | HCC | 4.27e-25 | -6.36e-01 | 0.0246 |
| 6425 | SFRP5 | HCC2_Meng | Human | Liver | HCC | 1.78e-25 | -6.26e-01 | 0.0107 |
| 6425 | SFRP5 | cirrhotic1 | Human | Liver | Cirrhotic | 5.86e-14 | 9.03e-02 | 0.0202 |
| 6425 | SFRP5 | cirrhotic2 | Human | Liver | Cirrhotic | 1.09e-17 | 3.59e-01 | 0.0201 |
| 6425 | SFRP5 | cirrhotic3 | Human | Liver | Cirrhotic | 1.51e-02 | -6.59e-02 | 0.0215 |
| 6425 | SFRP5 | p6 | Human | Liver | Cyst | 6.31e-03 | 7.06e-01 | -0.0218 |
| 6425 | SFRP5 | HCC1 | Human | Liver | HCC | 3.02e-04 | -6.37e-01 | 0.5336 |
| 6425 | SFRP5 | HCC2 | Human | Liver | HCC | 1.73e-06 | -6.37e-01 | 0.5341 |
| 6425 | SFRP5 | HCC5 | Human | Liver | HCC | 8.17e-10 | -6.37e-01 | 0.4932 |
| 6425 | SFRP5 | Pt13.a | Human | Liver | HCC | 7.37e-26 | -6.37e-01 | 0.021 |
| 6425 | SFRP5 | Pt13.b | Human | Liver | HCC | 1.06e-17 | -6.37e-01 | 0.0251 |
| 6425 | SFRP5 | Pt13.c | Human | Liver | HCC | 1.28e-11 | -6.37e-01 | 0.0076 |
| 6425 | SFRP5 | Pt14.b | Human | Liver | HCC | 7.42e-03 | -6.37e-01 | 0.018 |
| 6425 | SFRP5 | Pt14.c | Human | Liver | HCC | 9.32e-04 | -6.37e-01 | 0.0054 |
| 6425 | SFRP5 | Pt14.d | Human | Liver | HCC | 3.38e-23 | -6.34e-01 | 0.0143 |
| 6425 | SFRP5 | S014 | Human | Liver | HCC | 3.29e-12 | -6.29e-01 | 0.2254 |
| 6425 | SFRP5 | S015 | Human | Liver | HCC | 6.78e-10 | -6.37e-01 | 0.2375 |
| 6425 | SFRP5 | S016 | Human | Liver | HCC | 5.93e-18 | -6.37e-01 | 0.2243 |
| 6425 | SFRP5 | S028 | Human | Liver | HCC | 9.31e-07 | -5.90e-01 | 0.2503 |
| Page: 1 2 |
| Tissue | Expression Dynamics | Abbreviation |
| Liver | 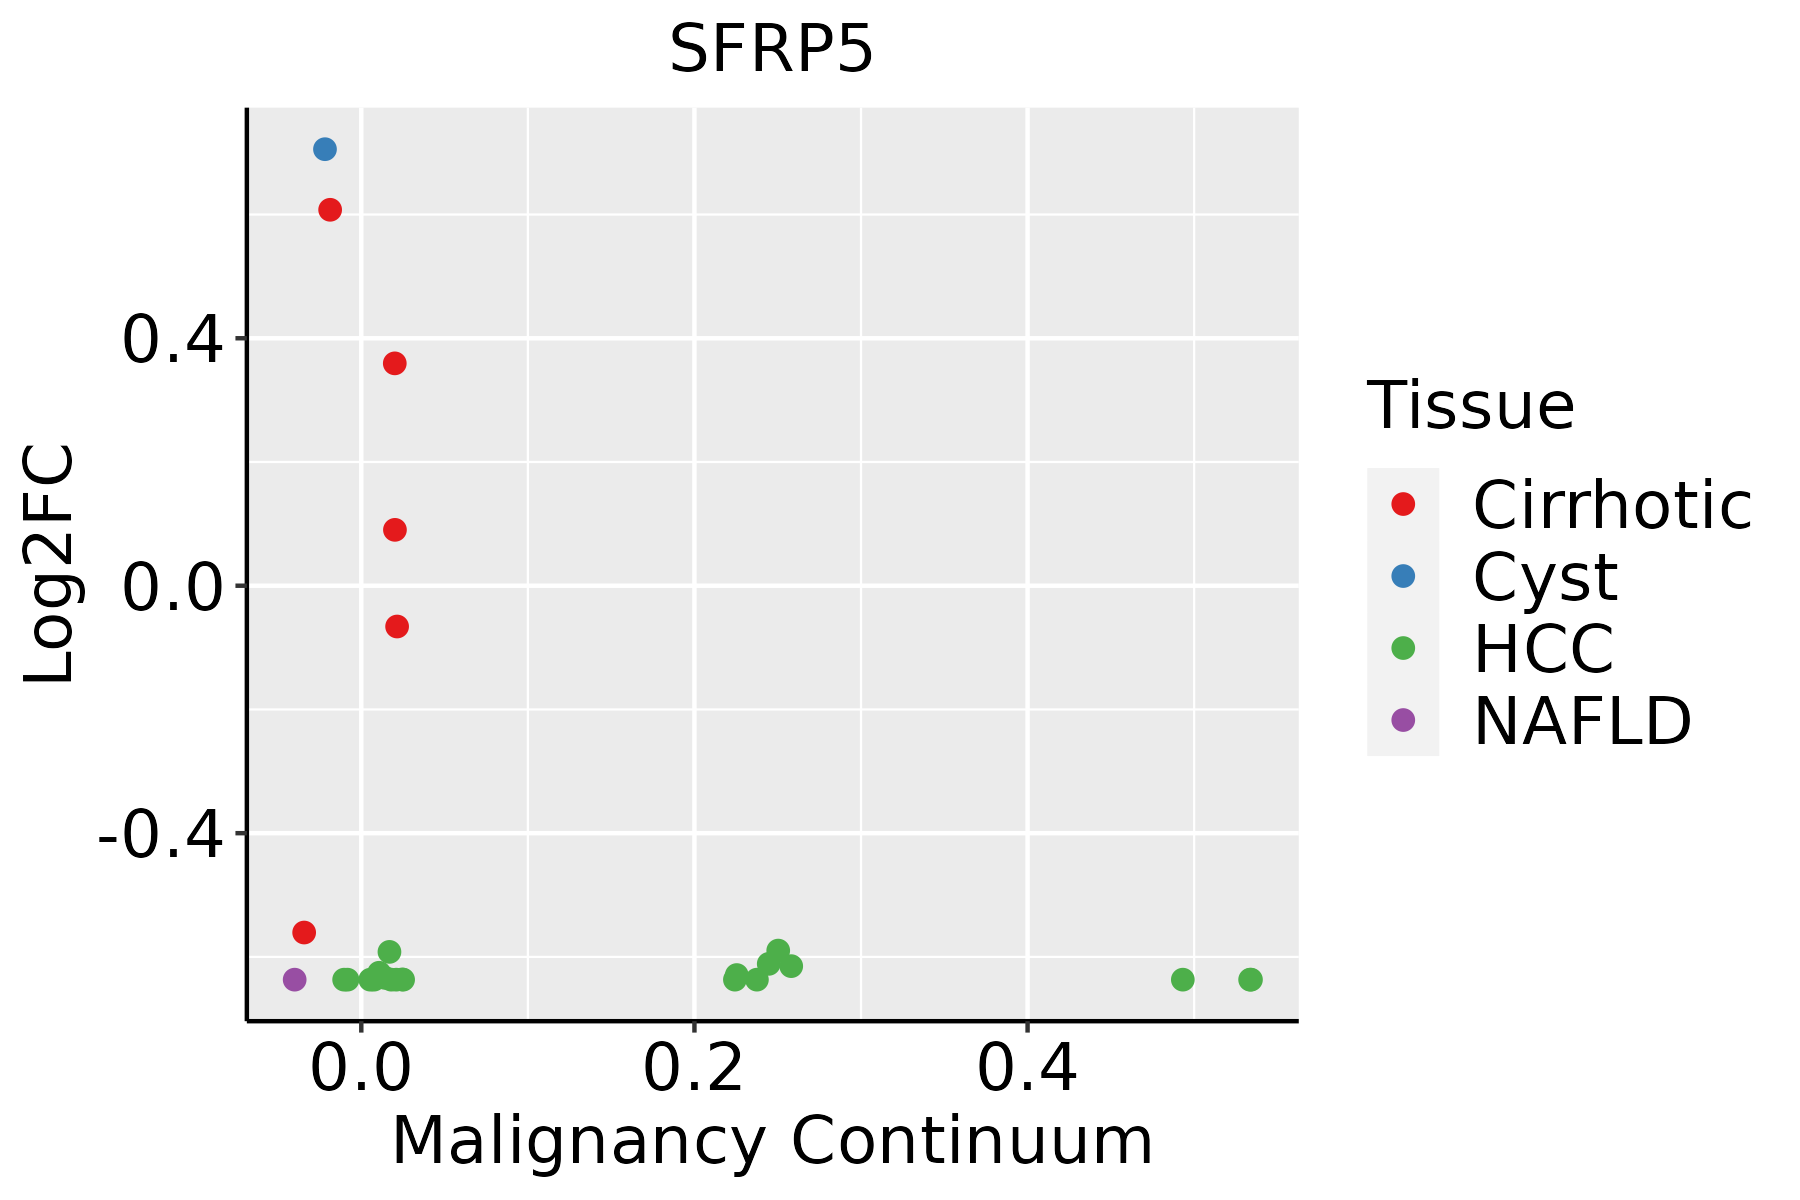 | HCC: Hepatocellular carcinoma |
| NAFLD: Non-alcoholic fatty liver disease |
| ∗log2FC in expression of this searched gene in stem-like cells from each diseased tissue sample relative to stem-like cells in normal samples in each tissue plotted against the malignancy continuum. Samples are colored based on if they are from different disease stage. |
Top |
Malignant transformation related pathway analysis |
| Find out the enriched GO biological processes and KEGG pathways involved in transition from healthy to precancer to cancer |
| Tissue | Disease Stage | Enriched GO biological Processes |
| Colorectum | AD |  |
| Colorectum | SER |  |
| Colorectum | MSS |  |
| Colorectum | MSI-H |  |
| Colorectum | FAP |  |
| ∗Top 15 enriched GO BP terms are showed in the bar plot of each disease state in each tissue. Each row represents a significant GO biological process which is colored according to the -log10(p.adjust). |
| Page: 1 2 3 4 5 6 7 8 9 |
| GO ID | Tissue | Disease Stage | Description | Gene Ratio | Bg Ratio | pvalue | p.adjust | Count |
| GO:001605511 | Liver | Cirrhotic | Wnt signaling pathway | 150/4634 | 444/18723 | 9.75e-06 | 1.42e-04 | 150 |
| GO:019873811 | Liver | Cirrhotic | cell-cell signaling by wnt | 150/4634 | 446/18723 | 1.28e-05 | 1.80e-04 | 150 |
| GO:000716312 | Liver | Cirrhotic | establishment or maintenance of cell polarity | 82/4634 | 218/18723 | 1.55e-05 | 2.11e-04 | 82 |
| GO:003011111 | Liver | Cirrhotic | regulation of Wnt signaling pathway | 112/4634 | 328/18723 | 7.57e-05 | 8.40e-04 | 112 |
| GO:006082811 | Liver | Cirrhotic | regulation of canonical Wnt signaling pathway | 86/4634 | 253/18723 | 5.70e-04 | 4.46e-03 | 86 |
| GO:006007011 | Liver | Cirrhotic | canonical Wnt signaling pathway | 97/4634 | 303/18723 | 2.42e-03 | 1.46e-02 | 97 |
| GO:000717811 | Liver | Cirrhotic | transmembrane receptor protein serine/threonine kinase signaling pathway | 111/4634 | 355/18723 | 2.98e-03 | 1.70e-02 | 111 |
| GO:019873821 | Liver | HCC | cell-cell signaling by wnt | 247/7958 | 446/18723 | 2.11e-08 | 4.96e-07 | 247 |
| GO:000716322 | Liver | HCC | establishment or maintenance of cell polarity | 133/7958 | 218/18723 | 2.48e-08 | 5.73e-07 | 133 |
| GO:001605521 | Liver | HCC | Wnt signaling pathway | 245/7958 | 444/18723 | 3.68e-08 | 8.09e-07 | 245 |
| GO:003011121 | Liver | HCC | regulation of Wnt signaling pathway | 180/7958 | 328/18723 | 3.62e-06 | 4.72e-05 | 180 |
| GO:006007021 | Liver | HCC | canonical Wnt signaling pathway | 162/7958 | 303/18723 | 7.00e-05 | 6.32e-04 | 162 |
| GO:006082821 | Liver | HCC | regulation of canonical Wnt signaling pathway | 137/7958 | 253/18723 | 1.15e-04 | 9.70e-04 | 137 |
| GO:00510902 | Liver | HCC | regulation of DNA-binding transcription factor activity | 220/7958 | 440/18723 | 8.04e-04 | 4.82e-03 | 220 |
| GO:000716331 | Liver | Cyst | establishment or maintenance of cell polarity | 17/496 | 218/18723 | 7.45e-05 | 3.66e-03 | 17 |
| GO:0043491 | Liver | Cyst | protein kinase B signaling | 16/496 | 211/18723 | 1.67e-04 | 6.59e-03 | 16 |
| Page: 1 |
| Pathway ID | Tissue | Disease Stage | Description | Gene Ratio | Bg Ratio | pvalue | p.adjust | qvalue | Count |
| Page: 1 |
Top |
Cell-cell communication analysis |
| Identification of potential cell-cell interactions between two cell types and their ligand-receptor pairs for different disease states |
| Ligand | Receptor | LRpair | Pathway | Tissue | Disease Stage |
| Page: 1 |
Top |
Single-cell gene regulatory network inference analysis |
| Find out the significant the regulons (TFs) and the target genes of each regulon across cell types for different disease states |
| TF | Cell Type | Tissue | Disease Stage | Target Gene | RSS | Regulon Activity |
| ∗The dot plots of a searched regulon are shown for all cell subpopulations in each disease state of each tissue based on the regulon specific score inferred using pySCENIC and by calculating the average expression. |
| Page: 1 |
Top |
Somatic mutation of malignant transformation related genes |
| Annotation of somatic variants for genes involved in malignant transformation |
| Hugo Symbol | Variant Class | Variant Classification | dbSNP RS | HGVSc | HGVSp | HGVSp Short | SWISSPROT | BIOTYPE | SIFT | PolyPhen | Tumor Sample Barcode | Tissue | Histology | Sex | Age | Stage | Therapy Types | Drugs | Outcome |
| SFRP5 | SNV | Missense_Mutation | c.775N>C | p.Asp259His | p.D259H | Q5T4F7 | protein_coding | tolerated(0.07) | probably_damaging(0.95) | TCGA-D8-A1JS-01 | Breast | breast invasive carcinoma | Female | >=65 | I/II | Hormone Therapy | tamoxiphen | SD | |
| SFRP5 | SNV | Missense_Mutation | novel | c.217N>G | p.Leu73Val | p.L73V | Q5T4F7 | protein_coding | deleterious(0.01) | probably_damaging(0.964) | TCGA-DS-A1OB-01 | Cervix | cervical & endocervical cancer | Female | <65 | I/II | Chemotherapy | carboplatin | PD |
| SFRP5 | SNV | Missense_Mutation | novel | c.215N>A | p.Arg72Gln | p.R72Q | Q5T4F7 | protein_coding | tolerated(0.05) | possibly_damaging(0.806) | TCGA-DS-A1OB-01 | Cervix | cervical & endocervical cancer | Female | <65 | I/II | Chemotherapy | carboplatin | PD |
| SFRP5 | SNV | Missense_Mutation | c.214C>T | p.Arg72Trp | p.R72W | Q5T4F7 | protein_coding | deleterious(0.02) | possibly_damaging(0.608) | TCGA-A6-2677-01 | Colorectum | colon adenocarcinoma | Female | >=65 | III/IV | Ancillary | leucovorin | SD | |
| SFRP5 | SNV | Missense_Mutation | c.619N>T | p.Arg207Cys | p.R207C | Q5T4F7 | protein_coding | deleterious(0) | benign(0.262) | TCGA-AA-3984-01 | Colorectum | colon adenocarcinoma | Female | <65 | I/II | Unknown | Unknown | SD | |
| SFRP5 | SNV | Missense_Mutation | novel | c.184N>A | p.Leu62Ile | p.L62I | Q5T4F7 | protein_coding | deleterious(0) | possibly_damaging(0.896) | TCGA-AA-A010-01 | Colorectum | colon adenocarcinoma | Female | <65 | I/II | Chemotherapy | folinic | CR |
| SFRP5 | insertion | Frame_Shift_Ins | novel | c.949_950insC | p.His317ProfsTer55 | p.H317Pfs*55 | Q5T4F7 | protein_coding | TCGA-AZ-4615-01 | Colorectum | colon adenocarcinoma | Male | >=65 | III/IV | Chemotherapy | xeloda | PD | ||
| SFRP5 | SNV | Missense_Mutation | c.619N>T | p.Arg207Cys | p.R207C | Q5T4F7 | protein_coding | deleterious(0) | benign(0.262) | TCGA-A5-A0G2-01 | Endometrium | uterine corpus endometrioid carcinoma | Female | <65 | III/IV | Unknown | Unknown | SD | |
| SFRP5 | SNV | Missense_Mutation | novel | c.155N>G | p.Gln52Arg | p.Q52R | Q5T4F7 | protein_coding | deleterious(0.01) | benign(0.075) | TCGA-AJ-A3OJ-01 | Endometrium | uterine corpus endometrioid carcinoma | Female | <65 | I/II | Chemotherapy | carboplatin | CR |
| SFRP5 | SNV | Missense_Mutation | rs769455490 | c.724N>T | p.Arg242Trp | p.R242W | Q5T4F7 | protein_coding | deleterious(0) | probably_damaging(0.968) | TCGA-AP-A0LM-01 | Endometrium | uterine corpus endometrioid carcinoma | Female | <65 | III/IV | Chemotherapy | cisplatin | SD |
| Page: 1 2 3 |
Top |
Related drugs of malignant transformation related genes |
| Identification of chemicals and drugs interact with genes involved in malignant transfromation |
| (DGIdb 4.0) |
| Entrez ID | Symbol | Category | Interaction Types | Drug Claim Name | Drug Name | PMIDs |
| 6425 | SFRP5 | DRUGGABLE GENOME | Bisphosphonates |
| Page: 1 |

Copyright 2023-Present -The University of Texas Health Science Center at Houston |