
|
|||||
|
 | |
| |
| |
| |
| |
| |
|
Gene: SFRP2 |
Gene summary for SFRP2 |
| Gene information | Species | Human | Gene symbol | SFRP2 | Gene ID | 6423 |
| Gene name | secreted frizzled related protein 2 | |
| Gene Alias | FRP-2 | |
| Cytomap | 4q31.3 | |
| Gene Type | protein-coding | GO ID | GO:0000003 | UniProtAcc | A0A140VJU3 |
Top |
Malignant transformation analysis |
| Identification of the aberrant gene expression in precancerous and cancerous lesions by comparing the gene expression of stem-like cells in diseased tissues with normal stem cells |
| Entrez ID | Symbol | Replicates | Species | Organ | Tissue | Adj P-value | Log2FC | Malignancy |
| 6423 | SFRP2 | LZE2T | Human | Esophagus | ESCC | 2.55e-26 | 1.68e+00 | 0.082 |
| 6423 | SFRP2 | LZE4T | Human | Esophagus | ESCC | 2.98e-10 | -1.90e-01 | 0.0811 |
| 6423 | SFRP2 | P9T-E | Human | Esophagus | ESCC | 1.27e-04 | 2.22e+00 | 0.1131 |
| 6423 | SFRP2 | P16T-E | Human | Esophagus | ESCC | 1.64e-04 | -2.73e-01 | 0.1153 |
| 6423 | SFRP2 | P24T-E | Human | Esophagus | ESCC | 6.01e-05 | 3.47e-01 | 0.1287 |
| 6423 | SFRP2 | P31T-E | Human | Esophagus | ESCC | 2.95e-04 | -1.12e-01 | 0.1251 |
| 6423 | SFRP2 | P39T-E | Human | Esophagus | ESCC | 2.46e-03 | 1.80e-02 | 0.0894 |
| 6423 | SFRP2 | P48T-E | Human | Esophagus | ESCC | 1.63e-04 | -2.97e-01 | 0.0959 |
| 6423 | SFRP2 | P49T-E | Human | Esophagus | ESCC | 8.30e-28 | 1.16e+00 | 0.1768 |
| 6423 | SFRP2 | P52T-E | Human | Esophagus | ESCC | 2.82e-02 | 1.61e-01 | 0.1555 |
| 6423 | SFRP2 | P54T-E | Human | Esophagus | ESCC | 4.23e-20 | -1.50e-01 | 0.0975 |
| 6423 | SFRP2 | P62T-E | Human | Esophagus | ESCC | 5.31e-03 | -3.00e-01 | 0.1302 |
| 6423 | SFRP2 | P74T-E | Human | Esophagus | ESCC | 1.44e-02 | -2.56e-01 | 0.1479 |
| 6423 | SFRP2 | P75T-E | Human | Esophagus | ESCC | 1.17e-03 | -1.04e-01 | 0.1125 |
| 6423 | SFRP2 | P127T-E | Human | Esophagus | ESCC | 1.18e-03 | -2.91e-01 | 0.0826 |
| 6423 | SFRP2 | C21 | Human | Oral cavity | OSCC | 1.13e-03 | 5.20e-02 | 0.2678 |
| 6423 | SFRP2 | C30 | Human | Oral cavity | OSCC | 1.07e-10 | 3.45e-01 | 0.3055 |
| 6423 | SFRP2 | C51 | Human | Oral cavity | OSCC | 7.17e-05 | 3.30e-01 | 0.2674 |
| 6423 | SFRP2 | C09 | Human | Oral cavity | OSCC | 1.41e-06 | 9.04e-02 | 0.1431 |
| 6423 | SFRP2 | LP15 | Human | Oral cavity | LP | 1.59e-02 | 1.74e+00 | 0.2174 |
| Page: 1 2 |
| Tissue | Expression Dynamics | Abbreviation |
| Esophagus | 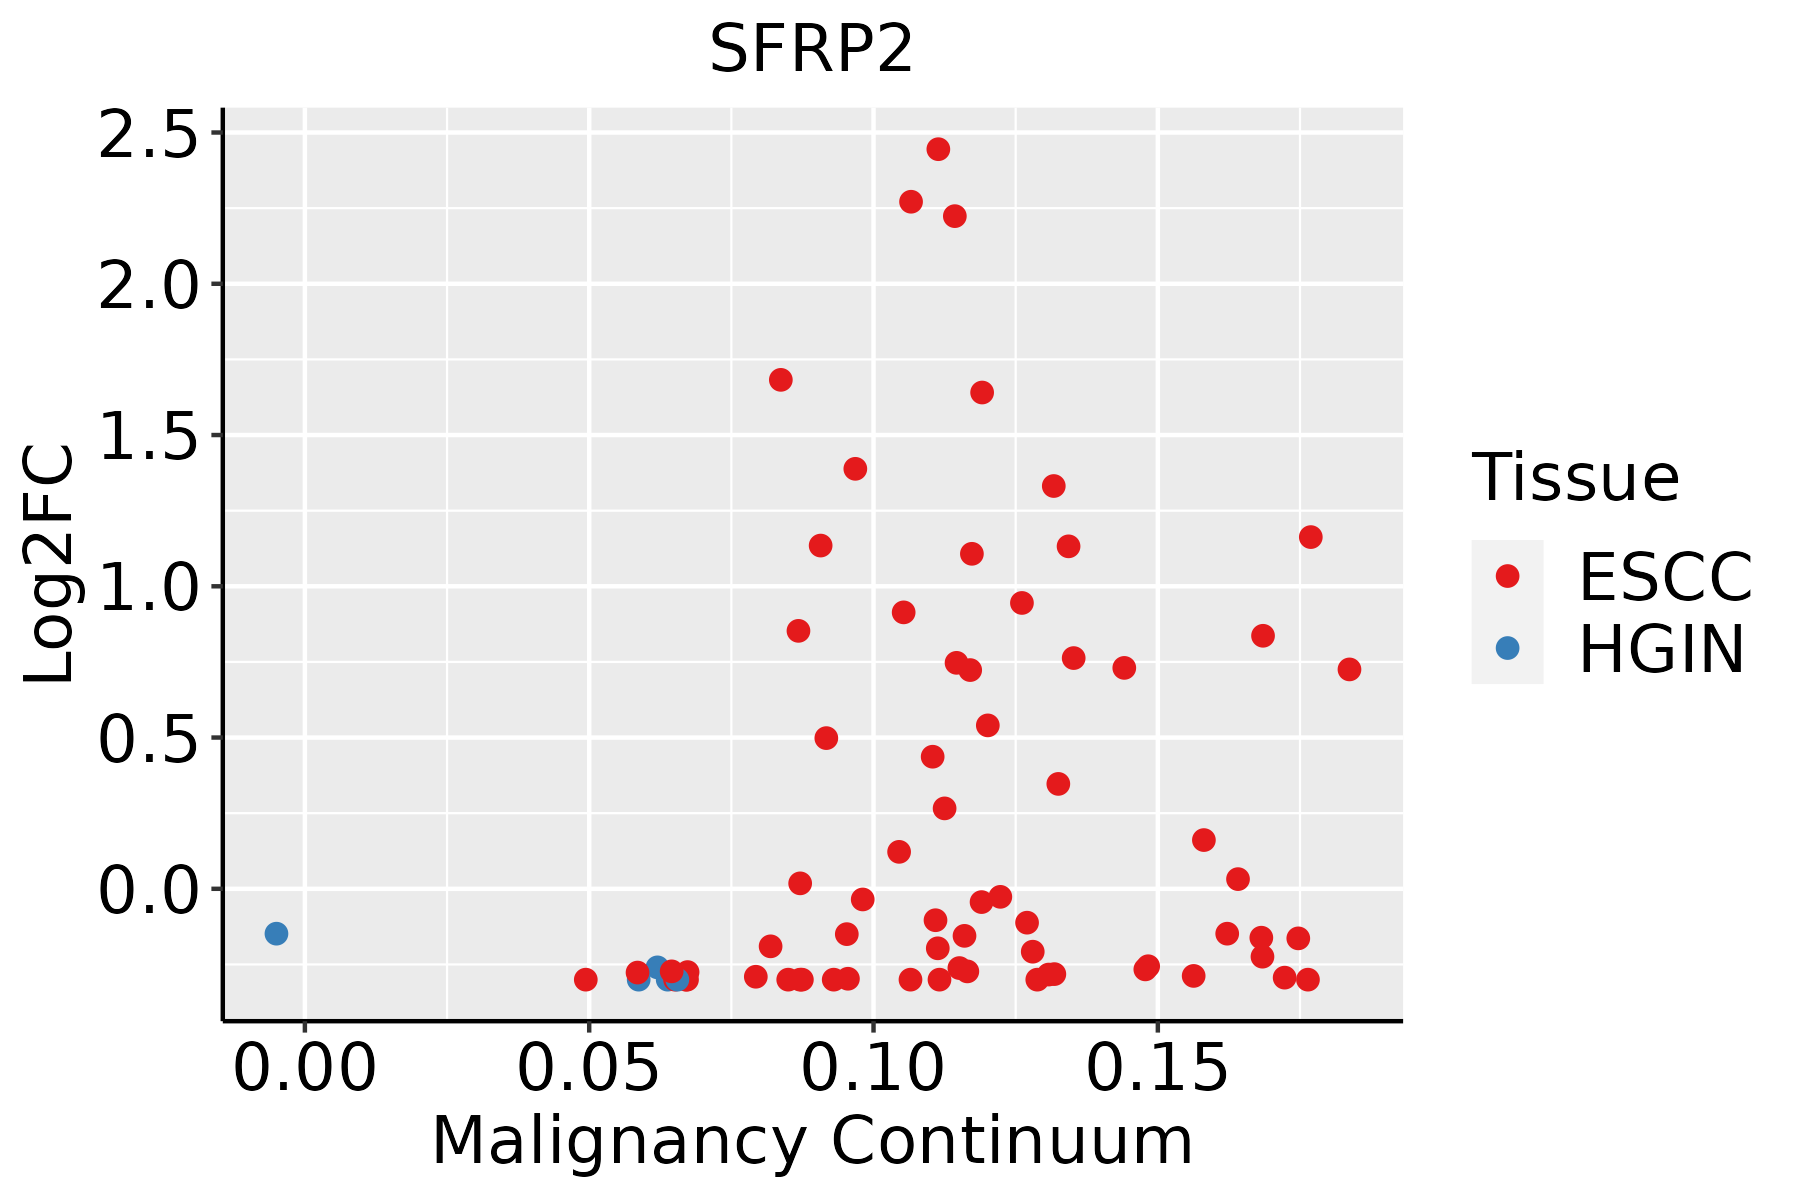 | ESCC: Esophageal squamous cell carcinoma |
| HGIN: High-grade intraepithelial neoplasias | ||
| LGIN: Low-grade intraepithelial neoplasias | ||
| Oral Cavity | 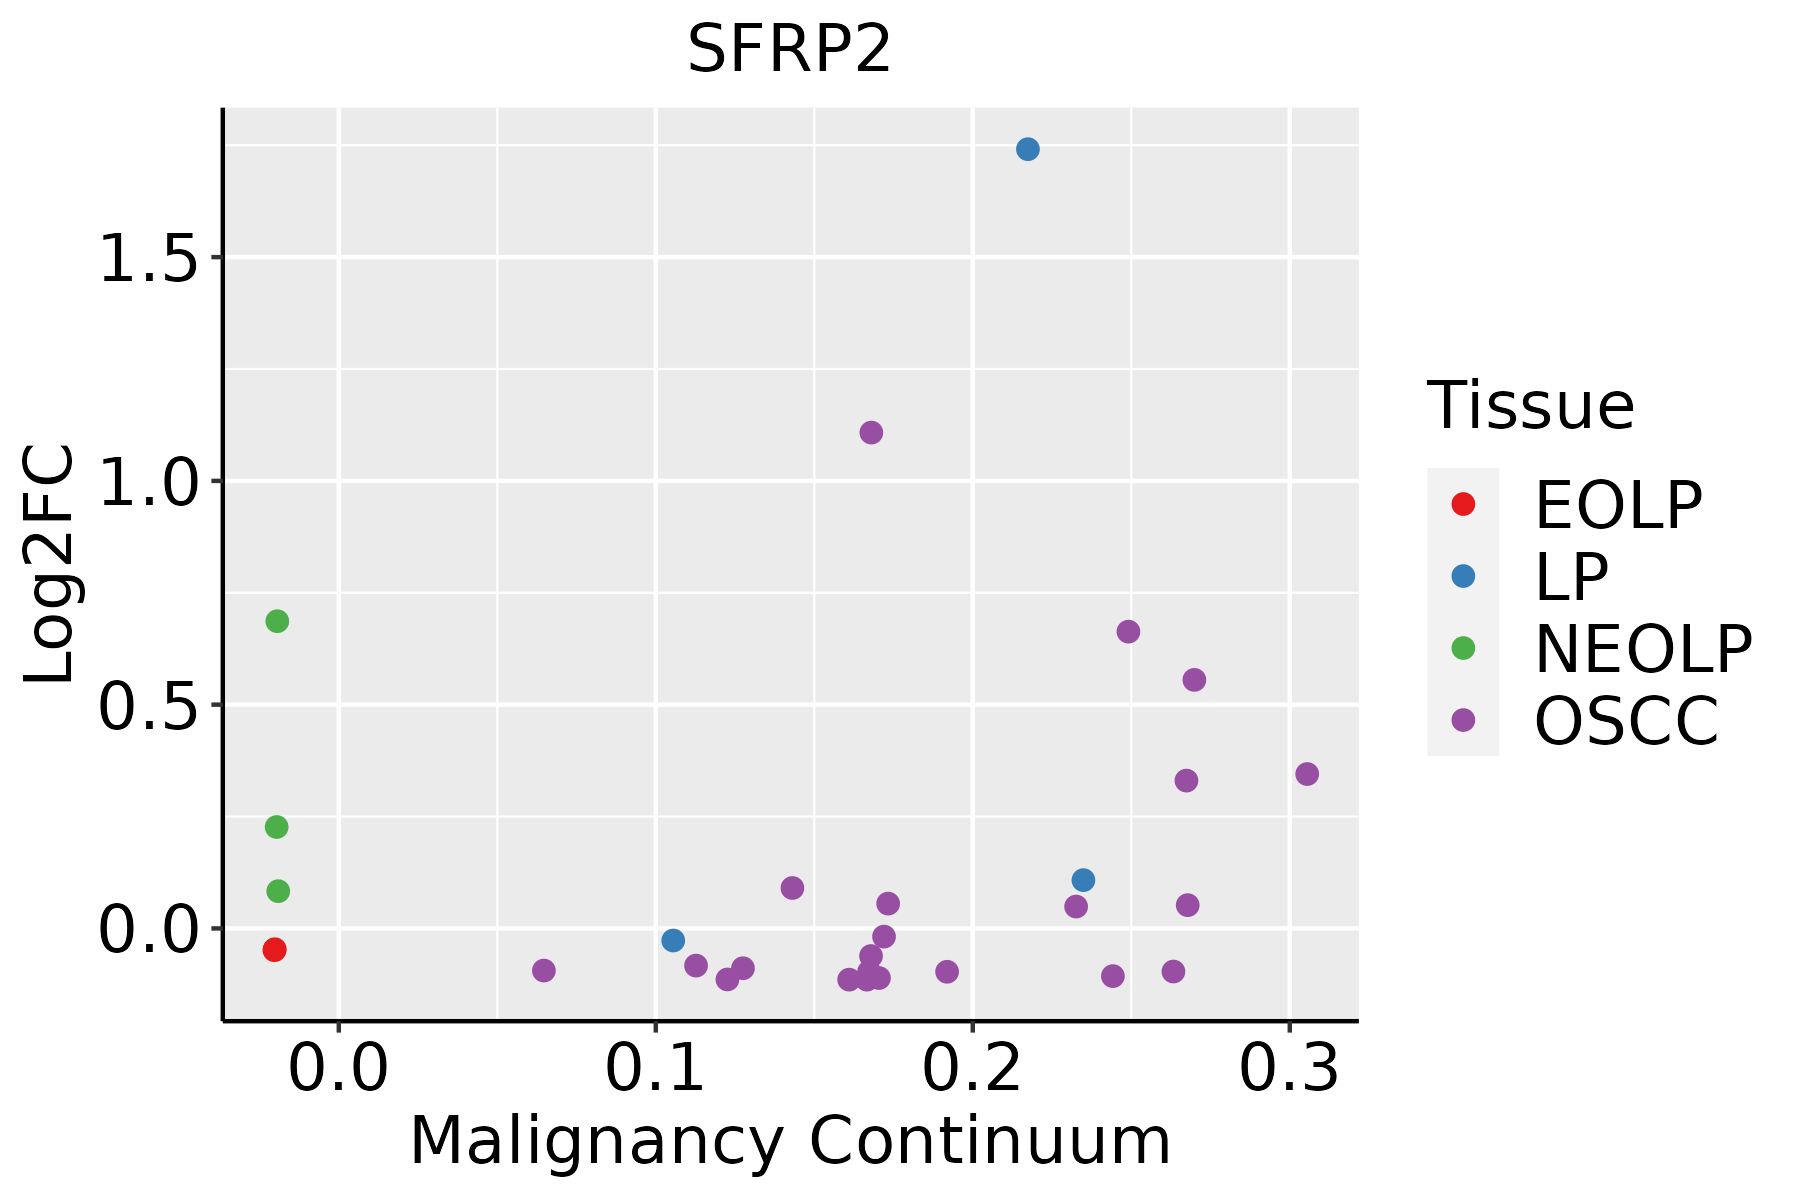 | EOLP: Erosive Oral lichen planus |
| LP: leukoplakia | ||
| NEOLP: Non-erosive oral lichen planus | ||
| OSCC: Oral squamous cell carcinoma | ||
| Skin |  | AK: Actinic keratosis |
| cSCC: Cutaneous squamous cell carcinoma | ||
| SCCIS:squamous cell carcinoma in situ |
| ∗log2FC in expression of this searched gene in stem-like cells from each diseased tissue sample relative to stem-like cells in normal samples in each tissue plotted against the malignancy continuum. Samples are colored based on if they are from different disease stage. |
Top |
Malignant transformation related pathway analysis |
| Find out the enriched GO biological processes and KEGG pathways involved in transition from healthy to precancer to cancer |
| Tissue | Disease Stage | Enriched GO biological Processes |
| Colorectum | AD |  |
| Colorectum | SER |  |
| Colorectum | MSS |  |
| Colorectum | MSI-H |  |
| Colorectum | FAP |  |
| ∗Top 15 enriched GO BP terms are showed in the bar plot of each disease state in each tissue. Each row represents a significant GO biological process which is colored according to the -log10(p.adjust). |
| Page: 1 2 3 4 5 6 7 8 9 |
| GO ID | Tissue | Disease Stage | Description | Gene Ratio | Bg Ratio | pvalue | p.adjust | Count |
| GO:0097193111 | Esophagus | ESCC | intrinsic apoptotic signaling pathway | 222/8552 | 288/18723 | 5.87e-28 | 2.02e-25 | 222 |
| GO:2001233111 | Esophagus | ESCC | regulation of apoptotic signaling pathway | 256/8552 | 356/18723 | 4.11e-24 | 1.04e-21 | 256 |
| GO:0045862111 | Esophagus | ESCC | positive regulation of proteolysis | 256/8552 | 372/18723 | 7.88e-20 | 9.43e-18 | 256 |
| GO:2001242111 | Esophagus | ESCC | regulation of intrinsic apoptotic signaling pathway | 128/8552 | 164/18723 | 1.75e-17 | 1.50e-15 | 128 |
| GO:0097191111 | Esophagus | ESCC | extrinsic apoptotic signaling pathway | 159/8552 | 219/18723 | 4.12e-16 | 2.94e-14 | 159 |
| GO:2001234111 | Esophagus | ESCC | negative regulation of apoptotic signaling pathway | 161/8552 | 224/18723 | 1.24e-15 | 8.09e-14 | 161 |
| GO:0071496111 | Esophagus | ESCC | cellular response to external stimulus | 215/8552 | 320/18723 | 4.29e-15 | 2.43e-13 | 215 |
| GO:0031668111 | Esophagus | ESCC | cellular response to extracellular stimulus | 168/8552 | 246/18723 | 4.93e-13 | 2.23e-11 | 168 |
| GO:001021217 | Esophagus | ESCC | response to ionizing radiation | 110/8552 | 148/18723 | 1.11e-12 | 4.78e-11 | 110 |
| GO:0010563111 | Esophagus | ESCC | negative regulation of phosphorus metabolic process | 274/8552 | 442/18723 | 2.32e-12 | 9.41e-11 | 274 |
| GO:2001236111 | Esophagus | ESCC | regulation of extrinsic apoptotic signaling pathway | 111/8552 | 151/18723 | 2.97e-12 | 1.18e-10 | 111 |
| GO:0045936111 | Esophagus | ESCC | negative regulation of phosphate metabolic process | 273/8552 | 441/18723 | 3.18e-12 | 1.25e-10 | 273 |
| GO:2001243111 | Esophagus | ESCC | negative regulation of intrinsic apoptotic signaling pathway | 78/8552 | 98/18723 | 5.50e-12 | 2.10e-10 | 78 |
| GO:0031667111 | Esophagus | ESCC | response to nutrient levels | 289/8552 | 474/18723 | 9.25e-12 | 3.47e-10 | 289 |
| GO:0051348111 | Esophagus | ESCC | negative regulation of transferase activity | 177/8552 | 268/18723 | 1.08e-11 | 4.00e-10 | 177 |
| GO:007190016 | Esophagus | ESCC | regulation of protein serine/threonine kinase activity | 227/8552 | 359/18723 | 1.12e-11 | 4.10e-10 | 227 |
| GO:0008630110 | Esophagus | ESCC | intrinsic apoptotic signaling pathway in response to DNA damage | 78/8552 | 99/18723 | 1.43e-11 | 5.08e-10 | 78 |
| GO:2000116111 | Esophagus | ESCC | regulation of cysteine-type endopeptidase activity | 158/8552 | 235/18723 | 1.67e-11 | 5.90e-10 | 158 |
| GO:0043281111 | Esophagus | ESCC | regulation of cysteine-type endopeptidase activity involved in apoptotic process | 143/8552 | 209/18723 | 2.12e-11 | 7.31e-10 | 143 |
| GO:000931419 | Esophagus | ESCC | response to radiation | 277/8552 | 456/18723 | 4.42e-11 | 1.43e-09 | 277 |
| Page: 1 2 3 4 5 6 7 8 9 10 11 12 13 14 15 16 17 18 19 20 21 22 23 24 25 26 27 28 29 30 31 32 33 34 35 36 37 38 39 40 41 |
| Pathway ID | Tissue | Disease Stage | Description | Gene Ratio | Bg Ratio | pvalue | p.adjust | qvalue | Count |
| hsa0431024 | Oral cavity | NEOLP | Wnt signaling pathway | 34/1112 | 171/8465 | 8.05e-03 | 2.88e-02 | 1.81e-02 | 34 |
| hsa0431034 | Oral cavity | NEOLP | Wnt signaling pathway | 34/1112 | 171/8465 | 8.05e-03 | 2.88e-02 | 1.81e-02 | 34 |
| Page: 1 |
Top |
Cell-cell communication analysis |
| Identification of potential cell-cell interactions between two cell types and their ligand-receptor pairs for different disease states |
| Ligand | Receptor | LRpair | Pathway | Tissue | Disease Stage |
| Page: 1 |
Top |
Single-cell gene regulatory network inference analysis |
| Find out the significant the regulons (TFs) and the target genes of each regulon across cell types for different disease states |
| TF | Cell Type | Tissue | Disease Stage | Target Gene | RSS | Regulon Activity |
| ∗The dot plots of a searched regulon are shown for all cell subpopulations in each disease state of each tissue based on the regulon specific score inferred using pySCENIC and by calculating the average expression. |
| Page: 1 |
Top |
Somatic mutation of malignant transformation related genes |
| Annotation of somatic variants for genes involved in malignant transformation |
| Hugo Symbol | Variant Class | Variant Classification | dbSNP RS | HGVSc | HGVSp | HGVSp Short | SWISSPROT | BIOTYPE | SIFT | PolyPhen | Tumor Sample Barcode | Tissue | Histology | Sex | Age | Stage | Therapy Types | Drugs | Outcome |
| SFRP2 | SNV | Missense_Mutation | novel | c.849N>G | p.Phe283Leu | p.F283L | Q96HF1 | protein_coding | tolerated(1) | benign(0.313) | TCGA-B6-A3ZX-01 | Breast | breast invasive carcinoma | Female | <65 | III/IV | Chemotherapy | cyclophosphamide | PD |
| SFRP2 | insertion | Nonsense_Mutation | novel | c.772_773insAACTGTGACTTGGGTCTGGTTGGTTGTTGTTTGTTGTTTTGAG | p.Leu258GlnfsTer3 | p.L258Qfs*3 | Q96HF1 | protein_coding | TCGA-A8-A08H-01 | Breast | breast invasive carcinoma | Female | >=65 | I/II | Unknown | Unknown | SD | ||
| SFRP2 | SNV | Missense_Mutation | rs774857018 | c.871N>T | p.Arg291Cys | p.R291C | Q96HF1 | protein_coding | deleterious(0.01) | probably_damaging(0.943) | TCGA-A6-3810-01 | Colorectum | colon adenocarcinoma | Male | <65 | I/II | Unknown | Unknown | SD |
| SFRP2 | SNV | Missense_Mutation | c.866N>A | p.Ser289Asn | p.S289N | Q96HF1 | protein_coding | tolerated(0.06) | benign(0.076) | TCGA-CM-4743-01 | Colorectum | colon adenocarcinoma | Male | >=65 | I/II | Chemotherapy | capecitabine | SD | |
| SFRP2 | SNV | Missense_Mutation | rs778665160 | c.763N>A | p.Ala255Thr | p.A255T | Q96HF1 | protein_coding | tolerated(0.3) | benign(0.028) | TCGA-D5-6930-01 | Colorectum | colon adenocarcinoma | Male | >=65 | I/II | Unknown | Unknown | SD |
| SFRP2 | SNV | Missense_Mutation | c.99N>A | p.Phe33Leu | p.F33L | Q96HF1 | protein_coding | tolerated(1) | benign(0.007) | TCGA-AG-A002-01 | Colorectum | rectum adenocarcinoma | Male | <65 | I/II | Unknown | Unknown | SD | |
| SFRP2 | SNV | Missense_Mutation | novel | c.31C>T | p.Leu11Phe | p.L11F | Q96HF1 | protein_coding | deleterious(0.02) | benign(0.054) | TCGA-A5-A0G2-01 | Endometrium | uterine corpus endometrioid carcinoma | Female | <65 | III/IV | Unknown | Unknown | SD |
| SFRP2 | SNV | Missense_Mutation | rs767842776 | c.265C>T | p.Pro89Ser | p.P89S | Q96HF1 | protein_coding | tolerated(0.52) | benign(0.158) | TCGA-A5-A2K3-01 | Endometrium | uterine corpus endometrioid carcinoma | Female | >=65 | I/II | Chemotherapy | carboplatin | SD |
| SFRP2 | SNV | Missense_Mutation | novel | c.181N>T | p.Pro61Ser | p.P61S | Q96HF1 | protein_coding | deleterious(0) | probably_damaging(0.996) | TCGA-AJ-A3EK-01 | Endometrium | uterine corpus endometrioid carcinoma | Female | <65 | I/II | Chemotherapy | carboplatin | CR |
| SFRP2 | SNV | Missense_Mutation | rs773710868 | c.623N>A | p.Arg208Gln | p.R208Q | Q96HF1 | protein_coding | deleterious(0.01) | possibly_damaging(0.546) | TCGA-AJ-A5DW-01 | Endometrium | uterine corpus endometrioid carcinoma | Female | <65 | I/II | Unknown | Unknown | SD |
| Page: 1 2 3 |
Top |
Related drugs of malignant transformation related genes |
| Identification of chemicals and drugs interact with genes involved in malignant transfromation |
| (DGIdb 4.0) |
| Entrez ID | Symbol | Category | Interaction Types | Drug Claim Name | Drug Name | PMIDs |
| Page: 1 |

Copyright 2023-Present -The University of Texas Health Science Center at Houston |