Schematic overview of the cellular and molecular mechanisms involved in the cancer progression, including the proposed cellular and molecular mechanisms in cancer cells trajectory. AT1: alveolar type 1 cells; AT2: alveolar type 2 cells; AAH: atypical adenomatous hyperplasia; AIS: adenocarcinoma in situ; MIA: minimally invasive adenocarcinoma; IA: invasive adenocarcinoma; EMT: epithelial-mesenchymal transition

Home

Download

Statistics

Help

Contact

Center for Computational Systems Medicine
leaf

Gene summary

leaf

Malignant transformation analysis

leaf

Malignant transformation related pathway analysis

leaf

Cell-cell communication analysis

leaf

Single-cell gene regulatory network inference analysis

leaf

Somatic mutation of malignant transformation related genes

leaf

Related drugs of malignant transformation related genes

Gene: SFPQ

Gene summary for SFPQ

check button Gene summary.

Gene informationSpeciesHuman
Gene symbol

SFPQ

Gene ID

6421

Gene namesplicing factor proline and glutamine rich
Gene AliasPOMP100
Cytomap1p34.3
Gene Typeprotein-coding
GO ID

GO:0000122

UniProtAcc

P23246


Top

Malignant transformation analysis

check button Identification of the aberrant gene expression in precancerous and cancerous lesions by comparing the gene expression of stem-like cells in diseased tissues with normal stem cells
check button Malignant transformation involving gene list.
Entrez IDSymbolReplicatesSpeciesOrganTissueAdj P-valueLog2FCMalignancy
6421SFPQGSM4909286HumanBreastIDC2.83e-067.76e-020.1081
6421SFPQGSM4909293HumanBreastIDC1.70e-072.70e-010.1581
6421SFPQGSM4909296HumanBreastIDC7.89e-10-3.97e-010.1524
6421SFPQGSM4909297HumanBreastIDC3.95e-13-2.04e-010.1517
6421SFPQGSM4909298HumanBreastIDC1.49e-021.14e-010.1551
6421SFPQGSM4909311HumanBreastIDC1.36e-29-4.42e-010.1534
6421SFPQGSM4909312HumanBreastIDC8.72e-06-9.09e-020.1552
6421SFPQGSM4909313HumanBreastIDC1.82e-04-3.24e-010.0391
6421SFPQGSM4909316HumanBreastIDC1.62e-02-3.71e-010.21
6421SFPQGSM4909317HumanBreastIDC2.42e-022.65e-010.1355
6421SFPQGSM4909319HumanBreastIDC1.77e-38-5.44e-010.1563
6421SFPQGSM4909320HumanBreastIDC1.98e-06-5.03e-010.1575
6421SFPQGSM4909321HumanBreastIDC6.70e-14-3.72e-010.1559
6421SFPQbrca10HumanBreastPrecancer1.91e-10-4.91e-01-0.0029
6421SFPQNCCBC14HumanBreastDCIS4.45e-07-2.57e-010.2021
6421SFPQNCCBC2HumanBreastDCIS3.57e-02-6.31e-020.1554
6421SFPQNCCBC5HumanBreastDCIS1.32e-08-1.48e-010.2046
6421SFPQP1HumanBreastIDC2.80e-16-9.63e-020.1527
6421SFPQDCIS2HumanBreastDCIS9.40e-524.32e-010.0085
6421SFPQHTA11_99999970781_79442HumanColorectumMSS1.34e-066.51e-010.294
Page: 1 2 3 4 5 6 7 8 9 10 11 12 13 

check button Transcriptomic changes along malignancy continuum.
TissueExpression DynamicsAbbreviation
BreastThe image shows the transcriptomic changes along malignancy continuum.log2FC in expression of this searched gene in stem-like cells from each diseased tissue sample relative to stem-like cells in normal samples in each tissue plotted against the malignancy continuum. Samples are colored based on if they are from different disease stage.
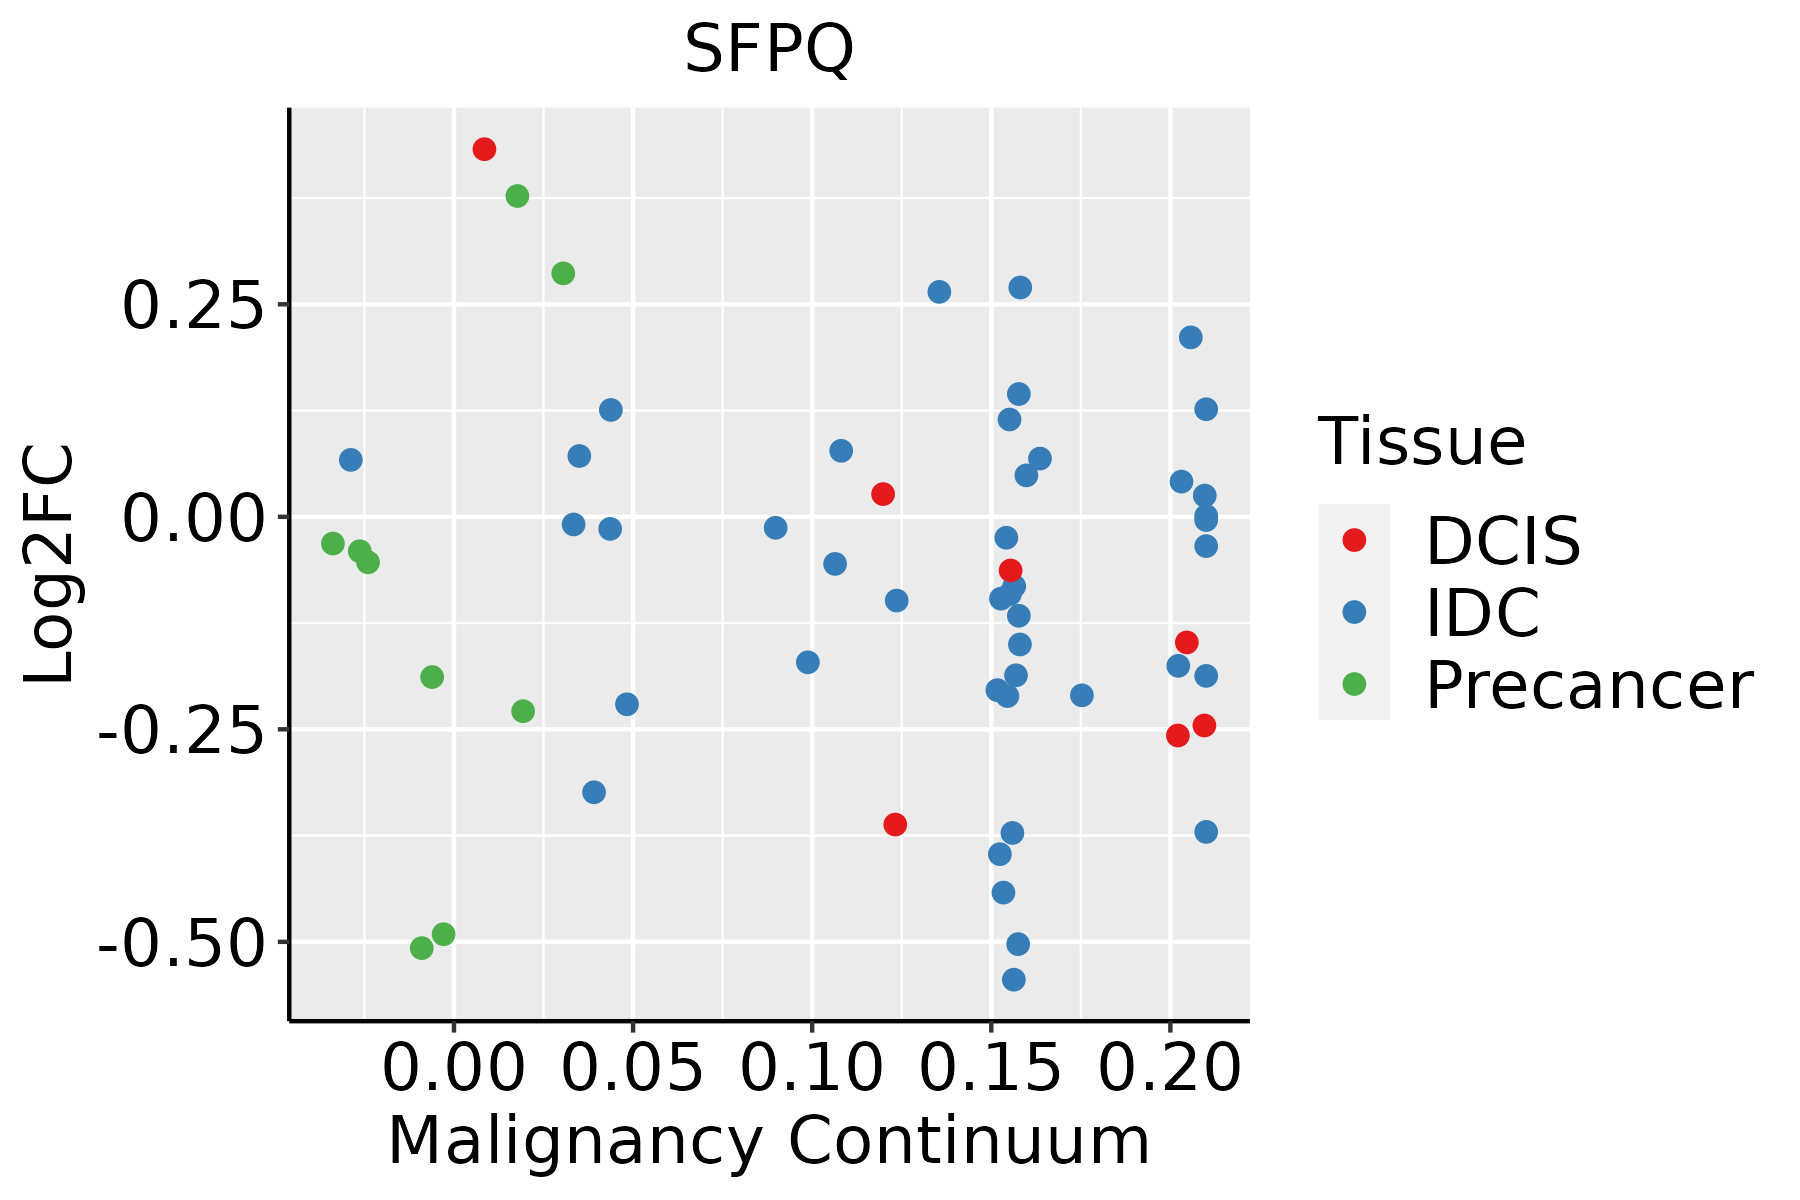
IDC: Invasive ductal carcinoma
DCIS: Ductal carcinoma in situ
Precancer(BRCA1-mut): Precancerous lesion from BRCA1 mutation carriers
Colorectum (GSE201348)The image shows the transcriptomic changes along malignancy continuum.log2FC in expression of this searched gene in stem-like cells from each diseased tissue sample relative to stem-like cells in normal samples in each tissue plotted against the malignancy continuum. Samples are colored based on if they are from different disease stage.FAP: Familial adenomatous polyposis
CRC: Colorectal cancer
Colorectum (HTA11)The image shows the transcriptomic changes along malignancy continuum.log2FC in expression of this searched gene in stem-like cells from each diseased tissue sample relative to stem-like cells in normal samples in each tissue plotted against the malignancy continuum. Samples are colored based on if they are from different disease stage.AD: Adenomas
SER: Sessile serrated lesions
MSI-H: Microsatellite-high colorectal cancer
MSS: Microsatellite stable colorectal cancer
EndometriumThe image shows the transcriptomic changes along malignancy continuum.log2FC in expression of this searched gene in stem-like cells from each diseased tissue sample relative to stem-like cells in normal samples in each tissue plotted against the malignancy continuum. Samples are colored based on if they are from different disease stage.AEH: Atypical endometrial hyperplasia
EEC: Endometrioid Cancer
EsophagusThe image shows the transcriptomic changes along malignancy continuum.log2FC in expression of this searched gene in stem-like cells from each diseased tissue sample relative to stem-like cells in normal samples in each tissue plotted against the malignancy continuum. Samples are colored based on if they are from different disease stage.
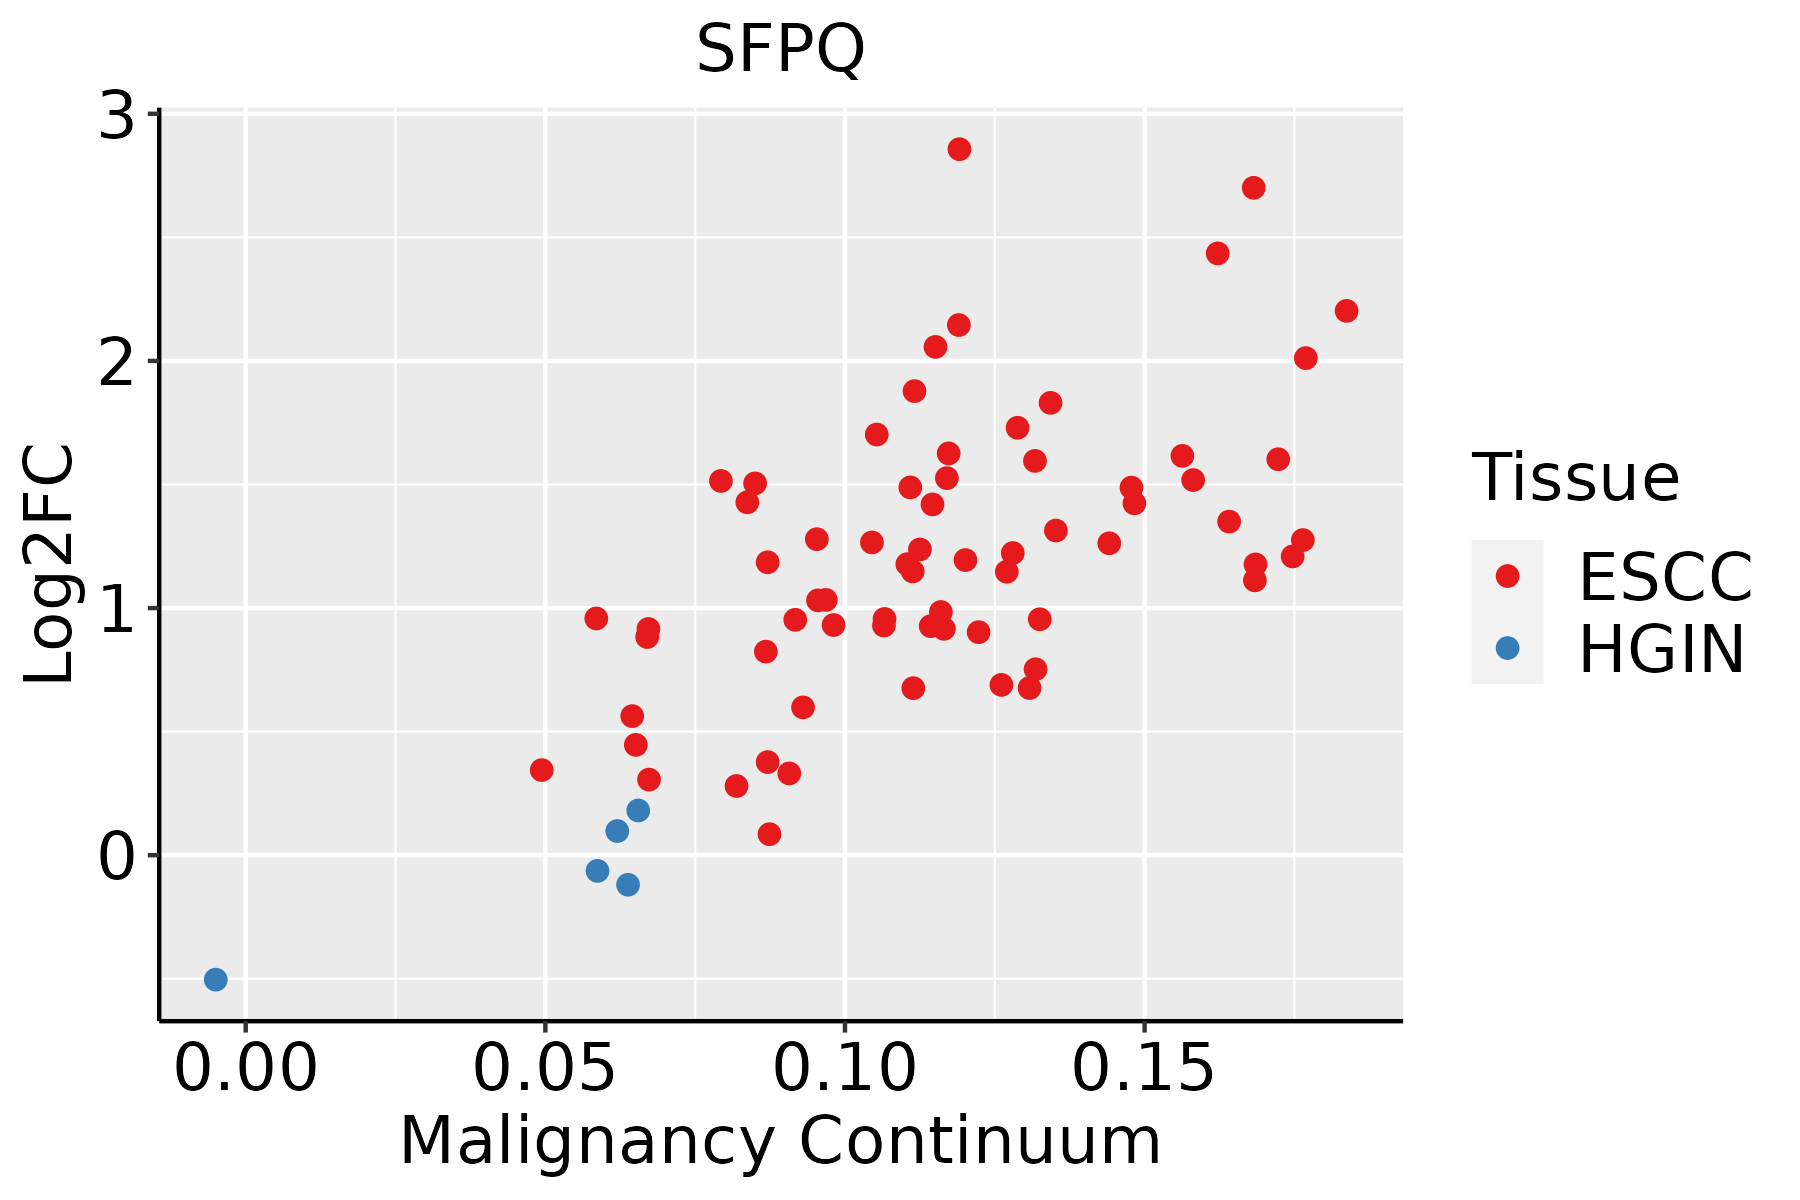
ESCC: Esophageal squamous cell carcinoma
HGIN: High-grade intraepithelial neoplasias
LGIN: Low-grade intraepithelial neoplasias
GCThe image shows the transcriptomic changes along malignancy continuum.log2FC in expression of this searched gene in stem-like cells from each diseased tissue sample relative to stem-like cells in normal samples in each tissue plotted against the malignancy continuum. Samples are colored based on if they are from different disease stage.
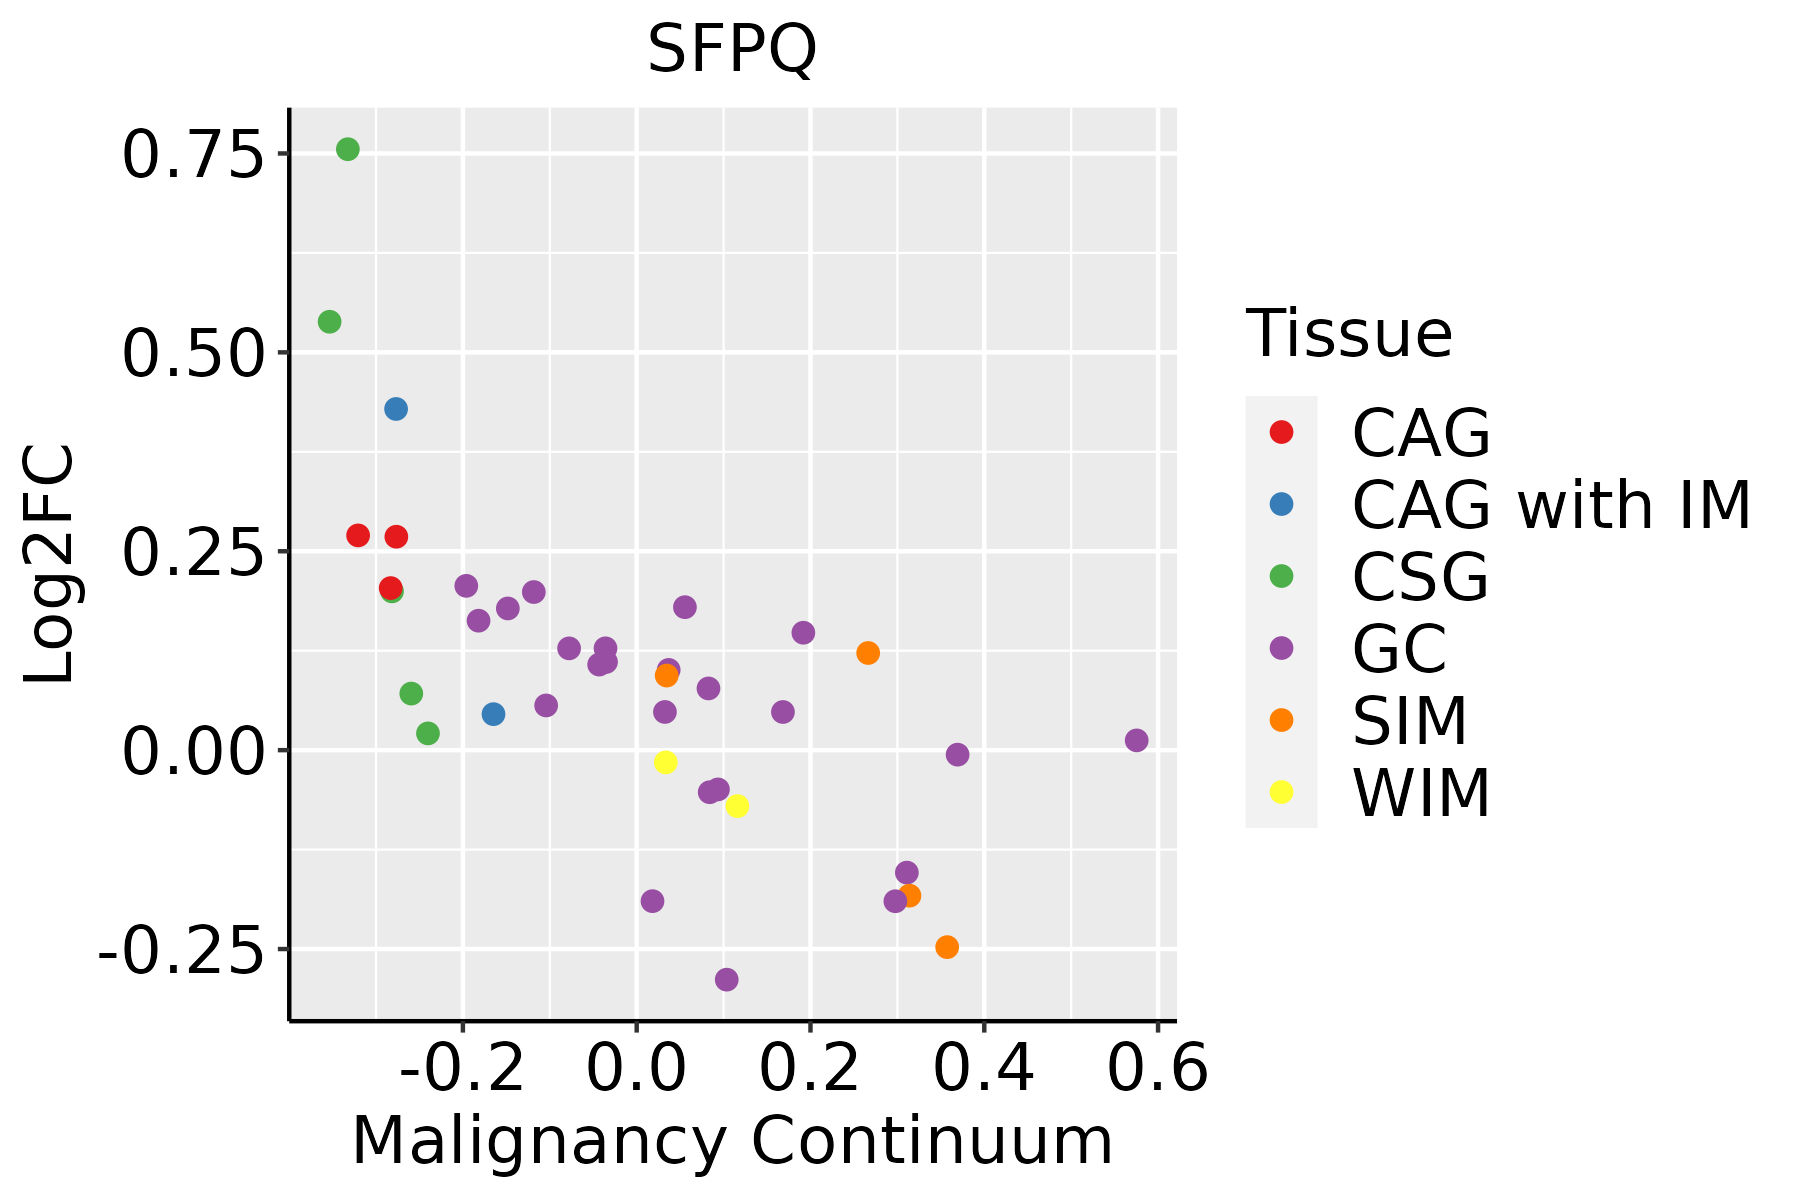
CAG: Chronic atrophic gastritis
CAG with IM: Chronic atrophic gastritis with intestinal metaplasia
CSG: Chronic superficial gastritis
GC: Gastric cancer
SIM: Severe intestinal metaplasia
WIM: Wild intestinal metaplasia
LiverThe image shows the transcriptomic changes along malignancy continuum.log2FC in expression of this searched gene in stem-like cells from each diseased tissue sample relative to stem-like cells in normal samples in each tissue plotted against the malignancy continuum. Samples are colored based on if they are from different disease stage.
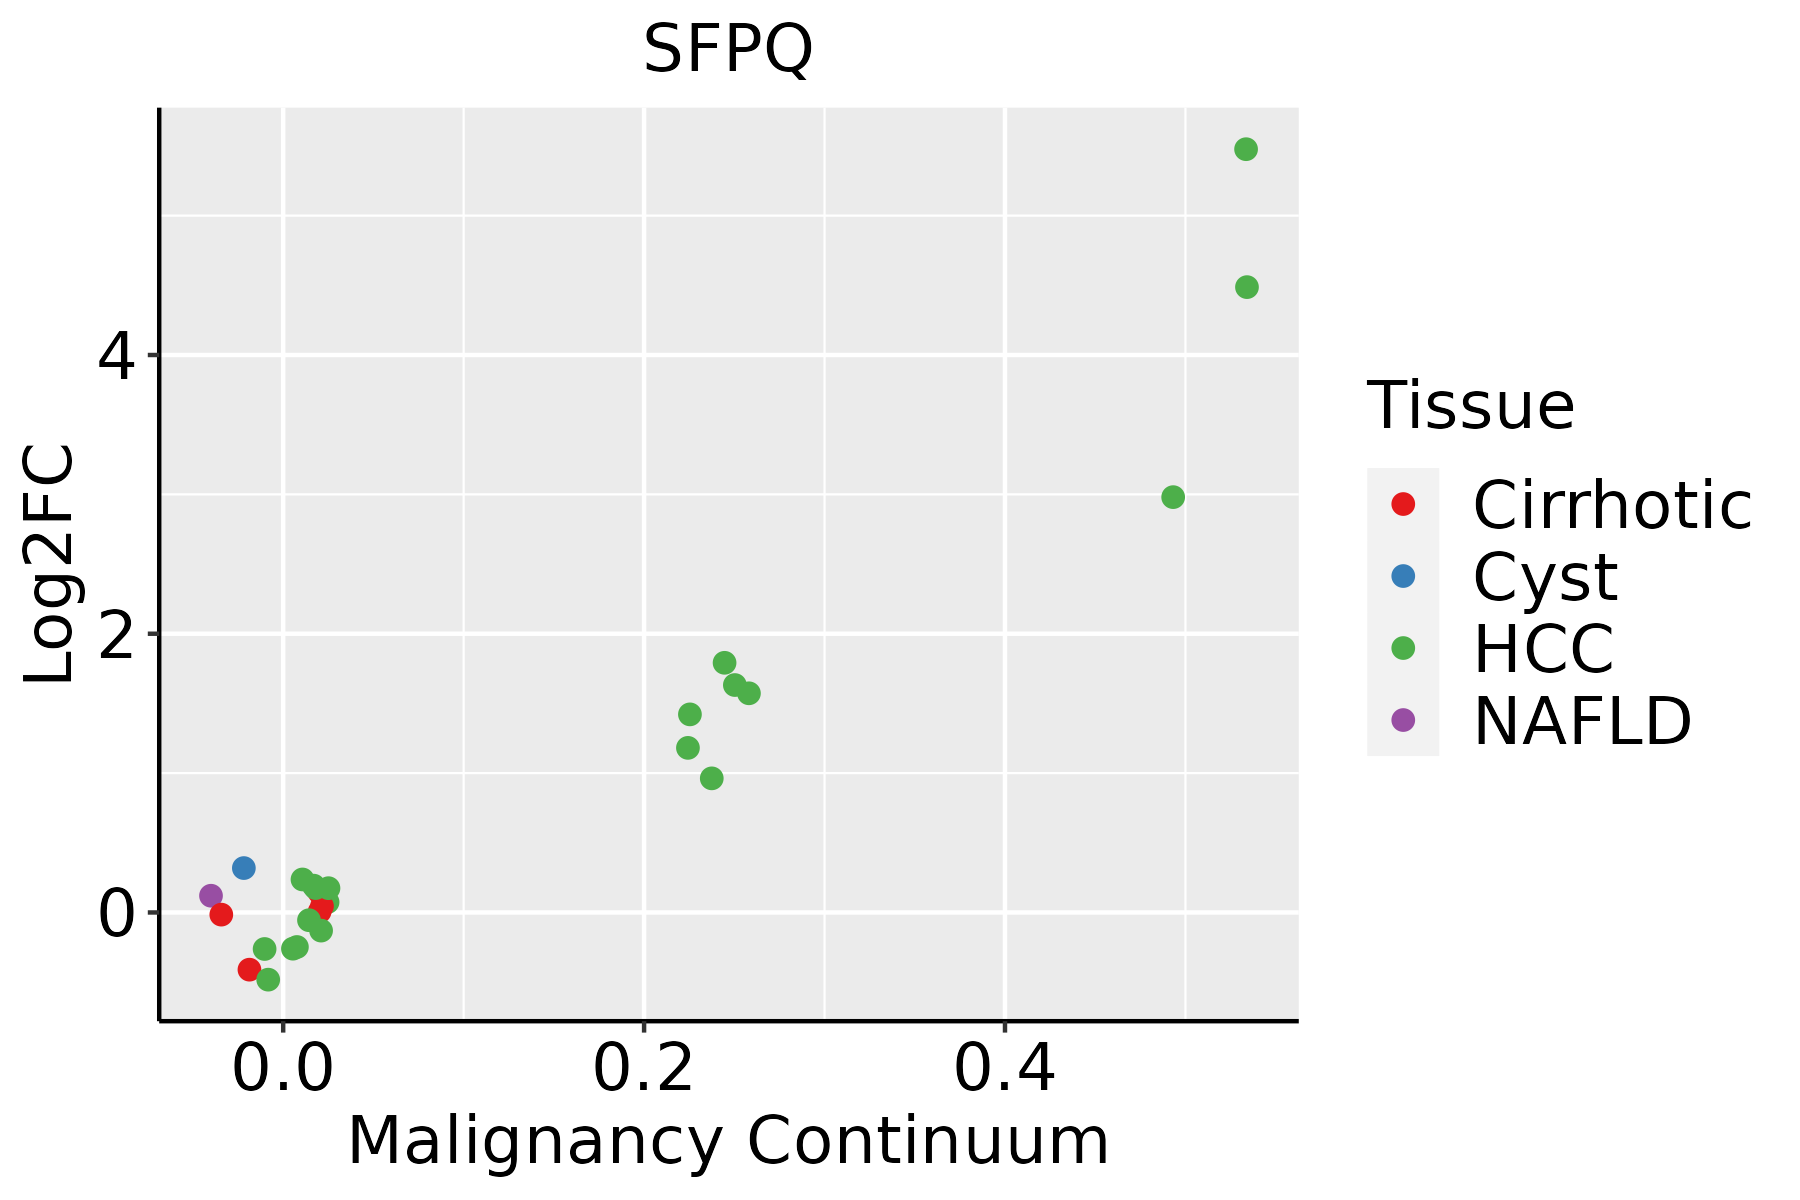
HCC: Hepatocellular carcinoma
NAFLD: Non-alcoholic fatty liver disease
Oral CavityThe image shows the transcriptomic changes along malignancy continuum.log2FC in expression of this searched gene in stem-like cells from each diseased tissue sample relative to stem-like cells in normal samples in each tissue plotted against the malignancy continuum. Samples are colored based on if they are from different disease stage.
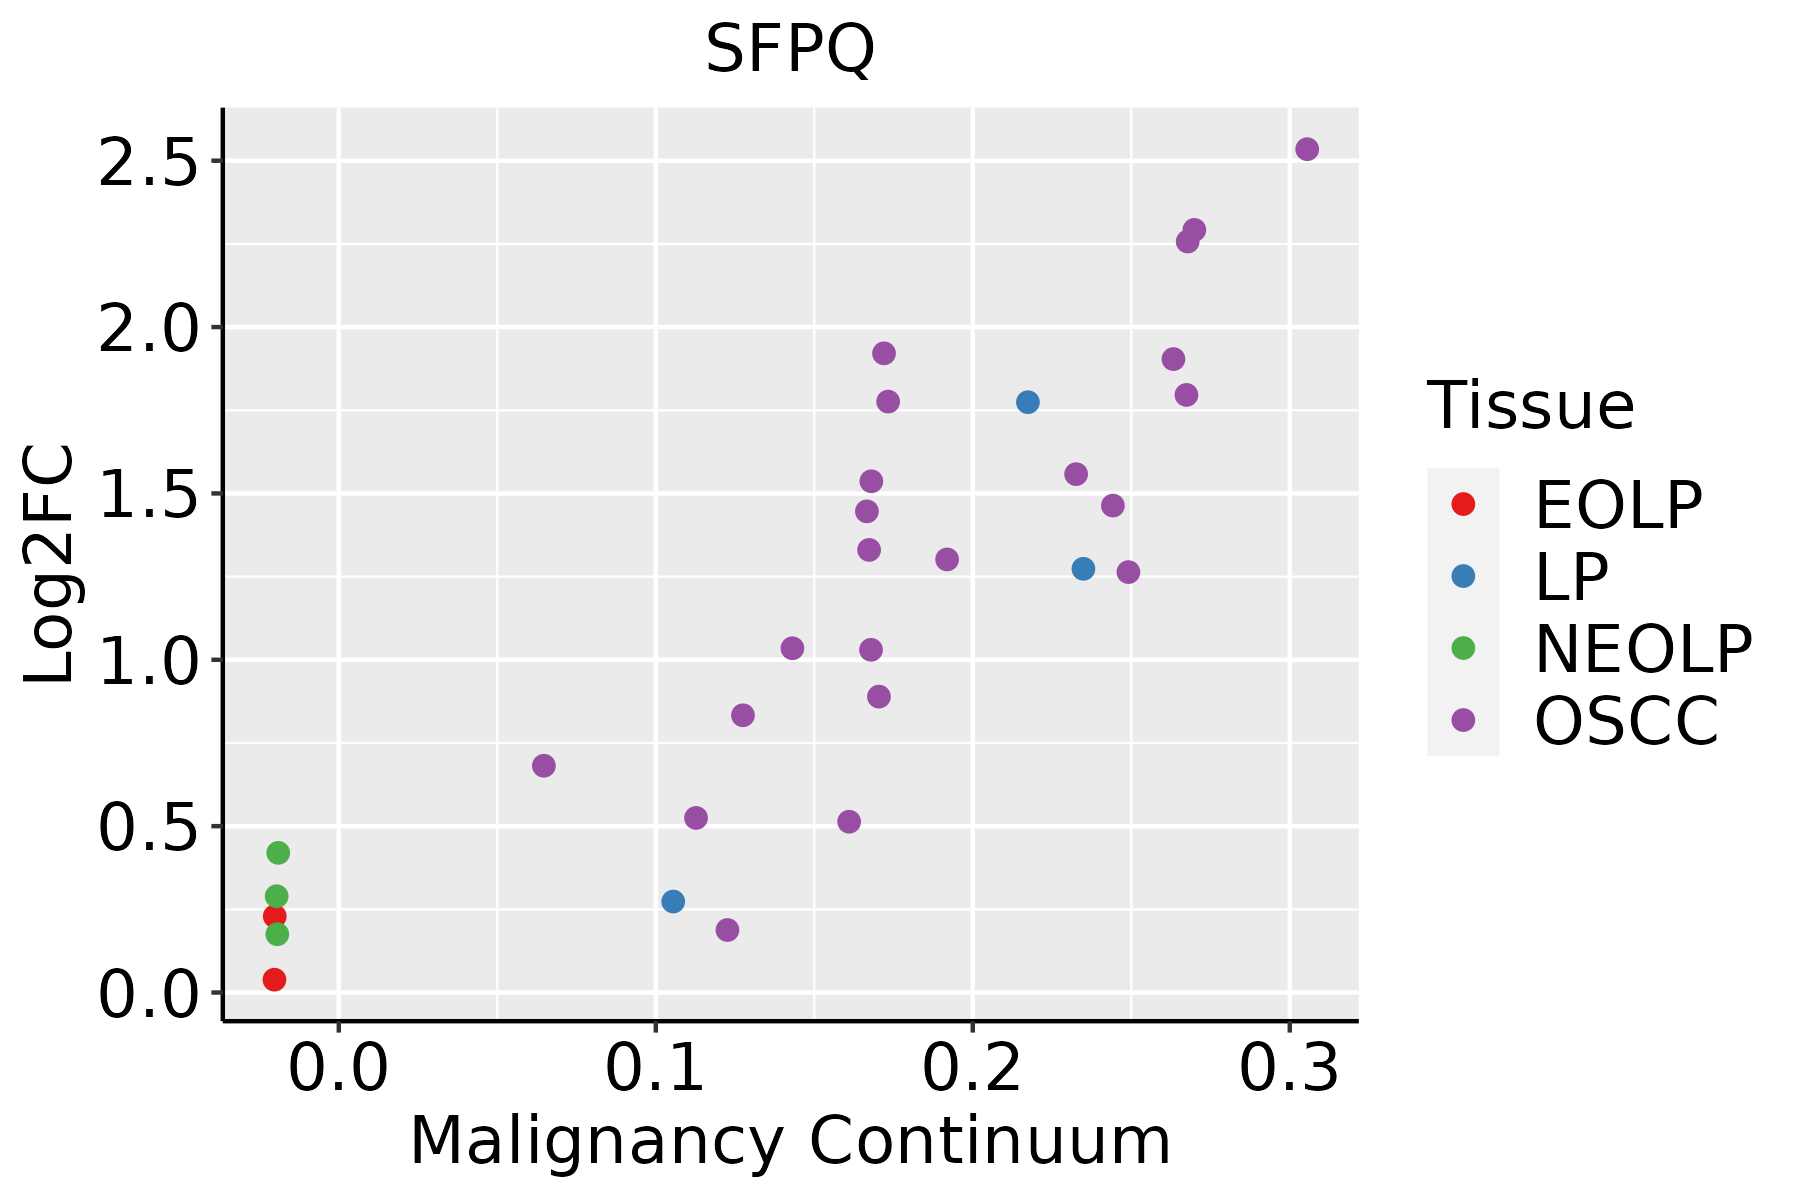
EOLP: Erosive Oral lichen planus
LP: leukoplakia
NEOLP: Non-erosive oral lichen planus
OSCC: Oral squamous cell carcinoma
ProstateThe image shows the transcriptomic changes along malignancy continuum.log2FC in expression of this searched gene in stem-like cells from each diseased tissue sample relative to stem-like cells in normal samples in each tissue plotted against the malignancy continuum. Samples are colored based on if they are from different disease stage.
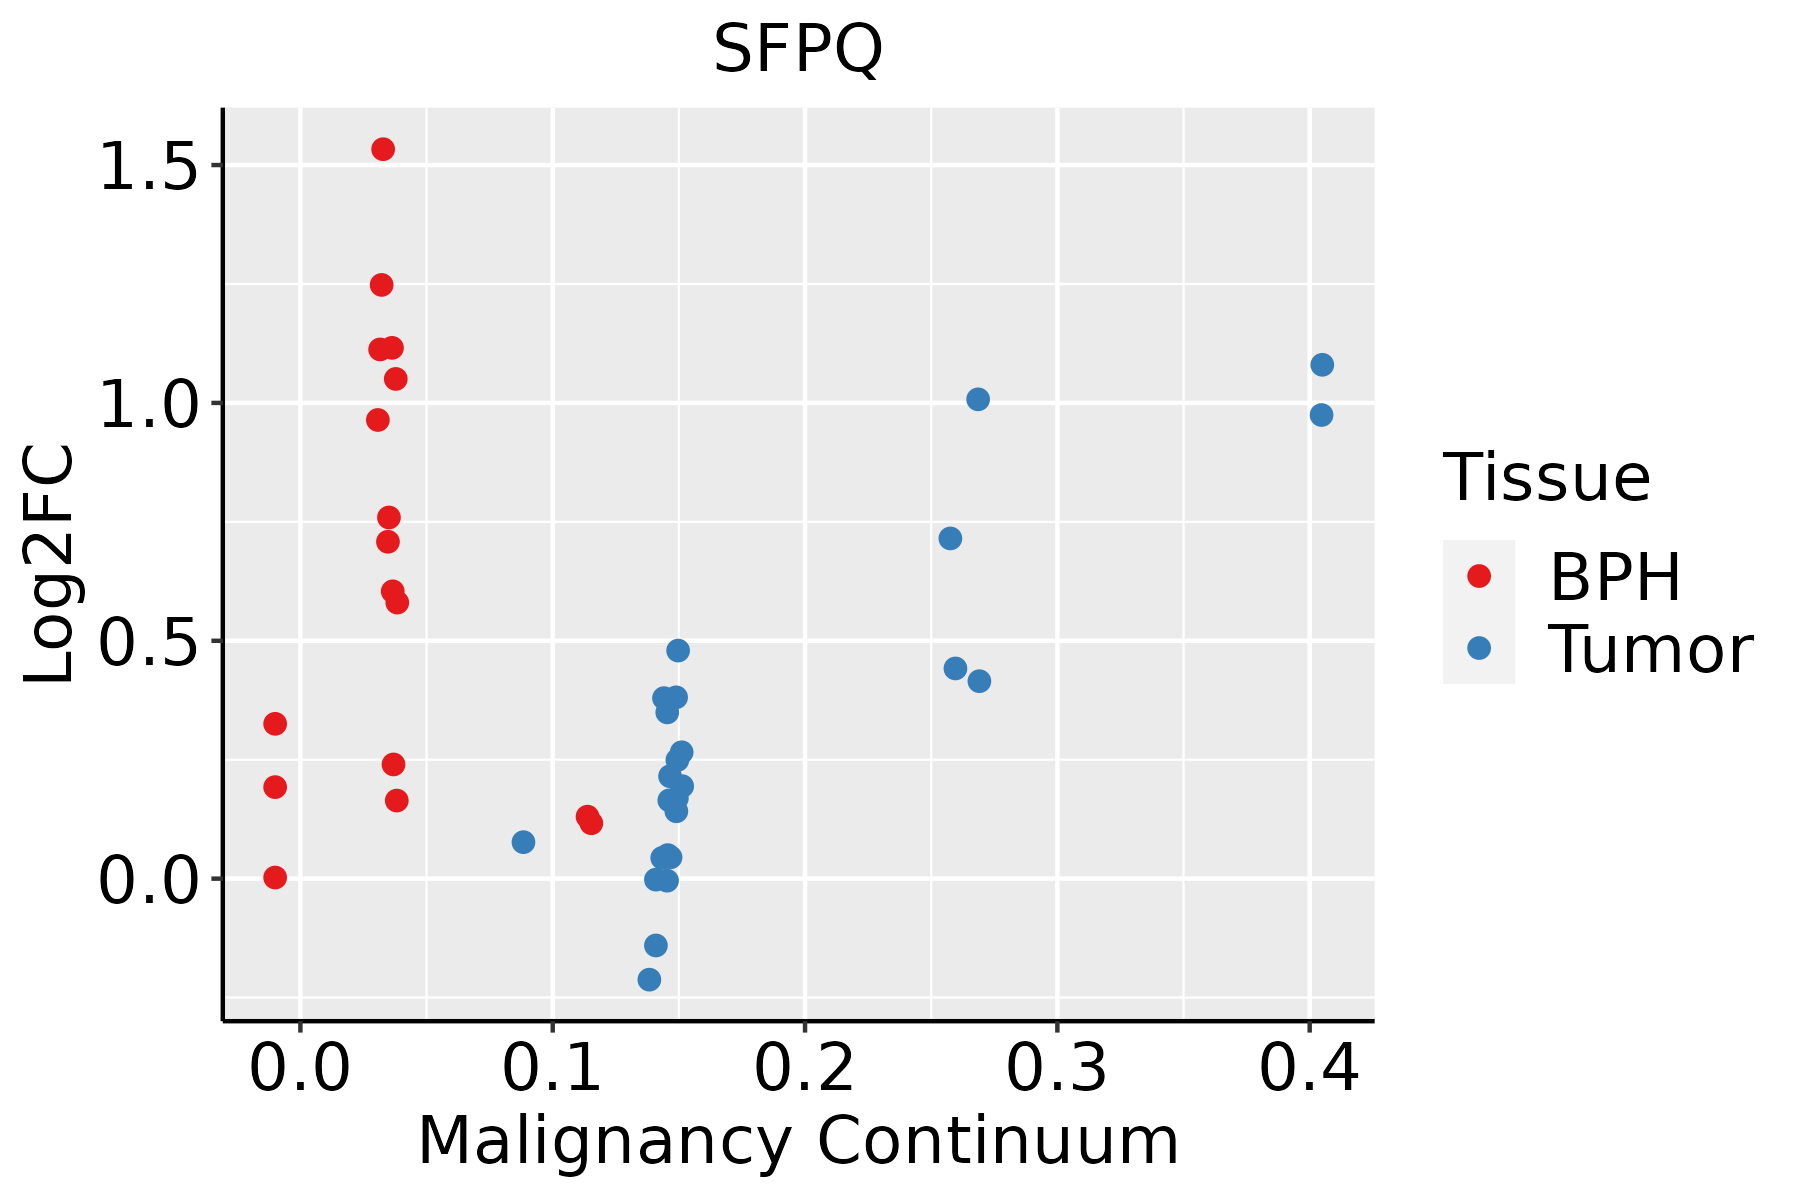
BPH: Benign Prostatic Hyperplasia
SkinThe image shows the transcriptomic changes along malignancy continuum.log2FC in expression of this searched gene in stem-like cells from each diseased tissue sample relative to stem-like cells in normal samples in each tissue plotted against the malignancy continuum. Samples are colored based on if they are from different disease stage.
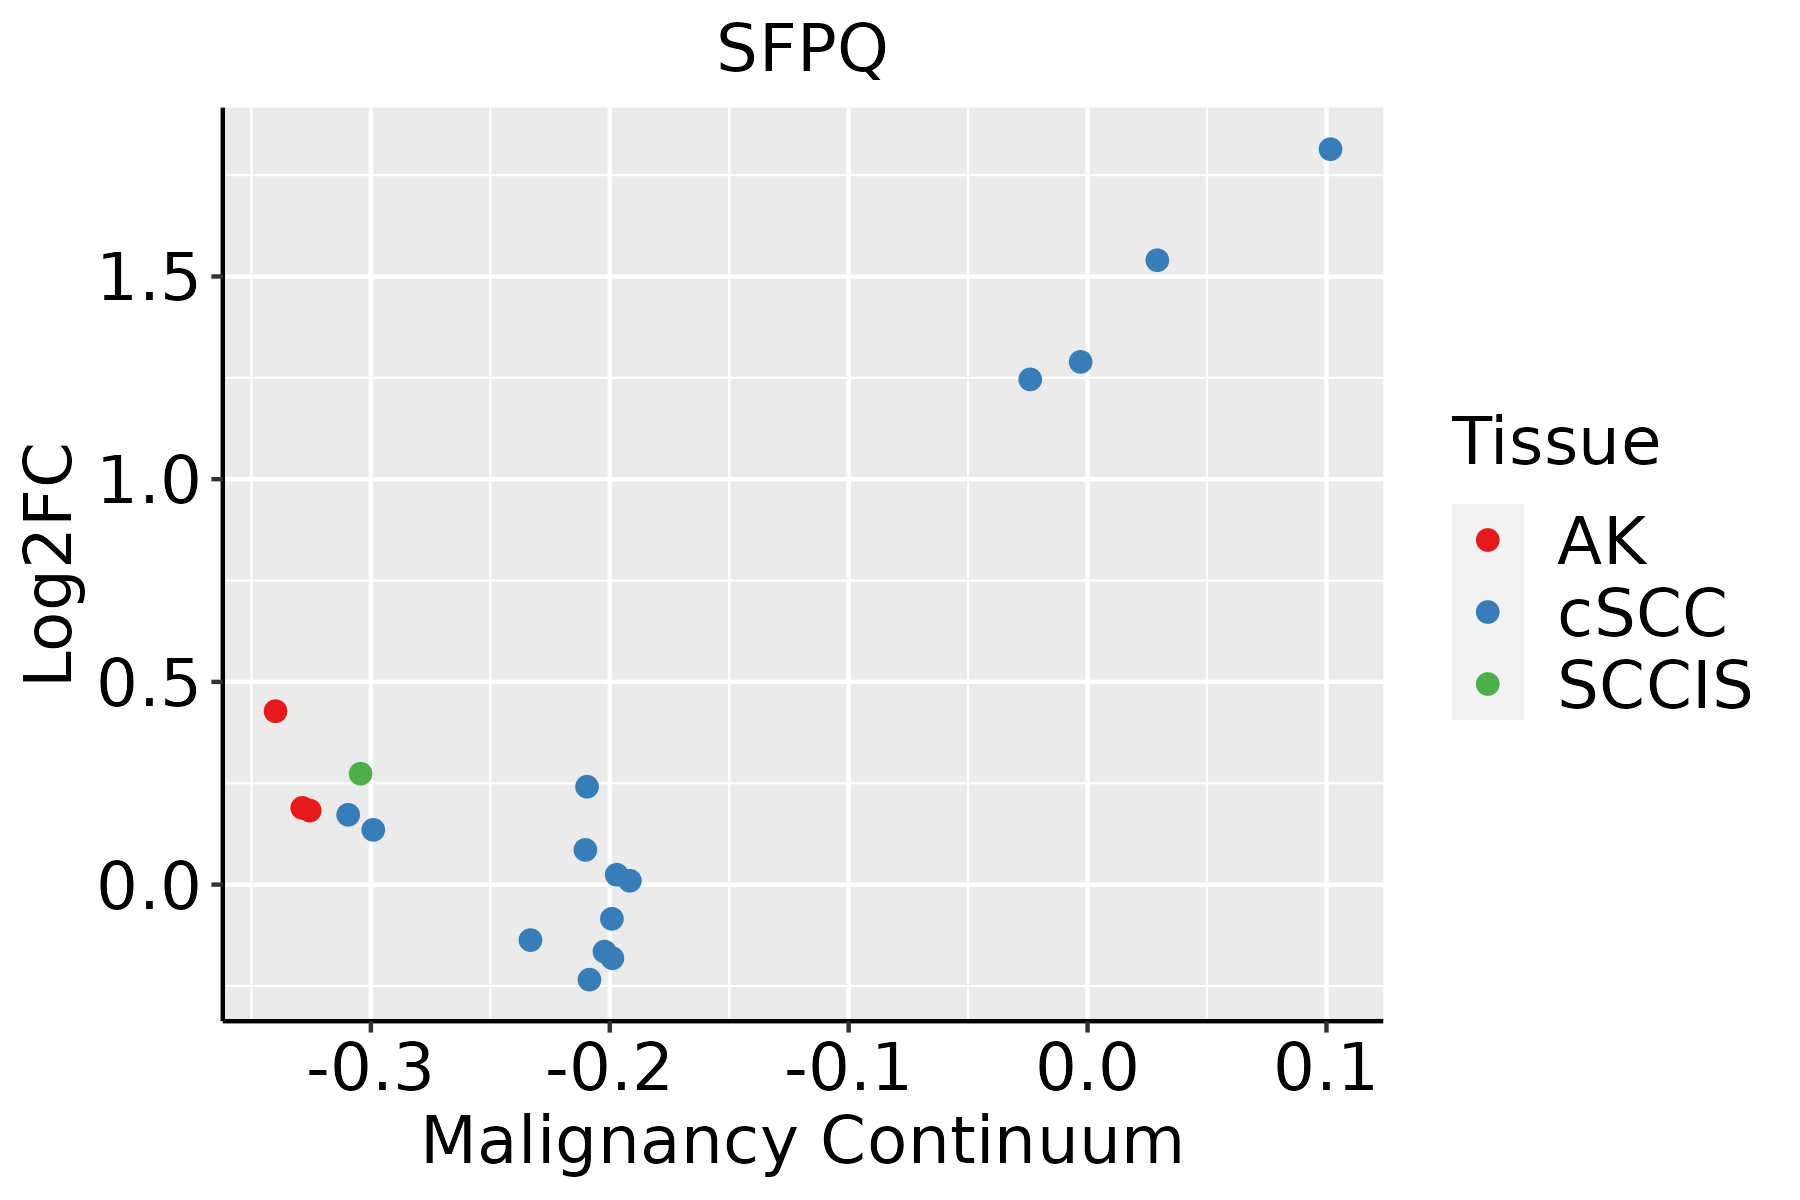
AK: Actinic keratosis
cSCC: Cutaneous squamous cell carcinoma
SCCIS:squamous cell carcinoma in situ
ThyroidThe image shows the transcriptomic changes along malignancy continuum.log2FC in expression of this searched gene in stem-like cells from each diseased tissue sample relative to stem-like cells in normal samples in each tissue plotted against the malignancy continuum. Samples are colored based on if they are from different disease stage.ATC: Anaplastic thyroid cancer
HT: Hashimoto's thyroiditis
PTC: Papillary thyroid cancer
∗log2FC in expression of this searched gene in stem-like cells from each diseased tissue sample relative to stem-like cells in normal samples in each tissue plotted against the malignancy continuum. Samples are colored based on if they are from different disease stage.

Top

Malignant transformation related pathway analysis

check buttonFind out the enriched GO biological processes and KEGG pathways involved in transition from healthy to precancer to cancer
check button Figure of enriched GO biological processes.
TissueDisease StageEnriched GO biological Processes
ColorectumADGO analysis - Figure of enriched GO biological processes: Top 15 enriched GO BP terms are showed in the bar plot of each disease state in each tissue. Each row represents a significant GO biological process which is colored according to the -log10(p.adjust).
ColorectumSERGO analysis - Figure of enriched GO biological processes: Top 15 enriched GO BP terms are showed in the bar plot of each disease state in each tissue. Each row represents a significant GO biological process which is colored according to the -log10(p.adjust).
ColorectumMSSGO analysis - Figure of enriched GO biological processes: Top 15 enriched GO BP terms are showed in the bar plot of each disease state in each tissue. Each row represents a significant GO biological process which is colored according to the -log10(p.adjust).
ColorectumMSI-HGO analysis - Figure of enriched GO biological processes: Top 15 enriched GO BP terms are showed in the bar plot of each disease state in each tissue. Each row represents a significant GO biological process which is colored according to the -log10(p.adjust).
ColorectumFAPGO analysis - Figure of enriched GO biological processes: Top 15 enriched GO BP terms are showed in the bar plot of each disease state in each tissue. Each row represents a significant GO biological process which is colored according to the -log10(p.adjust).
∗Top 15 enriched GO BP terms are showed in the bar plot of each disease state in each tissue. Each row represents a significant GO biological process which is colored according to the -log10(p.adjust).
Page: 1 2 3 4 5 6 7 8 9 

check button Enriched GO biological processes.
GO IDTissueDisease StageDescriptionGene RatioBg Ratiopvaluep.adjustCount
GO:00971939BreastPrecancerintrinsic apoptotic signaling pathway59/1080288/187238.07e-183.60e-1559
GO:20012339BreastPrecancerregulation of apoptotic signaling pathway65/1080356/187237.70e-173.17e-1465
GO:20012429BreastPrecancerregulation of intrinsic apoptotic signaling pathway41/1080164/187236.48e-162.31e-1341
GO:00069799BreastPrecancerresponse to oxidative stress70/1080446/187231.59e-144.26e-1270
GO:00083809BreastPrecancerRNA splicing65/1080434/187231.27e-122.53e-1065
GO:00003759BreastPrecancerRNA splicing, via transesterification reactions52/1080324/187231.74e-112.22e-0952
GO:00003779BreastPrecancerRNA splicing, via transesterification reactions with bulged adenosine as nucleophile51/1080320/187233.55e-114.04e-0951
GO:00003989BreastPrecancermRNA splicing, via spliceosome51/1080320/187233.55e-114.04e-0951
GO:00621979BreastPrecancercellular response to chemical stress51/1080337/187232.40e-102.34e-0851
GO:20012445BreastPrecancerpositive regulation of intrinsic apoptotic signaling pathway17/108058/187231.59e-081.12e-0617
GO:00345999BreastPrecancercellular response to oxidative stress42/1080288/187232.78e-081.79e-0642
GO:20012356BreastPrecancerpositive regulation of apoptotic signaling pathway24/1080126/187231.98e-071.01e-0524
GO:19021758BreastPrecancerregulation of oxidative stress-induced intrinsic apoptotic signaling pathway11/108029/187232.95e-071.44e-0511
GO:19032019BreastPrecancerregulation of oxidative stress-induced cell death16/108074/187233.80e-061.20e-0416
GO:00086318BreastPrecancerintrinsic apoptotic signaling pathway in response to oxidative stress12/108045/187236.23e-061.76e-0412
GO:00364739BreastPrecancercell death in response to oxidative stress17/108095/187232.74e-056.21e-0417
GO:00003808BreastPrecanceralternative mRNA splicing, via spliceosome15/108077/187232.86e-056.37e-0415
GO:00321034BreastPrecancerpositive regulation of response to external stimulus46/1080427/187233.41e-057.40e-0446
GO:19004079BreastPrecancerregulation of cellular response to oxidative stress16/108089/187234.42e-059.42e-0416
GO:00313493BreastPrecancerpositive regulation of defense response33/1080278/187236.79e-051.36e-0333
Page: 1 2 3 4 5 6 7 8 9 10 11 12 13 14 15 16 17 18 19 20 21 22 23 24 25 26 27 28 29 30 31 32 33 34 35 36 37 38 39 40 41 42 43 44 45 46 

check button Enriched KEGG pathways.
Pathway IDTissueDisease StageDescriptionGene RatioBg Ratiopvaluep.adjustqvalueCount
Page: 1 

Top

Cell-cell communication analysis

check buttonIdentification of potential cell-cell interactions between two cell types and their ligand-receptor pairs for different disease states
LigandReceptorLRpairPathwayTissueDisease Stage
Page: 1 

Top

Single-cell gene regulatory network inference analysis

check buttonFind out the significant the regulons (TFs) and the target genes of each regulon across cell types for different disease states
TFCell TypeTissueDisease StageTarget GeneRSSRegulon Activity
SFPQCD8TEXPStomachGCPNRC1,GZMB,DDX3Y, etc.1.64e-01The dot plots of a searched regulon are shown for all cell subpopulations in each disease state of each tissue based on the regulon specific score inferred using pySCENIC and by calculating the average expression.
∗The dot plots of a searched regulon are shown for all cell subpopulations in each disease state of each tissue based on the regulon specific score inferred using pySCENIC and by calculating the average expression.
Page: 1 

Top

Somatic mutation of malignant transformation related genes

check buttonAnnotation of somatic variants for genes involved in malignant transformation
Hugo SymbolVariant ClassVariant ClassificationdbSNP RSHGVScHGVSpHGVSp ShortSWISSPROTBIOTYPESIFTPolyPhenTumor Sample BarcodeTissueHistologySexAgeStageTherapy TypesDrugsOutcome
SFPQSNVMissense_Mutationc.1712N>Ap.Arg571Glnp.R571QP23246protein_codingtolerated(0.07)probably_damaging(0.978)TCGA-5L-AAT1-01Breastbreast invasive carcinomaFemale<65III/IVHormone TherapyletrozolSD
SFPQSNVMissense_Mutationc.1151N>Gp.Asn384Serp.N384SP23246protein_codingdeleterious(0.02)probably_damaging(0.992)TCGA-BH-A0BC-01Breastbreast invasive carcinomaFemale<65III/IVChemotherapydoxorubicinSD
SFPQSNVMissense_Mutationnovelc.1595N>Ap.Ala532Glup.A532EP23246protein_codingdeleterious(0.03)benign(0.327)TCGA-C8-A274-01Breastbreast invasive carcinomaFemale<65I/IIHormone TherapytamoxiphenSD
SFPQinsertionNonsense_Mutationnovelc.1028_1029insCACCCCCAGCTAATTTTTTAATTTTTTTTGTAp.Leu344ThrfsTer4p.L344Tfs*4P23246protein_codingTCGA-A2-A04Q-01Breastbreast invasive carcinomaFemale<65I/IIChemotherapyadriamycinSD
SFPQinsertionFrame_Shift_Insnovelc.1468_1469insCAp.Tyr490SerfsTer24p.Y490Sfs*24P23246protein_codingTCGA-A2-A0ER-01Breastbreast invasive carcinomaFemale<65I/IIChemotherapycytoxanSD
SFPQinsertionNonsense_Mutationnovelc.1467_1468insCATTTATATTCTGACATTTAGGGAAAAGATGTACTTAGTTTTp.Glu489_Tyr490insHisLeuTyrSerAspIleTerGlyLysAspValLeuSerPhep.E489_Y490insHLYSDI*GKDVLSFP23246protein_codingTCGA-A2-A0ER-01Breastbreast invasive carcinomaFemale<65I/IIChemotherapycytoxanSD
SFPQdeletionFrame_Shift_Delnovelc.1464delCp.Tyr488Terp.Y488*P23246protein_codingTCGA-D8-A27V-01Breastbreast invasive carcinomaFemale<65I/IIHormone TherapytamoxiphenSD
SFPQSNVMissense_Mutationrs751612883c.1643G>Ap.Arg548Hisp.R548HP23246protein_codingdeleterious(0.01)possibly_damaging(0.869)TCGA-2W-A8YY-01Cervixcervical & endocervical cancerFemale<65I/IIChemotherapycisplatinCR
SFPQSNVMissense_Mutationnovelc.2089N>Cp.Glu697Glnp.E697QP23246protein_codingdeleterious(0.01)probably_damaging(0.986)TCGA-JW-A5VL-01Cervixcervical & endocervical cancerFemale<65I/IIUnknownUnknownSD
SFPQSNVMissense_Mutationnovelc.1915N>Ap.Gly639Serp.G639SP23246protein_codingdeleterious(0.03)probably_damaging(0.998)TCGA-JW-A5VL-01Cervixcervical & endocervical cancerFemale<65I/IIUnknownUnknownSD
Page: 1 2 3 4 5 6 

Top

Related drugs of malignant transformation related genes

check buttonIdentification of chemicals and drugs interact with genes involved in malignant transfromation
(DGIdb 4.0)
Entrez IDSymbolCategoryInteraction TypesDrug Claim NameDrug NamePMIDs
Page: 1