
|
|||||
|
 | |
| |
| |
| |
| |
| |
|
Gene: SFI1 |
Gene summary for SFI1 |
| Gene information | Species | Human | Gene symbol | SFI1 | Gene ID | 9814 |
| Gene name | SFI1 centrin binding protein | |
| Gene Alias | PISD | |
| Cytomap | 22q12.2 | |
| Gene Type | protein-coding | GO ID | GO:0005575 | UniProtAcc | A8K8P3 |
Top |
Malignant transformation analysis |
| Identification of the aberrant gene expression in precancerous and cancerous lesions by comparing the gene expression of stem-like cells in diseased tissues with normal stem cells |
| Entrez ID | Symbol | Replicates | Species | Organ | Tissue | Adj P-value | Log2FC | Malignancy |
| 9814 | SFI1 | LZE4T | Human | Esophagus | ESCC | 1.74e-03 | 1.17e-01 | 0.0811 |
| 9814 | SFI1 | LZE7T | Human | Esophagus | ESCC | 4.19e-06 | 3.20e-01 | 0.0667 |
| 9814 | SFI1 | LZE24T | Human | Esophagus | ESCC | 3.68e-10 | 1.50e-01 | 0.0596 |
| 9814 | SFI1 | LZE21T | Human | Esophagus | ESCC | 3.58e-03 | 1.68e-01 | 0.0655 |
| 9814 | SFI1 | P1T-E | Human | Esophagus | ESCC | 1.22e-11 | 2.81e-01 | 0.0875 |
| 9814 | SFI1 | P2T-E | Human | Esophagus | ESCC | 2.99e-09 | 1.82e-01 | 0.1177 |
| 9814 | SFI1 | P4T-E | Human | Esophagus | ESCC | 1.22e-07 | 8.73e-02 | 0.1323 |
| 9814 | SFI1 | P8T-E | Human | Esophagus | ESCC | 2.71e-10 | 1.45e-01 | 0.0889 |
| 9814 | SFI1 | P9T-E | Human | Esophagus | ESCC | 1.15e-05 | 1.01e-01 | 0.1131 |
| 9814 | SFI1 | P10T-E | Human | Esophagus | ESCC | 6.27e-10 | 2.03e-01 | 0.116 |
| 9814 | SFI1 | P11T-E | Human | Esophagus | ESCC | 2.21e-02 | 1.33e-01 | 0.1426 |
| 9814 | SFI1 | P12T-E | Human | Esophagus | ESCC | 5.01e-04 | 1.40e-01 | 0.1122 |
| 9814 | SFI1 | P15T-E | Human | Esophagus | ESCC | 4.56e-04 | 9.08e-02 | 0.1149 |
| 9814 | SFI1 | P16T-E | Human | Esophagus | ESCC | 1.01e-03 | 1.24e-01 | 0.1153 |
| 9814 | SFI1 | P17T-E | Human | Esophagus | ESCC | 2.51e-04 | 1.76e-01 | 0.1278 |
| 9814 | SFI1 | P20T-E | Human | Esophagus | ESCC | 1.84e-02 | 8.06e-02 | 0.1124 |
| 9814 | SFI1 | P22T-E | Human | Esophagus | ESCC | 3.26e-09 | 1.35e-01 | 0.1236 |
| 9814 | SFI1 | P23T-E | Human | Esophagus | ESCC | 1.87e-05 | 1.04e-01 | 0.108 |
| 9814 | SFI1 | P26T-E | Human | Esophagus | ESCC | 1.45e-08 | 1.78e-01 | 0.1276 |
| 9814 | SFI1 | P27T-E | Human | Esophagus | ESCC | 5.78e-04 | 1.51e-01 | 0.1055 |
| Page: 1 2 3 |
| Tissue | Expression Dynamics | Abbreviation |
| Esophagus | 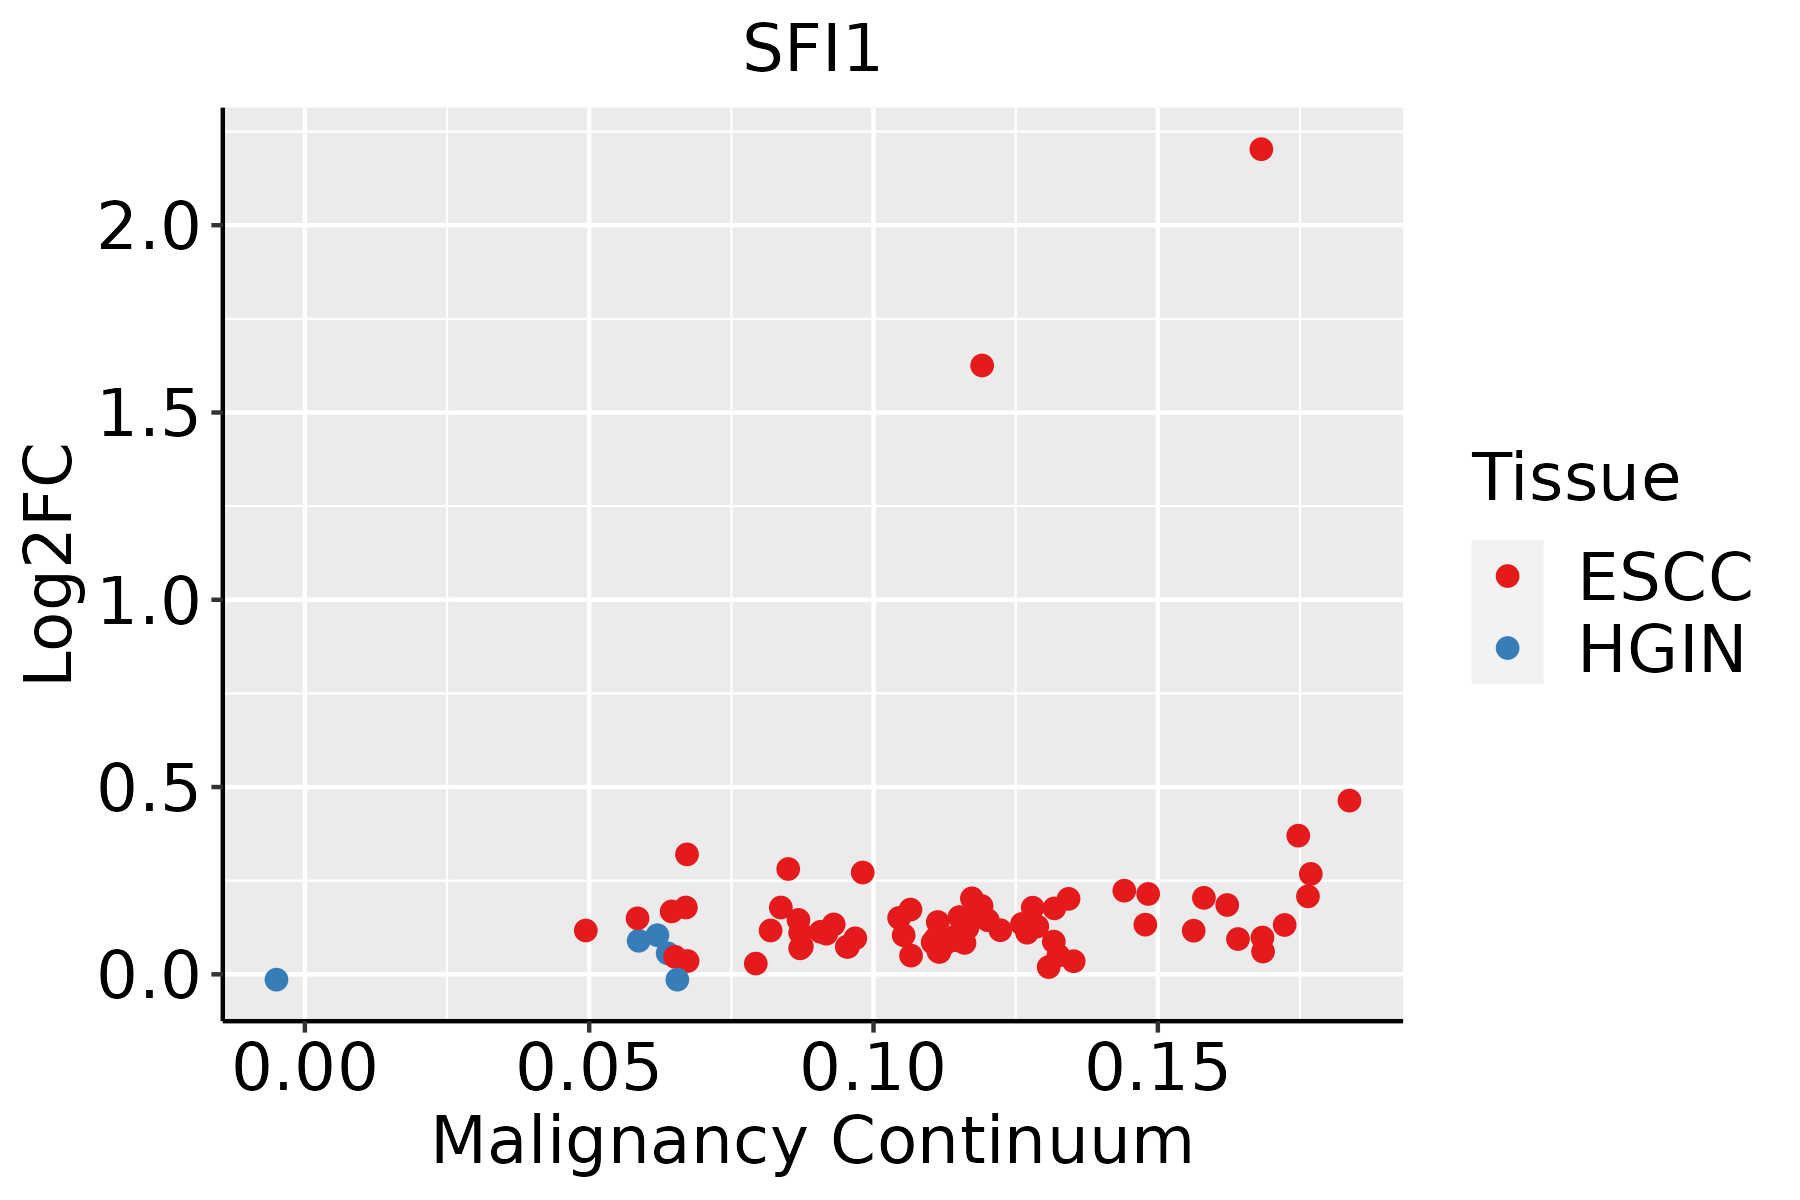 | ESCC: Esophageal squamous cell carcinoma |
| HGIN: High-grade intraepithelial neoplasias | ||
| LGIN: Low-grade intraepithelial neoplasias |
| ∗log2FC in expression of this searched gene in stem-like cells from each diseased tissue sample relative to stem-like cells in normal samples in each tissue plotted against the malignancy continuum. Samples are colored based on if they are from different disease stage. |
Top |
Malignant transformation related pathway analysis |
| Find out the enriched GO biological processes and KEGG pathways involved in transition from healthy to precancer to cancer |
| Tissue | Disease Stage | Enriched GO biological Processes |
| Colorectum | AD |  |
| Colorectum | SER |  |
| Colorectum | MSS |  |
| Colorectum | MSI-H |  |
| Colorectum | FAP |  |
| ∗Top 15 enriched GO BP terms are showed in the bar plot of each disease state in each tissue. Each row represents a significant GO biological process which is colored according to the -log10(p.adjust). |
| Page: 1 2 3 4 5 6 7 8 9 |
| GO ID | Tissue | Disease Stage | Description | Gene Ratio | Bg Ratio | pvalue | p.adjust | Count |
| Page: 1 |
| Pathway ID | Tissue | Disease Stage | Description | Gene Ratio | Bg Ratio | pvalue | p.adjust | qvalue | Count |
| Page: 1 |
Top |
Cell-cell communication analysis |
| Identification of potential cell-cell interactions between two cell types and their ligand-receptor pairs for different disease states |
| Ligand | Receptor | LRpair | Pathway | Tissue | Disease Stage |
| Page: 1 |
Top |
Single-cell gene regulatory network inference analysis |
| Find out the significant the regulons (TFs) and the target genes of each regulon across cell types for different disease states |
| TF | Cell Type | Tissue | Disease Stage | Target Gene | RSS | Regulon Activity |
| ∗The dot plots of a searched regulon are shown for all cell subpopulations in each disease state of each tissue based on the regulon specific score inferred using pySCENIC and by calculating the average expression. |
| Page: 1 |
Top |
Somatic mutation of malignant transformation related genes |
| Annotation of somatic variants for genes involved in malignant transformation |
| Hugo Symbol | Variant Class | Variant Classification | dbSNP RS | HGVSc | HGVSp | HGVSp Short | SWISSPROT | BIOTYPE | SIFT | PolyPhen | Tumor Sample Barcode | Tissue | Histology | Sex | Age | Stage | Therapy Types | Drugs | Outcome |
| SFI1 | SNV | Missense_Mutation | novel | c.1592T>C | p.Phe531Ser | p.F531S | A8K8P3 | protein_coding | tolerated(0.5) | benign(0.007) | TCGA-A2-A0D4-01 | Breast | breast invasive carcinoma | Female | <65 | I/II | Chemotherapy | adriamycin | SD |
| SFI1 | SNV | Missense_Mutation | rs182967809 | c.376N>A | p.Glu126Lys | p.E126K | A8K8P3 | protein_coding | tolerated(0.22) | benign(0.413) | TCGA-A2-A3XX-01 | Breast | breast invasive carcinoma | Female | <65 | I/II | Chemotherapy | cyclophosphamide | CR |
| SFI1 | SNV | Missense_Mutation | c.2221N>T | p.Ala741Ser | p.A741S | A8K8P3 | protein_coding | deleterious(0) | probably_damaging(0.994) | TCGA-A7-A26E-01 | Breast | breast invasive carcinoma | Female | >=65 | III/IV | Chemotherapy | cytoxan | SD | |
| SFI1 | SNV | Missense_Mutation | novel | c.3588G>T | p.Gln1196His | p.Q1196H | A8K8P3 | protein_coding | tolerated(0.09) | benign(0.003) | TCGA-B6-A0X0-01 | Breast | breast invasive carcinoma | Female | <65 | I/II | Unknown | Unknown | SD |
| SFI1 | SNV | Missense_Mutation | c.1625N>C | p.Met542Thr | p.M542T | A8K8P3 | protein_coding | tolerated(0.15) | benign(0.288) | TCGA-E2-A1LA-01 | Breast | breast invasive carcinoma | Female | <65 | I/II | Hormone Therapy | arimidex | SD | |
| SFI1 | SNV | Missense_Mutation | rs771038010 | c.3205N>C | p.Gly1069Arg | p.G1069R | A8K8P3 | protein_coding | tolerated(0.1) | possibly_damaging(0.787) | TCGA-UU-A93S-01 | Breast | breast invasive carcinoma | Female | <65 | III/IV | Unknown | Unknown | PD |
| SFI1 | insertion | Frame_Shift_Ins | novel | c.1594_1595insGATCTCCTGACCTCATGATCCGCCC | p.Gln532ArgfsTer31 | p.Q532Rfs*31 | A8K8P3 | protein_coding | TCGA-A2-A0D4-01 | Breast | breast invasive carcinoma | Female | <65 | I/II | Chemotherapy | adriamycin | SD | ||
| SFI1 | deletion | Frame_Shift_Del | c.963_966delNNNN | p.Tyr322SerfsTer70 | p.Y322Sfs*70 | A8K8P3 | protein_coding | TCGA-AO-A03O-01 | Breast | breast invasive carcinoma | Female | >=65 | I/II | Chemotherapy | doxorubicin | SD | |||
| SFI1 | insertion | Frame_Shift_Ins | novel | c.996_997insA | p.Arg333LysfsTer42 | p.R333Kfs*42 | A8K8P3 | protein_coding | TCGA-C8-A12L-01 | Breast | breast invasive carcinoma | Female | >=65 | I/II | Unknown | Unknown | SD | ||
| SFI1 | insertion | Frame_Shift_Ins | novel | c.659_660insA | p.Arg221ThrfsTer75 | p.R221Tfs*75 | A8K8P3 | protein_coding | TCGA-D8-A1X8-01 | Breast | breast invasive carcinoma | Female | <65 | III/IV | Chemotherapy | adrimicin+cyclophosphamide | SD |
| Page: 1 2 3 4 5 6 7 8 9 10 |
Top |
Related drugs of malignant transformation related genes |
| Identification of chemicals and drugs interact with genes involved in malignant transfromation |
| (DGIdb 4.0) |
| Entrez ID | Symbol | Category | Interaction Types | Drug Claim Name | Drug Name | PMIDs |
| Page: 1 |

Copyright 2023-Present -The University of Texas Health Science Center at Houston |