
|
|||||
|
 | |
| |
| |
| |
| |
| |
|
Gene: SF3B5 |
Gene summary for SF3B5 |
| Gene information | Species | Human | Gene symbol | SF3B5 | Gene ID | 83443 |
| Gene name | splicing factor 3b subunit 5 | |
| Gene Alias | SF3b10 | |
| Cytomap | 6q24.2 | |
| Gene Type | protein-coding | GO ID | GO:0000375 | UniProtAcc | Q9BWJ5 |
Top |
Malignant transformation analysis |
| Identification of the aberrant gene expression in precancerous and cancerous lesions by comparing the gene expression of stem-like cells in diseased tissues with normal stem cells |
| Entrez ID | Symbol | Replicates | Species | Organ | Tissue | Adj P-value | Log2FC | Malignancy |
| 83443 | SF3B5 | CA_HPV_1 | Human | Cervix | CC | 6.50e-06 | -1.09e-01 | 0.0264 |
| 83443 | SF3B5 | CA_HPV_3 | Human | Cervix | CC | 1.68e-03 | 7.27e-02 | 0.0414 |
| 83443 | SF3B5 | CCI_1 | Human | Cervix | CC | 3.28e-10 | -6.43e-01 | 0.528 |
| 83443 | SF3B5 | CCI_3 | Human | Cervix | CC | 4.07e-10 | -6.31e-01 | 0.516 |
| 83443 | SF3B5 | CCII_1 | Human | Cervix | CC | 4.23e-20 | -7.00e-01 | 0.3249 |
| 83443 | SF3B5 | H2 | Human | Cervix | HSIL_HPV | 3.18e-05 | -3.56e-01 | 0.0632 |
| 83443 | SF3B5 | L1 | Human | Cervix | CC | 1.42e-05 | -1.40e-01 | 0.0802 |
| 83443 | SF3B5 | HTA11_3410_2000001011 | Human | Colorectum | AD | 6.06e-15 | 4.31e-01 | 0.0155 |
| 83443 | SF3B5 | HTA11_2487_2000001011 | Human | Colorectum | SER | 2.44e-31 | 9.46e-01 | -0.1808 |
| 83443 | SF3B5 | HTA11_2951_2000001011 | Human | Colorectum | AD | 1.06e-11 | 7.24e-01 | 0.0216 |
| 83443 | SF3B5 | HTA11_1938_2000001011 | Human | Colorectum | AD | 3.24e-28 | 9.39e-01 | -0.0811 |
| 83443 | SF3B5 | HTA11_78_2000001011 | Human | Colorectum | AD | 9.02e-07 | 3.50e-01 | -0.1088 |
| 83443 | SF3B5 | HTA11_347_2000001011 | Human | Colorectum | AD | 2.89e-50 | 9.61e-01 | -0.1954 |
| 83443 | SF3B5 | HTA11_411_2000001011 | Human | Colorectum | SER | 4.32e-16 | 1.31e+00 | -0.2602 |
| 83443 | SF3B5 | HTA11_2112_2000001011 | Human | Colorectum | SER | 1.05e-11 | 1.00e+00 | -0.2196 |
| 83443 | SF3B5 | HTA11_3361_2000001011 | Human | Colorectum | AD | 4.86e-37 | 1.10e+00 | -0.1207 |
| 83443 | SF3B5 | HTA11_83_2000001011 | Human | Colorectum | SER | 4.54e-23 | 9.38e-01 | -0.1526 |
| 83443 | SF3B5 | HTA11_696_2000001011 | Human | Colorectum | AD | 7.38e-63 | 1.17e+00 | -0.1464 |
| 83443 | SF3B5 | HTA11_866_2000001011 | Human | Colorectum | AD | 6.21e-31 | 7.34e-01 | -0.1001 |
| 83443 | SF3B5 | HTA11_1391_2000001011 | Human | Colorectum | AD | 1.60e-57 | 1.51e+00 | -0.059 |
| Page: 1 2 3 4 5 6 7 8 9 10 11 12 |
| Tissue | Expression Dynamics | Abbreviation |
| Cervix | 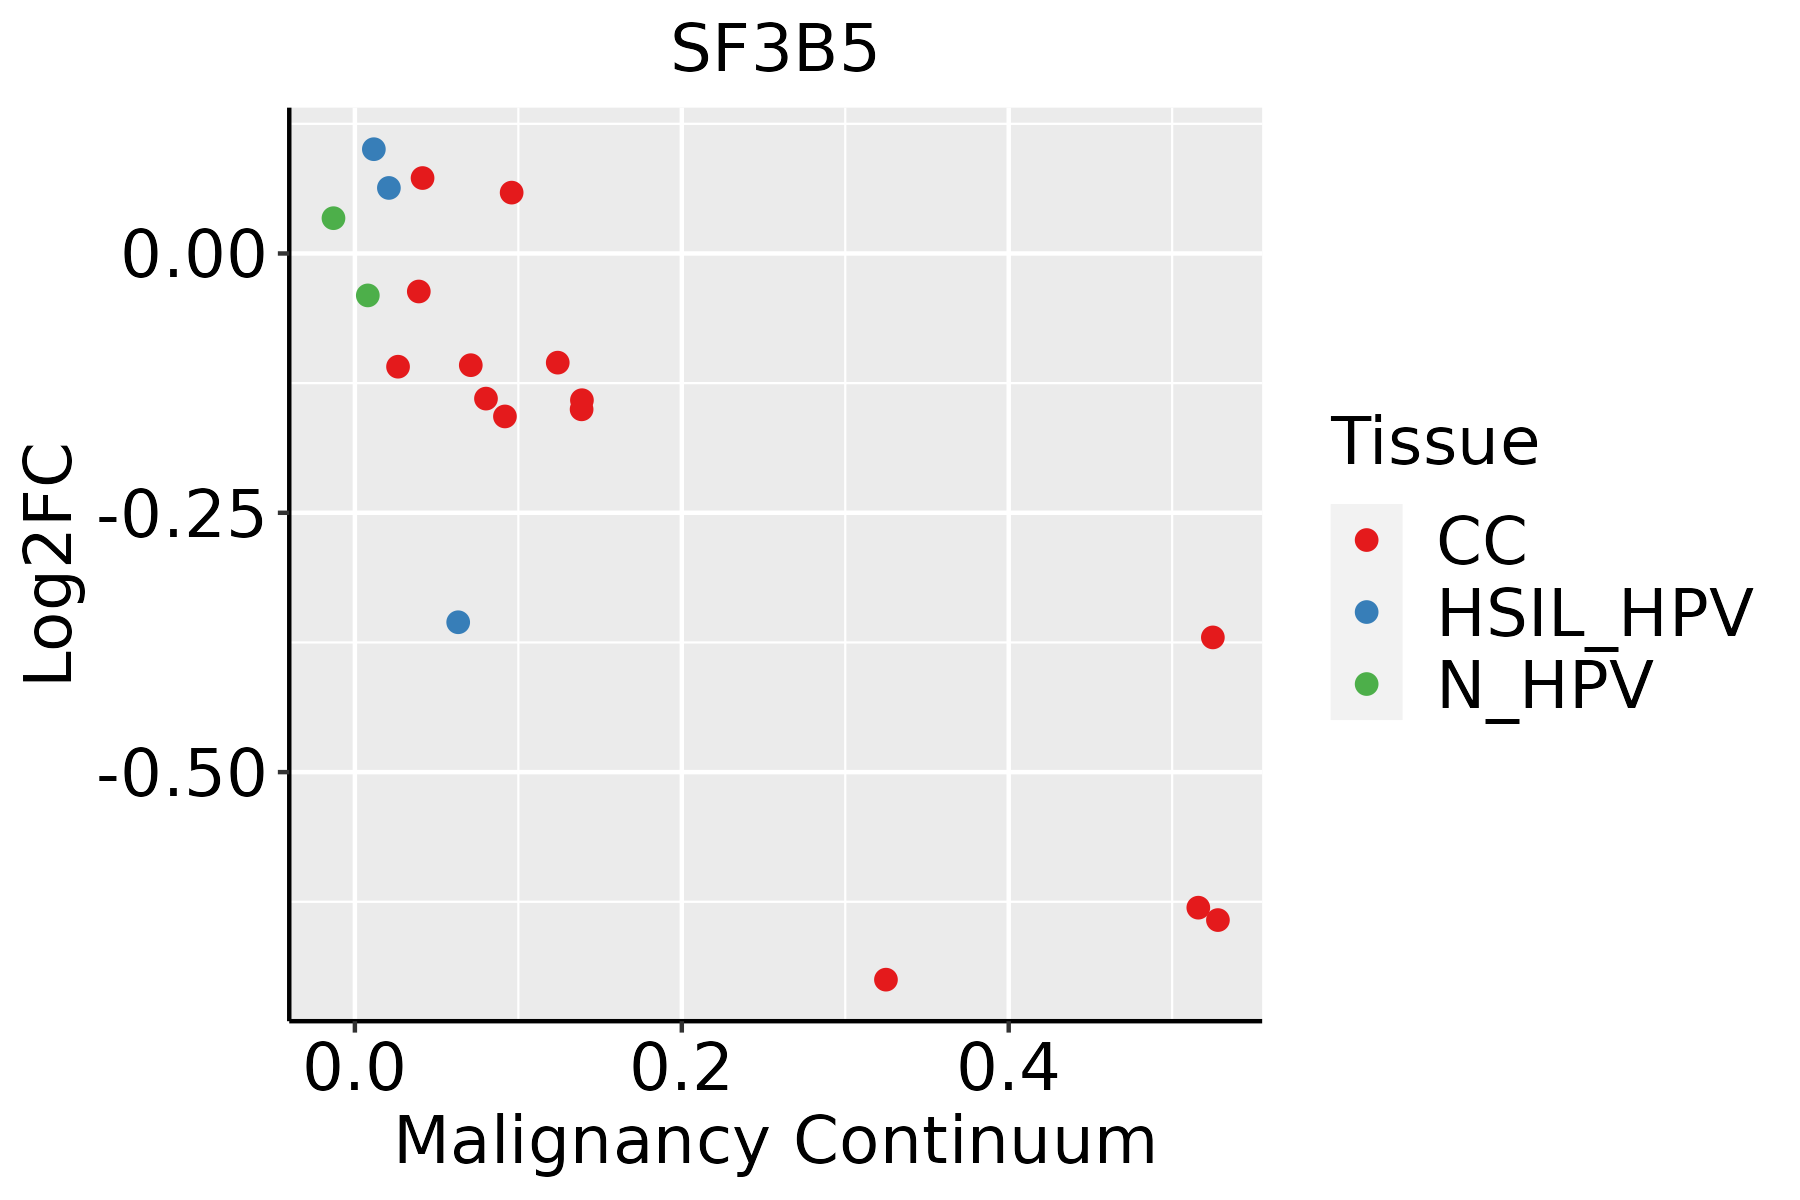 | CC: Cervix cancer |
| HSIL_HPV: HPV-infected high-grade squamous intraepithelial lesions | ||
| N_HPV: HPV-infected normal cervix | ||
| Colorectum (GSE201348) |  | FAP: Familial adenomatous polyposis |
| CRC: Colorectal cancer | ||
| Colorectum (HTA11) |  | AD: Adenomas |
| SER: Sessile serrated lesions | ||
| MSI-H: Microsatellite-high colorectal cancer | ||
| MSS: Microsatellite stable colorectal cancer | ||
| Endometrium | 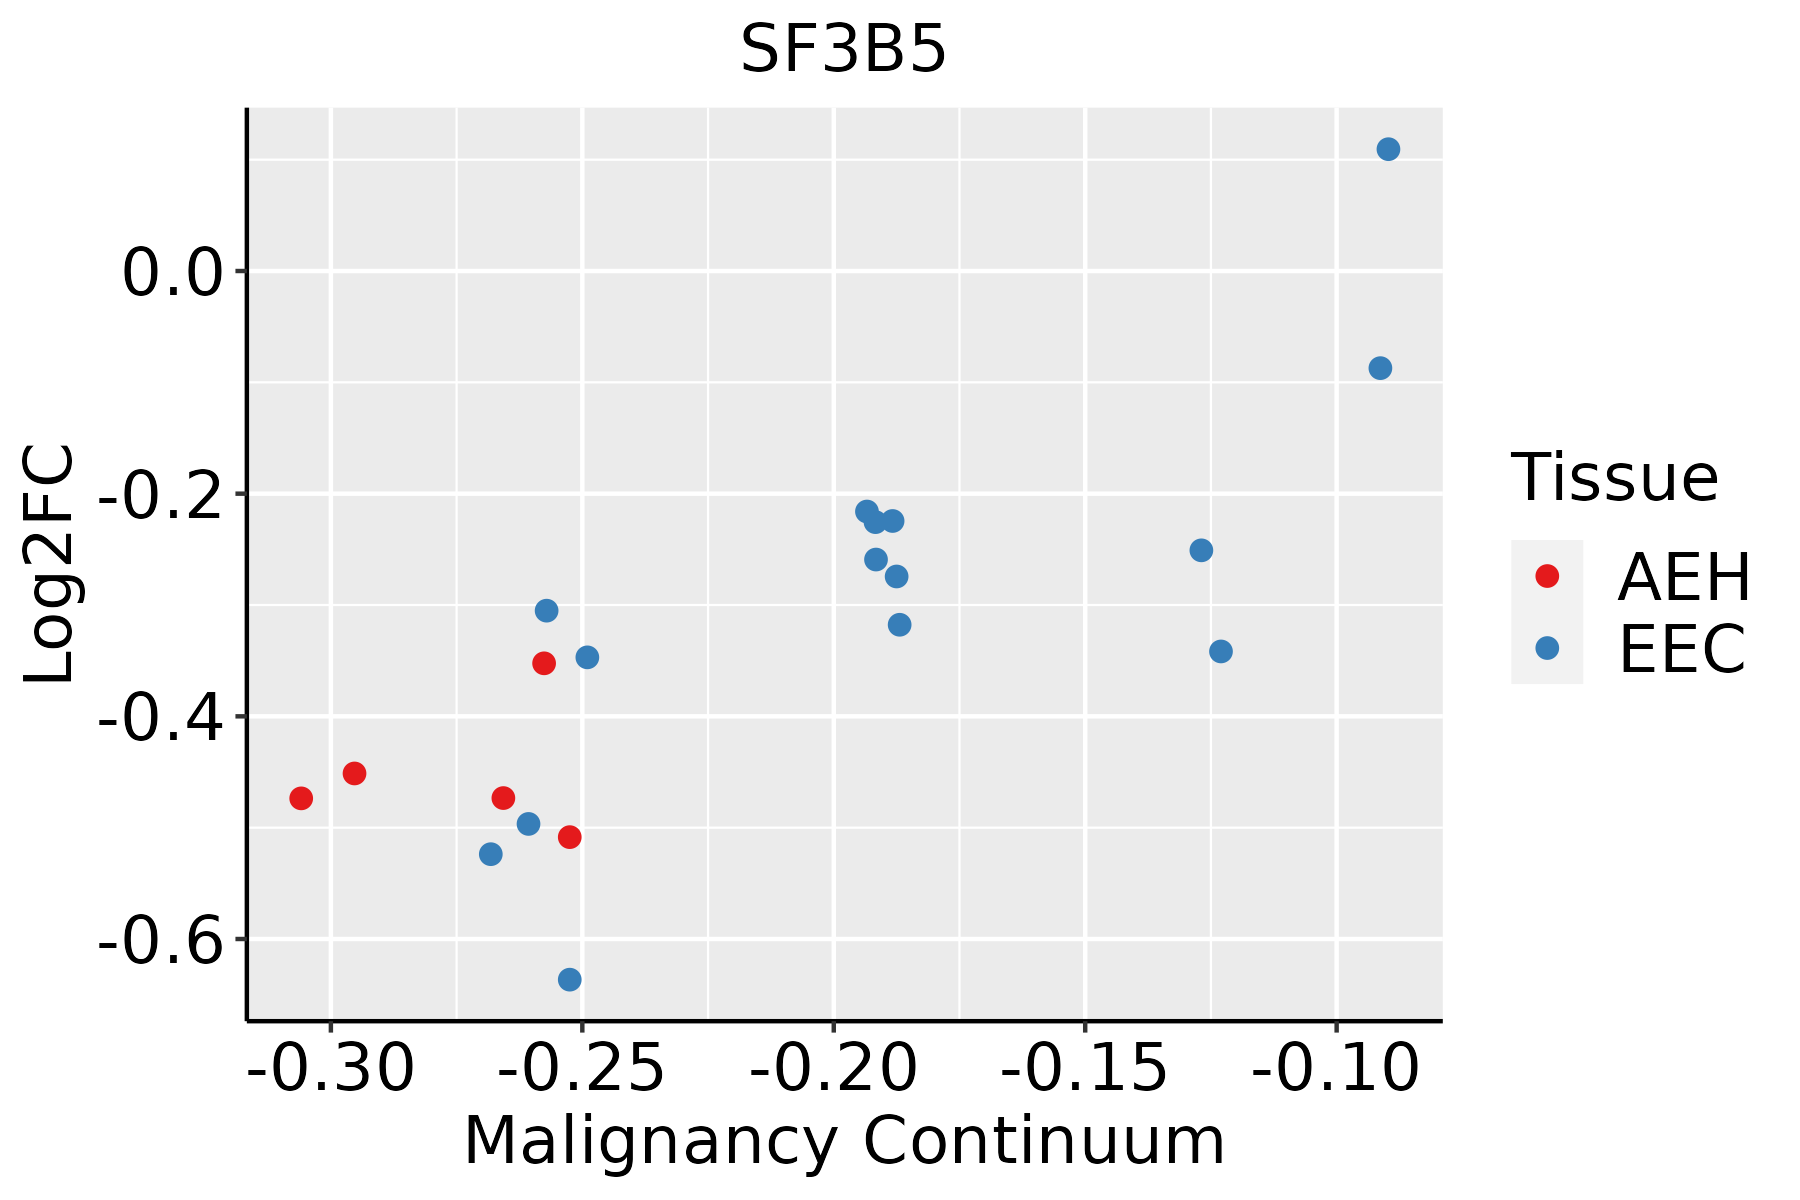 | AEH: Atypical endometrial hyperplasia |
| EEC: Endometrioid Cancer | ||
| Esophagus | 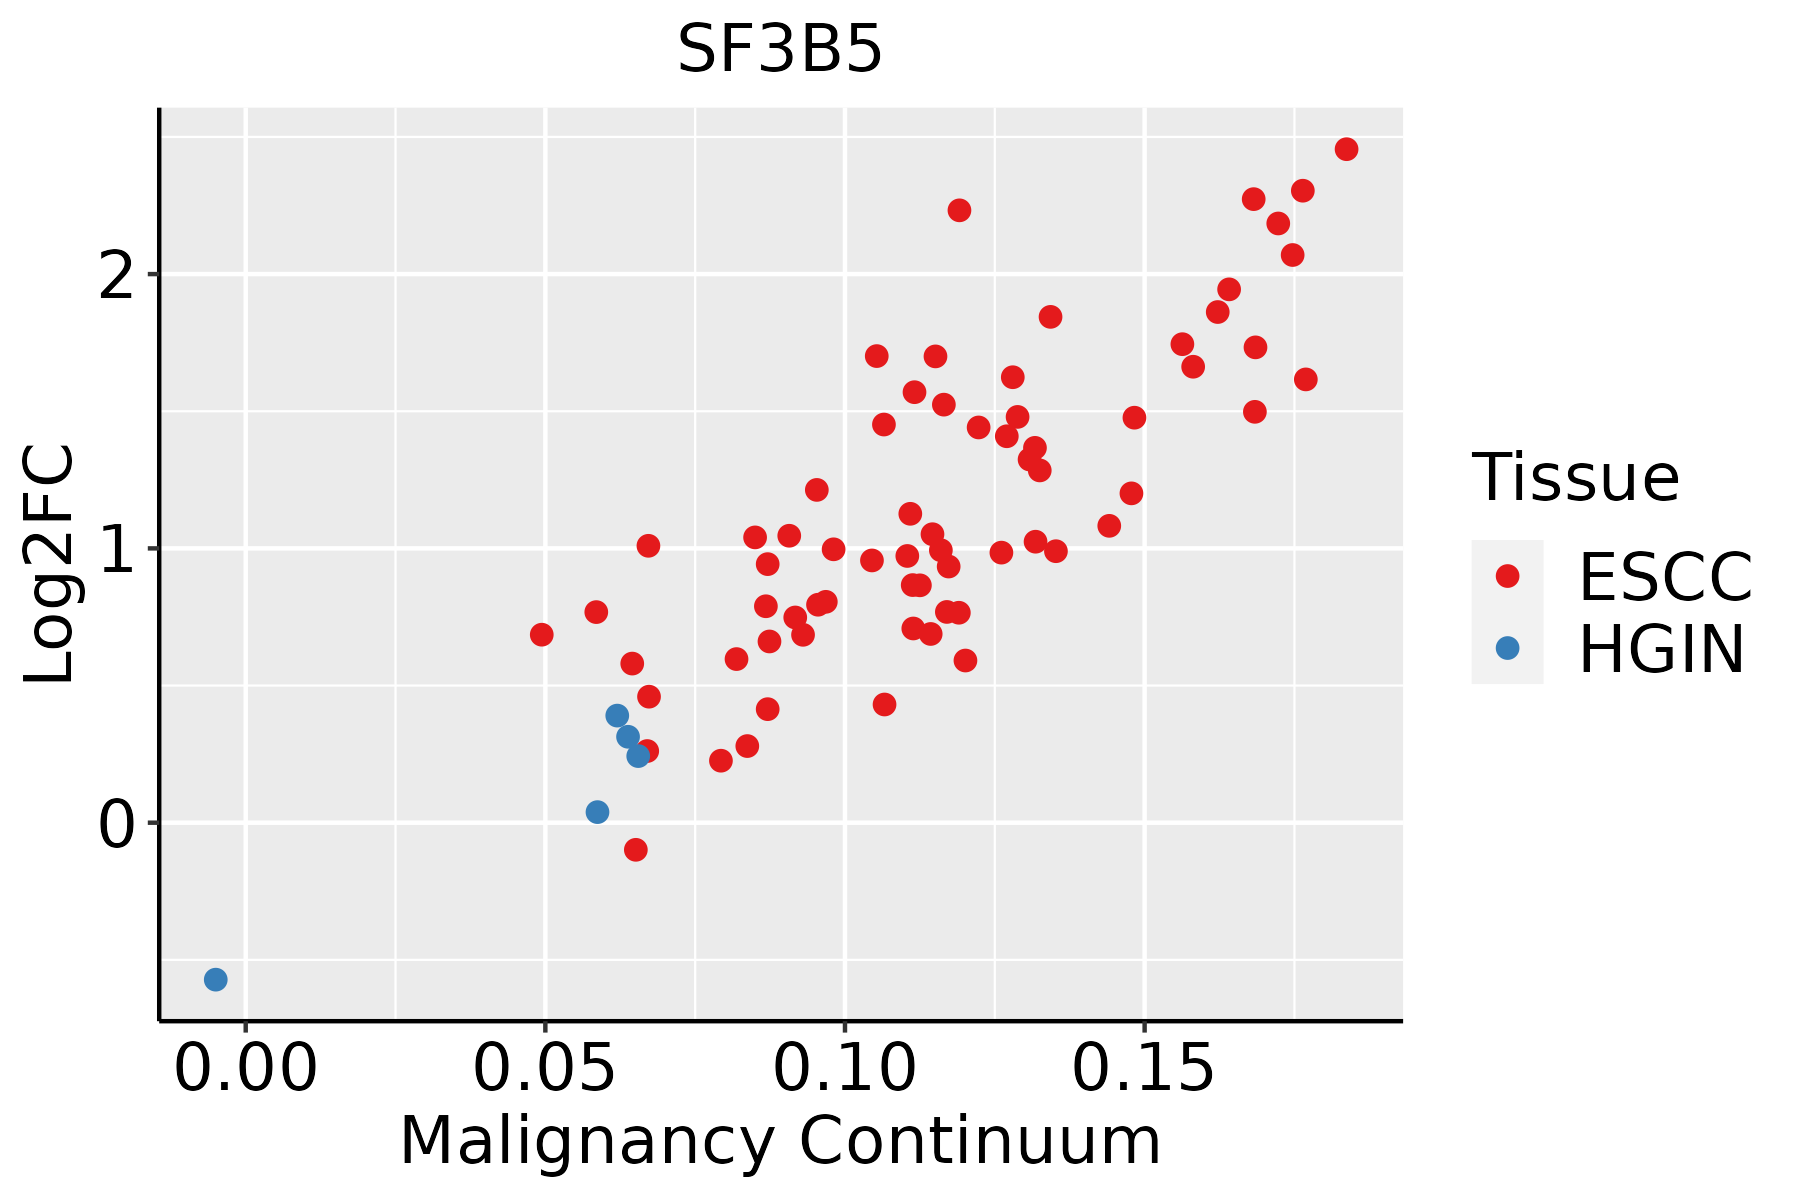 | ESCC: Esophageal squamous cell carcinoma |
| HGIN: High-grade intraepithelial neoplasias | ||
| LGIN: Low-grade intraepithelial neoplasias | ||
| GC | 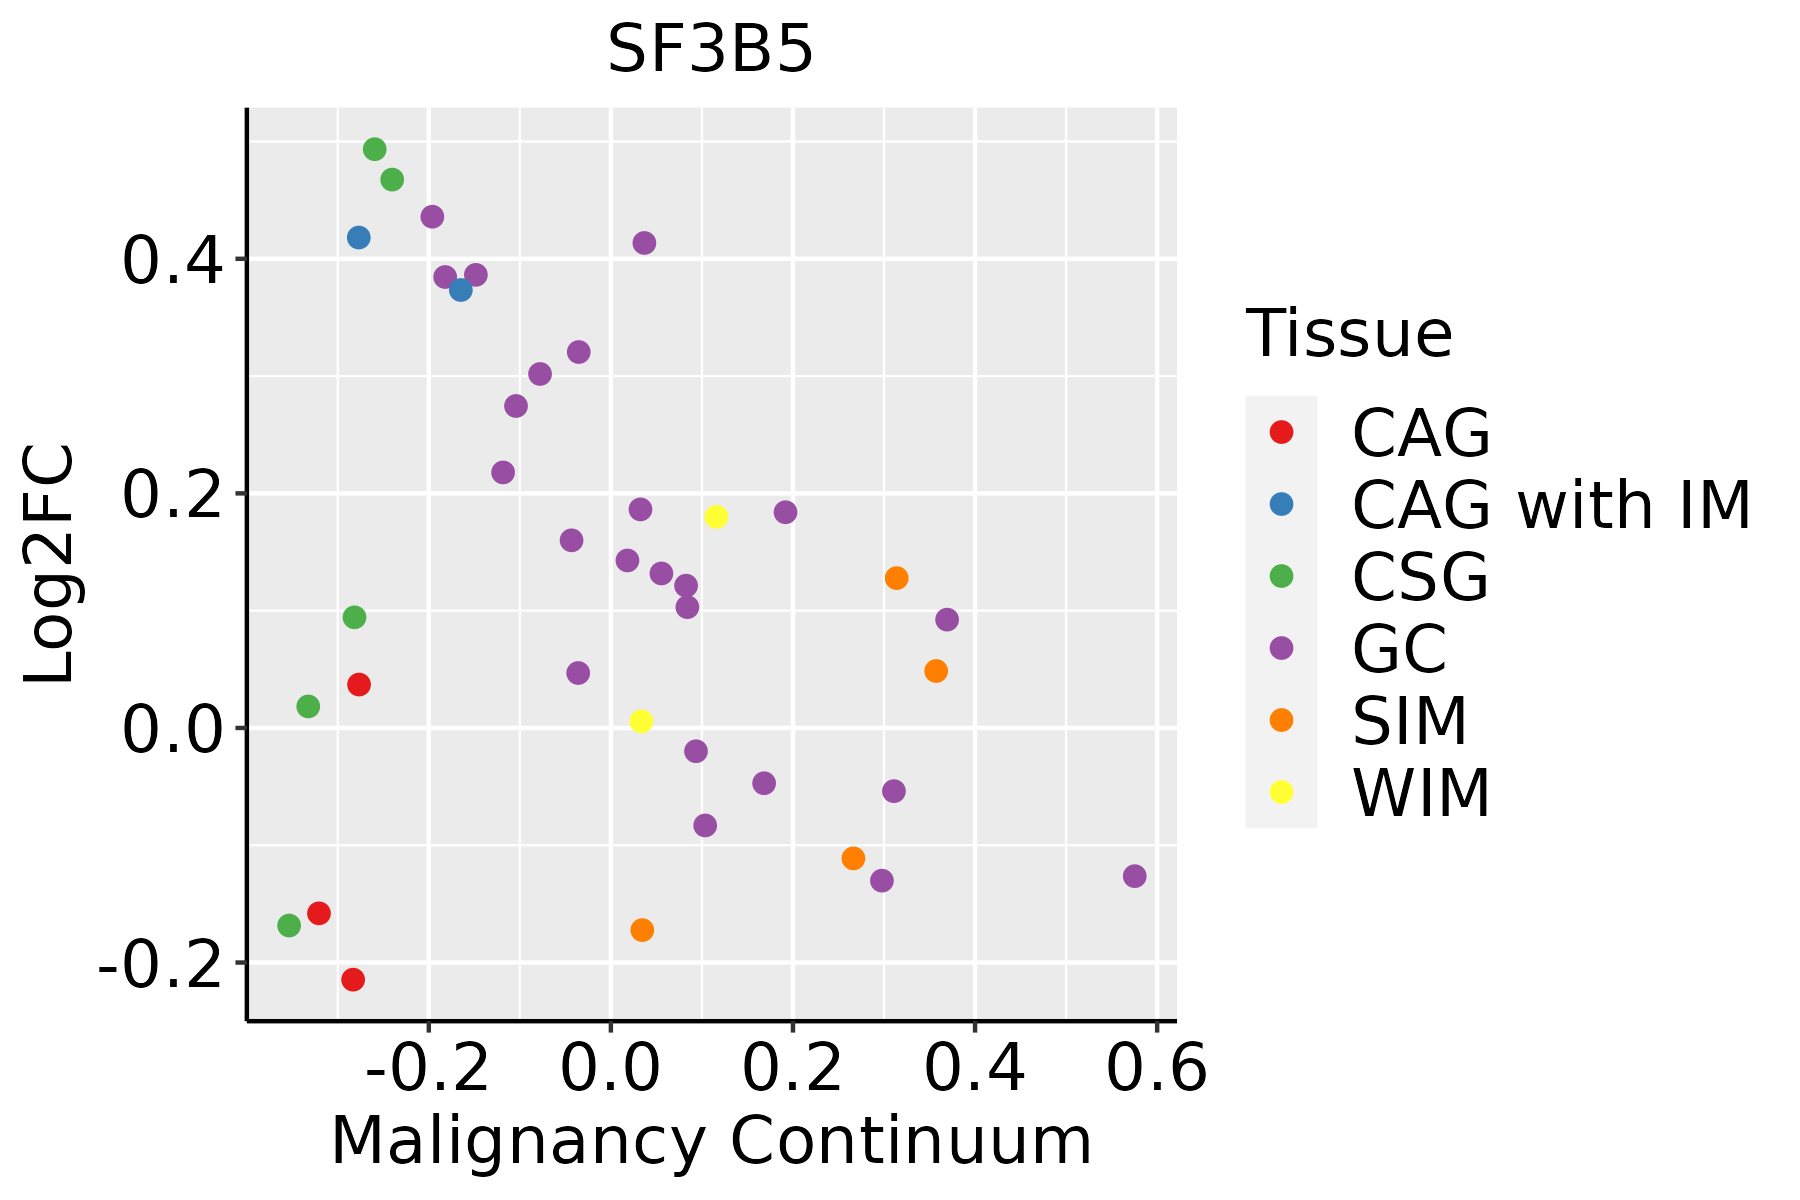 | CAG: Chronic atrophic gastritis |
| CAG with IM: Chronic atrophic gastritis with intestinal metaplasia | ||
| CSG: Chronic superficial gastritis | ||
| GC: Gastric cancer | ||
| SIM: Severe intestinal metaplasia | ||
| WIM: Wild intestinal metaplasia | ||
| Liver | 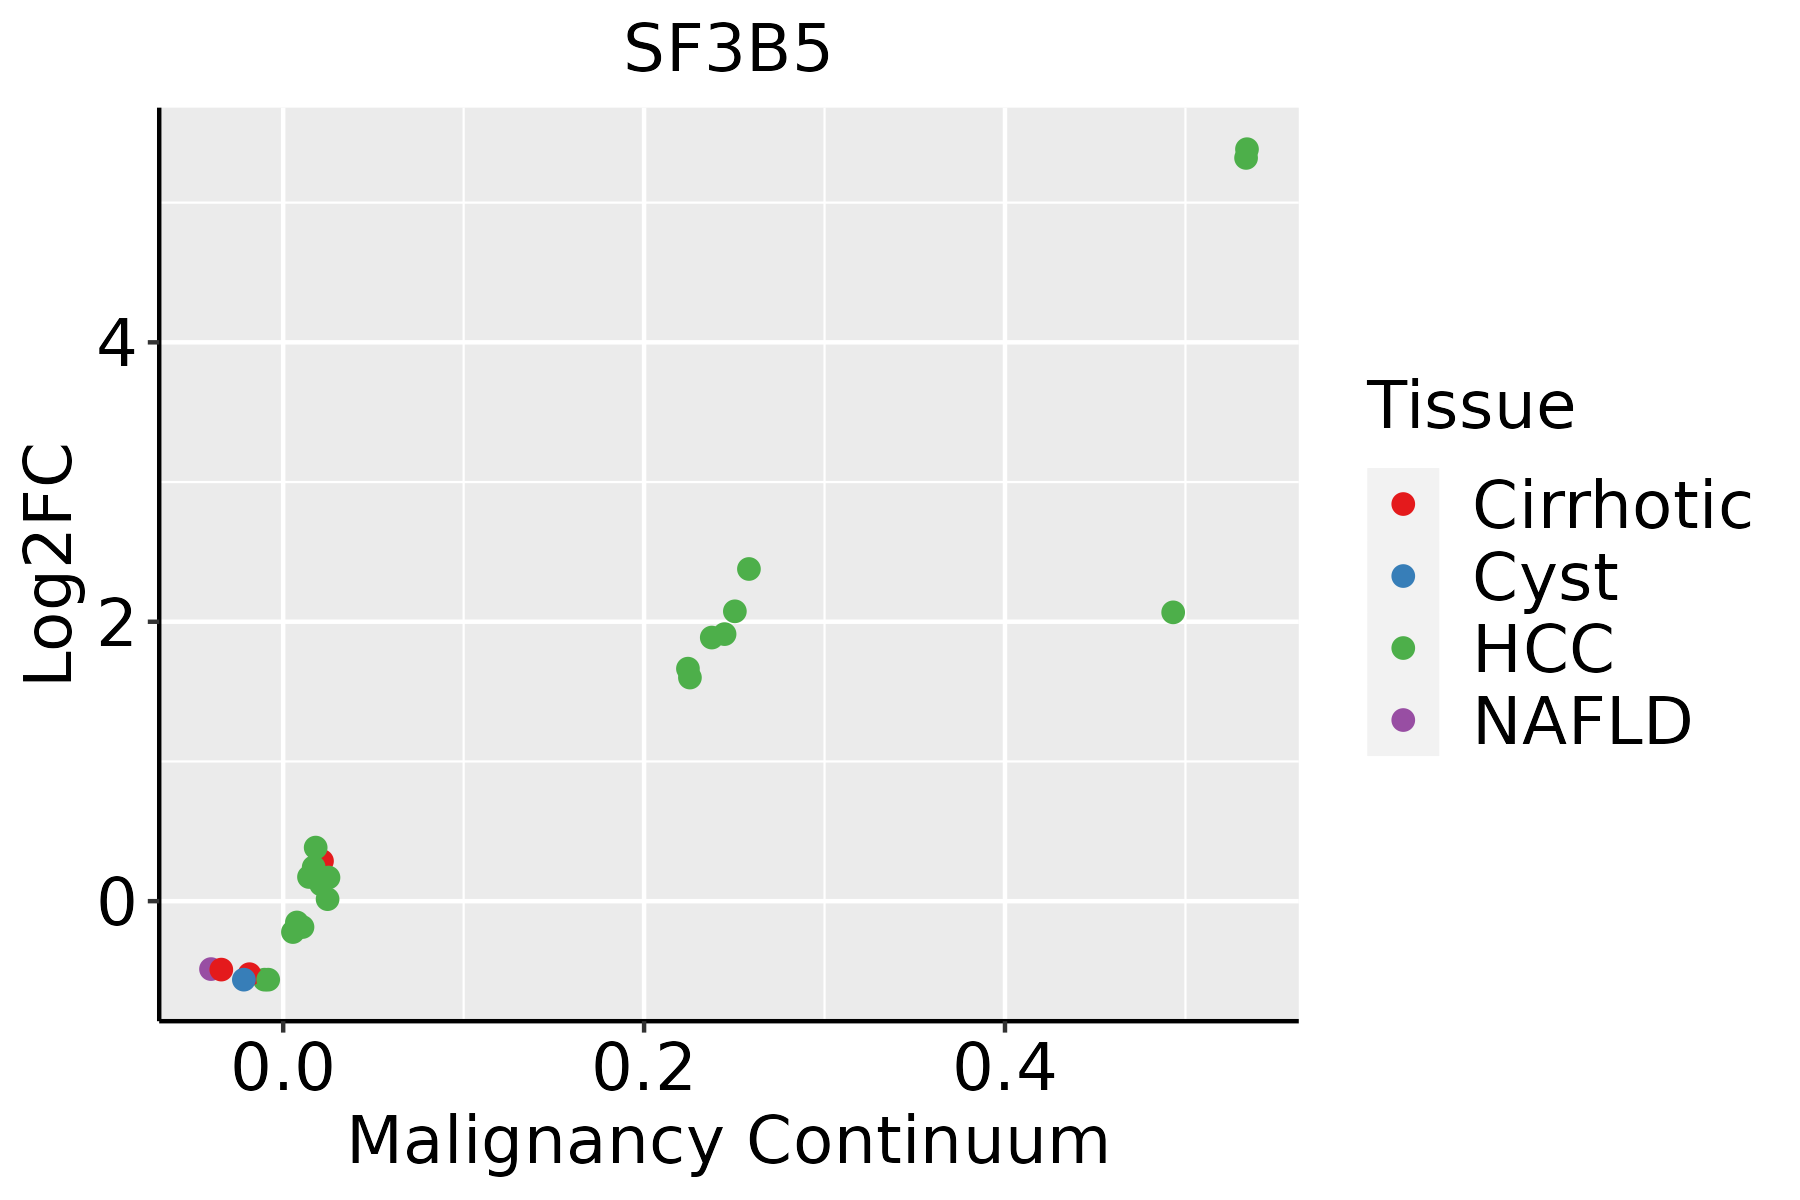 | HCC: Hepatocellular carcinoma |
| NAFLD: Non-alcoholic fatty liver disease | ||
| Oral Cavity | 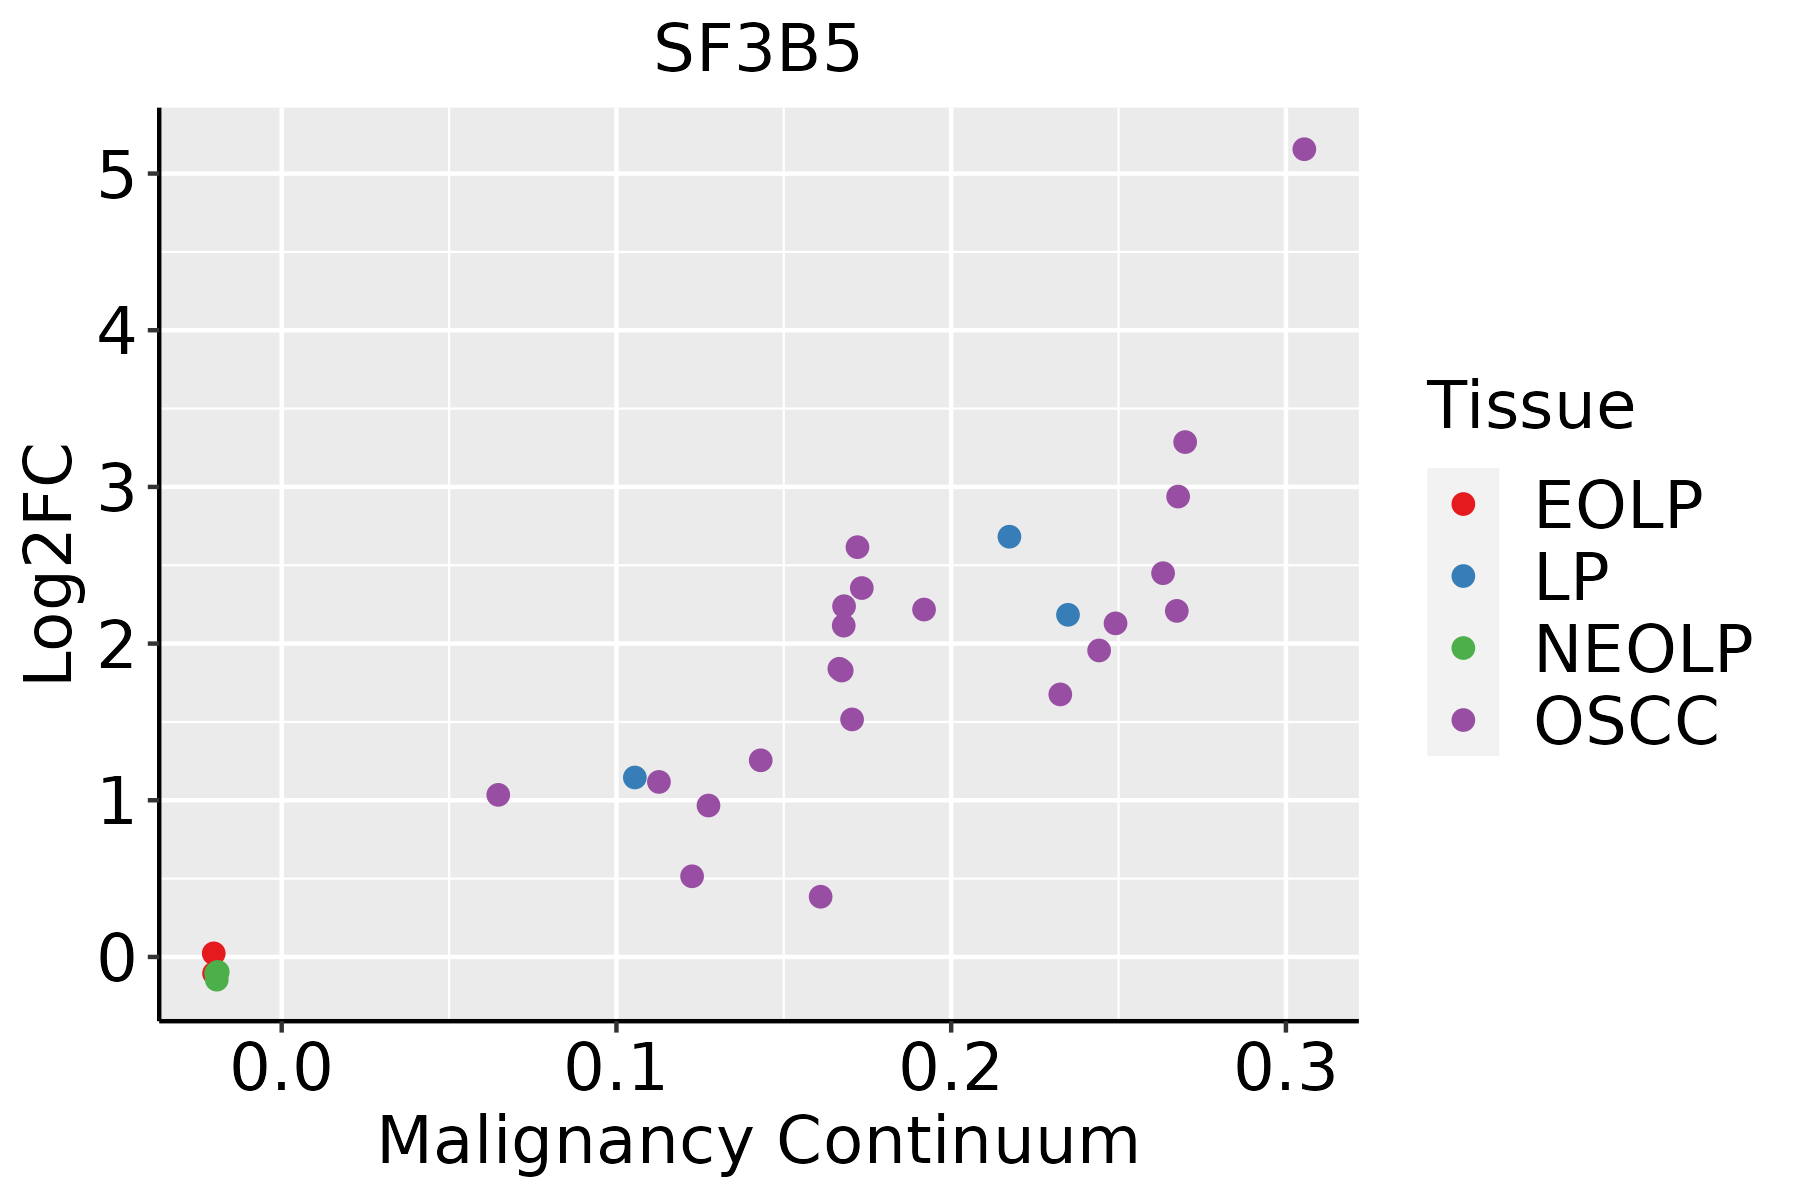 | EOLP: Erosive Oral lichen planus |
| LP: leukoplakia | ||
| NEOLP: Non-erosive oral lichen planus | ||
| OSCC: Oral squamous cell carcinoma | ||
| Prostate | 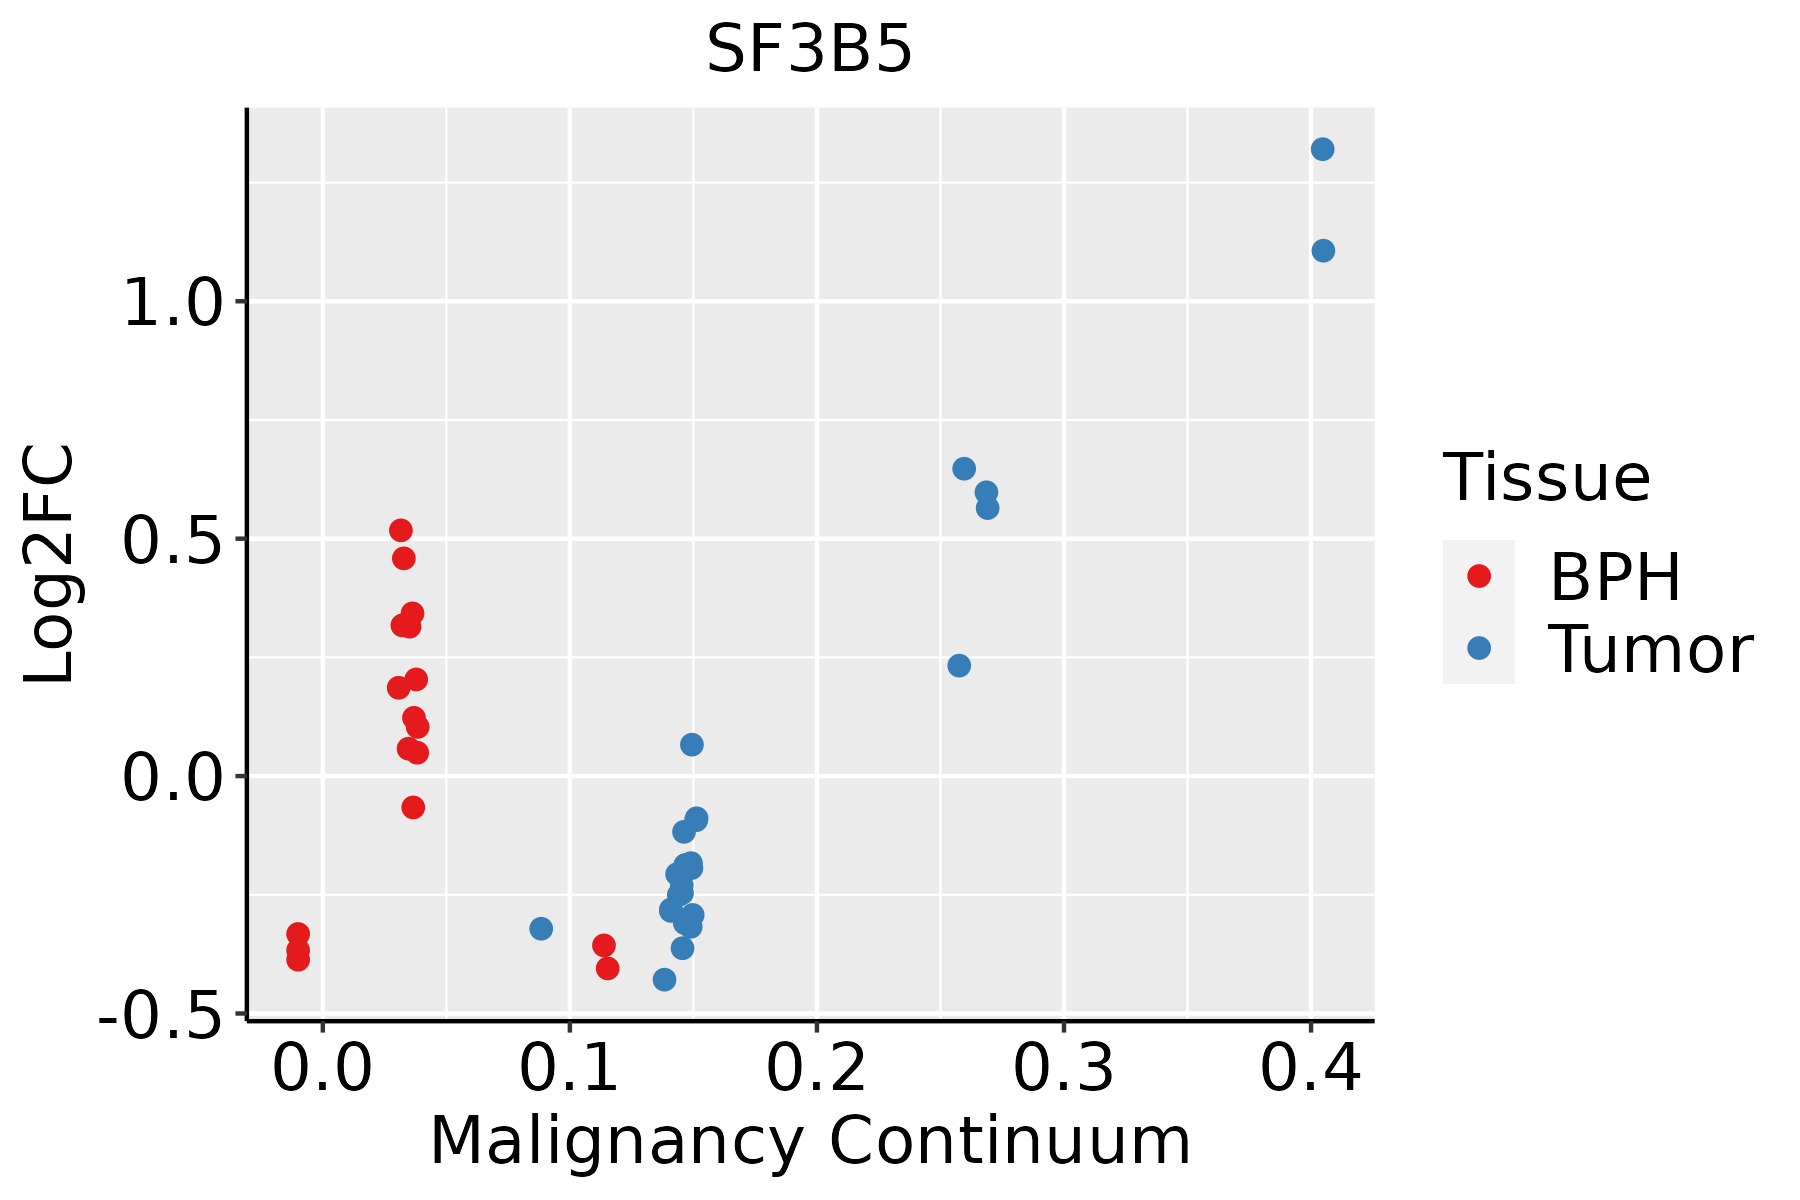 | BPH: Benign Prostatic Hyperplasia |
| Skin |  | AK: Actinic keratosis |
| cSCC: Cutaneous squamous cell carcinoma | ||
| SCCIS:squamous cell carcinoma in situ | ||
| Thyroid | 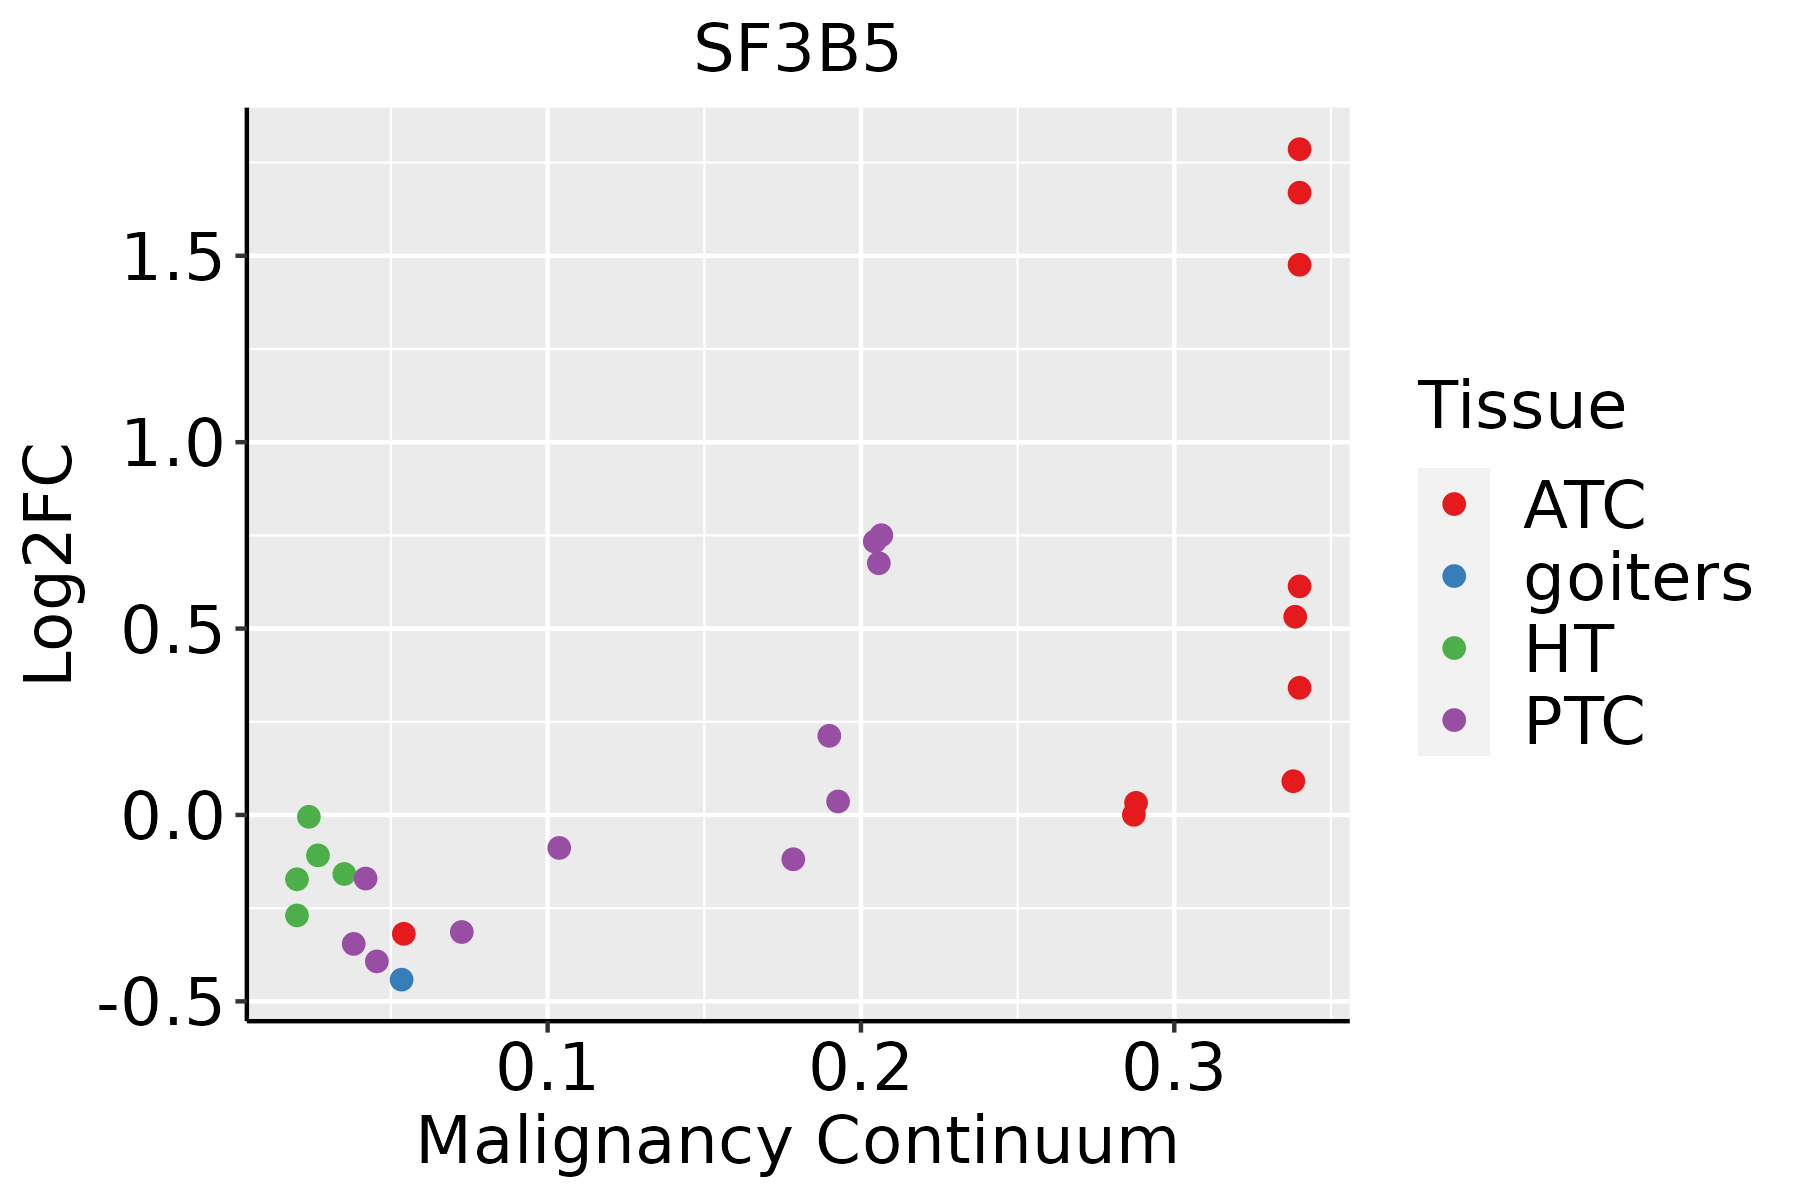 | ATC: Anaplastic thyroid cancer |
| HT: Hashimoto's thyroiditis | ||
| PTC: Papillary thyroid cancer |
| ∗log2FC in expression of this searched gene in stem-like cells from each diseased tissue sample relative to stem-like cells in normal samples in each tissue plotted against the malignancy continuum. Samples are colored based on if they are from different disease stage. |
Top |
Malignant transformation related pathway analysis |
| Find out the enriched GO biological processes and KEGG pathways involved in transition from healthy to precancer to cancer |
| Tissue | Disease Stage | Enriched GO biological Processes |
| Colorectum | AD |  |
| Colorectum | SER |  |
| Colorectum | MSS |  |
| Colorectum | MSI-H |  |
| Colorectum | FAP |  |
| ∗Top 15 enriched GO BP terms are showed in the bar plot of each disease state in each tissue. Each row represents a significant GO biological process which is colored according to the -log10(p.adjust). |
| Page: 1 2 3 4 5 6 7 8 9 |
| GO ID | Tissue | Disease Stage | Description | Gene Ratio | Bg Ratio | pvalue | p.adjust | Count |
| GO:000838010 | Cervix | CC | RNA splicing | 76/2311 | 434/18723 | 9.79e-04 | 8.19e-03 | 76 |
| GO:000037710 | Cervix | CC | RNA splicing, via transesterification reactions with bulged adenosine as nucleophile | 55/2311 | 320/18723 | 6.71e-03 | 3.70e-02 | 55 |
| GO:000039810 | Cervix | CC | mRNA splicing, via spliceosome | 55/2311 | 320/18723 | 6.71e-03 | 3.70e-02 | 55 |
| GO:000037510 | Cervix | CC | RNA splicing, via transesterification reactions | 55/2311 | 324/18723 | 8.61e-03 | 4.44e-02 | 55 |
| GO:0008380 | Colorectum | AD | RNA splicing | 169/3918 | 434/18723 | 3.59e-18 | 2.04e-15 | 169 |
| GO:0000377 | Colorectum | AD | RNA splicing, via transesterification reactions with bulged adenosine as nucleophile | 130/3918 | 320/18723 | 5.88e-16 | 2.16e-13 | 130 |
| GO:0000398 | Colorectum | AD | mRNA splicing, via spliceosome | 130/3918 | 320/18723 | 5.88e-16 | 2.16e-13 | 130 |
| GO:0000375 | Colorectum | AD | RNA splicing, via transesterification reactions | 131/3918 | 324/18723 | 7.11e-16 | 2.22e-13 | 131 |
| GO:00083801 | Colorectum | SER | RNA splicing | 123/2897 | 434/18723 | 3.84e-12 | 8.41e-10 | 123 |
| GO:00003751 | Colorectum | SER | RNA splicing, via transesterification reactions | 90/2897 | 324/18723 | 8.68e-09 | 7.50e-07 | 90 |
| GO:00003771 | Colorectum | SER | RNA splicing, via transesterification reactions with bulged adenosine as nucleophile | 89/2897 | 320/18723 | 9.82e-09 | 8.14e-07 | 89 |
| GO:00003981 | Colorectum | SER | mRNA splicing, via spliceosome | 89/2897 | 320/18723 | 9.82e-09 | 8.14e-07 | 89 |
| GO:00083802 | Colorectum | MSS | RNA splicing | 159/3467 | 434/18723 | 1.75e-19 | 1.22e-16 | 159 |
| GO:00003772 | Colorectum | MSS | RNA splicing, via transesterification reactions with bulged adenosine as nucleophile | 121/3467 | 320/18723 | 2.52e-16 | 8.27e-14 | 121 |
| GO:00003982 | Colorectum | MSS | mRNA splicing, via spliceosome | 121/3467 | 320/18723 | 2.52e-16 | 8.27e-14 | 121 |
| GO:00003752 | Colorectum | MSS | RNA splicing, via transesterification reactions | 122/3467 | 324/18723 | 2.75e-16 | 8.58e-14 | 122 |
| GO:00083803 | Colorectum | MSI-H | RNA splicing | 82/1319 | 434/18723 | 1.22e-16 | 4.53e-14 | 82 |
| GO:00003753 | Colorectum | MSI-H | RNA splicing, via transesterification reactions | 67/1319 | 324/18723 | 7.99e-16 | 2.61e-13 | 67 |
| GO:00003773 | Colorectum | MSI-H | RNA splicing, via transesterification reactions with bulged adenosine as nucleophile | 66/1319 | 320/18723 | 1.51e-15 | 4.41e-13 | 66 |
| GO:00003983 | Colorectum | MSI-H | mRNA splicing, via spliceosome | 66/1319 | 320/18723 | 1.51e-15 | 4.41e-13 | 66 |
| Page: 1 2 3 4 5 |
| Pathway ID | Tissue | Disease Stage | Description | Gene Ratio | Bg Ratio | pvalue | p.adjust | qvalue | Count |
| hsa03040 | Colorectum | AD | Spliceosome | 73/2092 | 217/8465 | 1.73e-03 | 9.68e-03 | 6.18e-03 | 73 |
| hsa030401 | Colorectum | AD | Spliceosome | 73/2092 | 217/8465 | 1.73e-03 | 9.68e-03 | 6.18e-03 | 73 |
| hsa030402 | Colorectum | MSS | Spliceosome | 66/1875 | 217/8465 | 2.58e-03 | 1.27e-02 | 7.81e-03 | 66 |
| hsa030403 | Colorectum | MSS | Spliceosome | 66/1875 | 217/8465 | 2.58e-03 | 1.27e-02 | 7.81e-03 | 66 |
| hsa030404 | Colorectum | MSI-H | Spliceosome | 37/797 | 217/8465 | 2.49e-04 | 3.23e-03 | 2.70e-03 | 37 |
| hsa030405 | Colorectum | MSI-H | Spliceosome | 37/797 | 217/8465 | 2.49e-04 | 3.23e-03 | 2.70e-03 | 37 |
| hsa030409 | Endometrium | AEH | Spliceosome | 54/1197 | 217/8465 | 1.47e-05 | 1.65e-04 | 1.21e-04 | 54 |
| hsa0304014 | Endometrium | AEH | Spliceosome | 54/1197 | 217/8465 | 1.47e-05 | 1.65e-04 | 1.21e-04 | 54 |
| hsa0304024 | Endometrium | EEC | Spliceosome | 54/1237 | 217/8465 | 3.78e-05 | 3.88e-04 | 2.89e-04 | 54 |
| hsa0304034 | Endometrium | EEC | Spliceosome | 54/1237 | 217/8465 | 3.78e-05 | 3.88e-04 | 2.89e-04 | 54 |
| hsa0304027 | Esophagus | ESCC | Spliceosome | 128/4205 | 217/8465 | 3.31e-03 | 8.79e-03 | 4.50e-03 | 128 |
| hsa0304037 | Esophagus | ESCC | Spliceosome | 128/4205 | 217/8465 | 3.31e-03 | 8.79e-03 | 4.50e-03 | 128 |
| hsa030407 | Liver | Cirrhotic | Spliceosome | 102/2530 | 217/8465 | 5.69e-08 | 9.47e-07 | 5.84e-07 | 102 |
| hsa0304012 | Liver | Cirrhotic | Spliceosome | 102/2530 | 217/8465 | 5.69e-08 | 9.47e-07 | 5.84e-07 | 102 |
| hsa0304022 | Liver | HCC | Spliceosome | 122/4020 | 217/8465 | 5.55e-03 | 1.60e-02 | 8.91e-03 | 122 |
| hsa0304032 | Liver | HCC | Spliceosome | 122/4020 | 217/8465 | 5.55e-03 | 1.60e-02 | 8.91e-03 | 122 |
| hsa0304042 | Liver | Cyst | Spliceosome | 19/339 | 217/8465 | 1.10e-03 | 1.22e-02 | 1.00e-02 | 19 |
| hsa0304052 | Liver | Cyst | Spliceosome | 19/339 | 217/8465 | 1.10e-03 | 1.22e-02 | 1.00e-02 | 19 |
| hsa0304016 | Oral cavity | OSCC | Spliceosome | 123/3704 | 217/8465 | 7.21e-05 | 2.74e-04 | 1.40e-04 | 123 |
| hsa0304017 | Oral cavity | OSCC | Spliceosome | 123/3704 | 217/8465 | 7.21e-05 | 2.74e-04 | 1.40e-04 | 123 |
| Page: 1 2 |
Top |
Cell-cell communication analysis |
| Identification of potential cell-cell interactions between two cell types and their ligand-receptor pairs for different disease states |
| Ligand | Receptor | LRpair | Pathway | Tissue | Disease Stage |
| Page: 1 |
Top |
Single-cell gene regulatory network inference analysis |
| Find out the significant the regulons (TFs) and the target genes of each regulon across cell types for different disease states |
| TF | Cell Type | Tissue | Disease Stage | Target Gene | RSS | Regulon Activity |
| ∗The dot plots of a searched regulon are shown for all cell subpopulations in each disease state of each tissue based on the regulon specific score inferred using pySCENIC and by calculating the average expression. |
| Page: 1 |
Top |
Somatic mutation of malignant transformation related genes |
| Annotation of somatic variants for genes involved in malignant transformation |
| Hugo Symbol | Variant Class | Variant Classification | dbSNP RS | HGVSc | HGVSp | HGVSp Short | SWISSPROT | BIOTYPE | SIFT | PolyPhen | Tumor Sample Barcode | Tissue | Histology | Sex | Age | Stage | Therapy Types | Drugs | Outcome |
| SF3B5 | SNV | Missense_Mutation | c.250N>C | p.Glu84Gln | p.E84Q | Q9BWJ5 | protein_coding | deleterious(0.02) | benign(0.04) | TCGA-C8-A26Y-01 | Breast | breast invasive carcinoma | Female | >=65 | I/II | Unknown | Unknown | SD | |
| SF3B5 | insertion | In_Frame_Ins | novel | c.135_136insTCCCTCACCCAAACC | p.Gly45_His46insSerLeuThrGlnThr | p.G45_H46insSLTQT | Q9BWJ5 | protein_coding | TCGA-AO-A128-01 | Breast | breast invasive carcinoma | Female | <65 | I/II | Chemotherapy | doxorubicin | SD | ||
| SF3B5 | insertion | Frame_Shift_Ins | novel | c.133_134insCATGC | p.Gly45AlafsTer26 | p.G45Afs*26 | Q9BWJ5 | protein_coding | TCGA-AO-A128-01 | Breast | breast invasive carcinoma | Female | <65 | I/II | Chemotherapy | doxorubicin | SD | ||
| SF3B5 | SNV | Missense_Mutation | novel | c.208G>A | p.Glu70Lys | p.E70K | Q9BWJ5 | protein_coding | tolerated(0.14) | benign(0.027) | TCGA-2W-A8YY-01 | Cervix | cervical & endocervical cancer | Female | <65 | I/II | Chemotherapy | cisplatin | CR |
| SF3B5 | deletion | In_Frame_Del | novel | c.125_127delCCT | p.Ser42del | p.S42del | Q9BWJ5 | protein_coding | TCGA-AA-3950-01 | Colorectum | colon adenocarcinoma | Female | >=65 | I/II | Unknown | Unknown | SD | ||
| SF3B5 | SNV | Missense_Mutation | c.122N>A | p.Cys41Tyr | p.C41Y | Q9BWJ5 | protein_coding | deleterious(0) | benign(0.377) | TCGA-AP-A051-01 | Endometrium | uterine corpus endometrioid carcinoma | Female | >=65 | I/II | Unknown | Unknown | SD | |
| SF3B5 | SNV | Missense_Mutation | c.148N>A | p.Leu50Ile | p.L50I | Q9BWJ5 | protein_coding | tolerated(0.06) | benign(0.068) | TCGA-BS-A0TC-01 | Endometrium | uterine corpus endometrioid carcinoma | Female | >=65 | I/II | Unknown | Unknown | SD | |
| SF3B5 | SNV | Missense_Mutation | novel | c.50N>G | p.Lys17Arg | p.K17R | Q9BWJ5 | protein_coding | tolerated(0.34) | benign(0.154) | TCGA-39-5030-01 | Lung | lung squamous cell carcinoma | Female | >=65 | III/IV | Unknown | Unknown | SD |
| SF3B5 | SNV | Missense_Mutation | c.222N>C | p.Gln74His | p.Q74H | Q9BWJ5 | protein_coding | tolerated(0.07) | benign(0.039) | TCGA-J4-A67Q-01 | Prostate | prostate adenocarcinoma | Male | >=65 | 6 | Unknown | Unknown | SD |
| Page: 1 |
Top |
Related drugs of malignant transformation related genes |
| Identification of chemicals and drugs interact with genes involved in malignant transfromation |
| (DGIdb 4.0) |
| Entrez ID | Symbol | Category | Interaction Types | Drug Claim Name | Drug Name | PMIDs |
| Page: 1 |

Copyright 2023-Present -The University of Texas Health Science Center at Houston |