
|
|||||
|
 | |
| |
| |
| |
| |
| |
|
Gene: SF3B4 |
Gene summary for SF3B4 |
| Gene information | Species | Human | Gene symbol | SF3B4 | Gene ID | 10262 |
| Gene name | splicing factor 3b subunit 4 | |
| Gene Alias | AFD1 | |
| Cytomap | 1q21.2 | |
| Gene Type | protein-coding | GO ID | GO:0000375 | UniProtAcc | B3KUJ0 |
Top |
Malignant transformation analysis |
| Identification of the aberrant gene expression in precancerous and cancerous lesions by comparing the gene expression of stem-like cells in diseased tissues with normal stem cells |
| Entrez ID | Symbol | Replicates | Species | Organ | Tissue | Adj P-value | Log2FC | Malignancy |
| 10262 | SF3B4 | HTA11_7696_3000711011 | Human | Colorectum | AD | 6.39e-03 | 2.37e-01 | 0.0674 |
| 10262 | SF3B4 | LZE2T | Human | Esophagus | ESCC | 3.06e-02 | 6.03e-01 | 0.082 |
| 10262 | SF3B4 | LZE4T | Human | Esophagus | ESCC | 1.77e-19 | 6.34e-01 | 0.0811 |
| 10262 | SF3B4 | LZE5T | Human | Esophagus | ESCC | 2.85e-04 | 2.38e-01 | 0.0514 |
| 10262 | SF3B4 | LZE7T | Human | Esophagus | ESCC | 1.47e-15 | 1.26e+00 | 0.0667 |
| 10262 | SF3B4 | LZE8T | Human | Esophagus | ESCC | 7.41e-11 | 4.84e-01 | 0.067 |
| 10262 | SF3B4 | LZE20T | Human | Esophagus | ESCC | 7.44e-09 | 3.32e-01 | 0.0662 |
| 10262 | SF3B4 | LZE22T | Human | Esophagus | ESCC | 4.74e-05 | 8.94e-01 | 0.068 |
| 10262 | SF3B4 | LZE24T | Human | Esophagus | ESCC | 8.04e-25 | 8.90e-01 | 0.0596 |
| 10262 | SF3B4 | LZE21T | Human | Esophagus | ESCC | 1.17e-06 | 8.02e-01 | 0.0655 |
| 10262 | SF3B4 | LZE6T | Human | Esophagus | ESCC | 4.73e-06 | 5.10e-01 | 0.0845 |
| 10262 | SF3B4 | P1T-E | Human | Esophagus | ESCC | 7.36e-12 | 1.09e+00 | 0.0875 |
| 10262 | SF3B4 | P2T-E | Human | Esophagus | ESCC | 2.19e-59 | 1.31e+00 | 0.1177 |
| 10262 | SF3B4 | P4T-E | Human | Esophagus | ESCC | 2.09e-42 | 1.13e+00 | 0.1323 |
| 10262 | SF3B4 | P5T-E | Human | Esophagus | ESCC | 8.65e-67 | 1.56e+00 | 0.1327 |
| 10262 | SF3B4 | P8T-E | Human | Esophagus | ESCC | 8.24e-50 | 9.99e-01 | 0.0889 |
| 10262 | SF3B4 | P9T-E | Human | Esophagus | ESCC | 3.85e-38 | 1.15e+00 | 0.1131 |
| 10262 | SF3B4 | P10T-E | Human | Esophagus | ESCC | 3.28e-39 | 8.48e-01 | 0.116 |
| 10262 | SF3B4 | P11T-E | Human | Esophagus | ESCC | 1.97e-23 | 1.37e+00 | 0.1426 |
| 10262 | SF3B4 | P12T-E | Human | Esophagus | ESCC | 1.26e-48 | 9.32e-01 | 0.1122 |
| Page: 1 2 3 4 5 6 7 |
| Tissue | Expression Dynamics | Abbreviation |
| Colorectum (GSE201348) |  | FAP: Familial adenomatous polyposis |
| CRC: Colorectal cancer | ||
| Colorectum (HTA11) |  | AD: Adenomas |
| SER: Sessile serrated lesions | ||
| MSI-H: Microsatellite-high colorectal cancer | ||
| MSS: Microsatellite stable colorectal cancer | ||
| Esophagus |  | ESCC: Esophageal squamous cell carcinoma |
| HGIN: High-grade intraepithelial neoplasias | ||
| LGIN: Low-grade intraepithelial neoplasias | ||
| Liver | 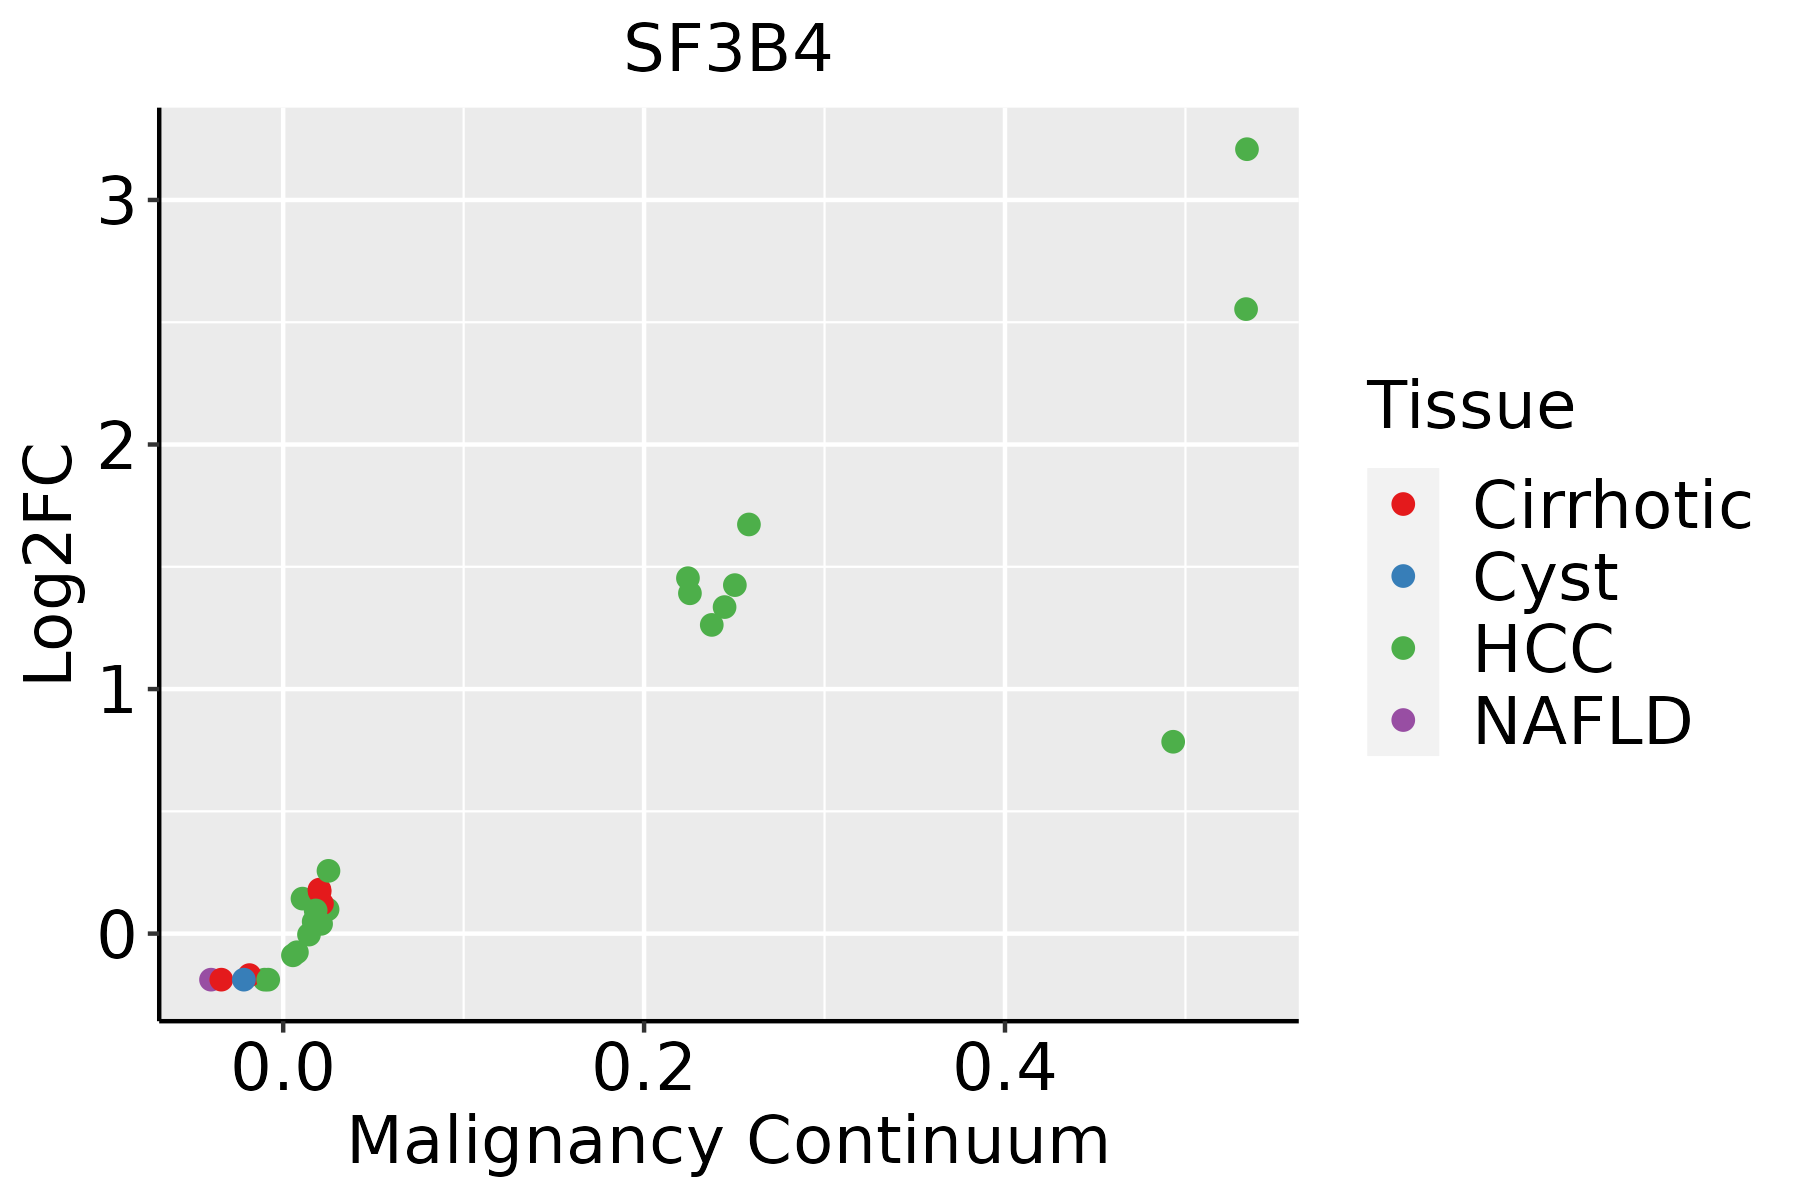 | HCC: Hepatocellular carcinoma |
| NAFLD: Non-alcoholic fatty liver disease | ||
| Oral Cavity |  | EOLP: Erosive Oral lichen planus |
| LP: leukoplakia | ||
| NEOLP: Non-erosive oral lichen planus | ||
| OSCC: Oral squamous cell carcinoma | ||
| Skin | 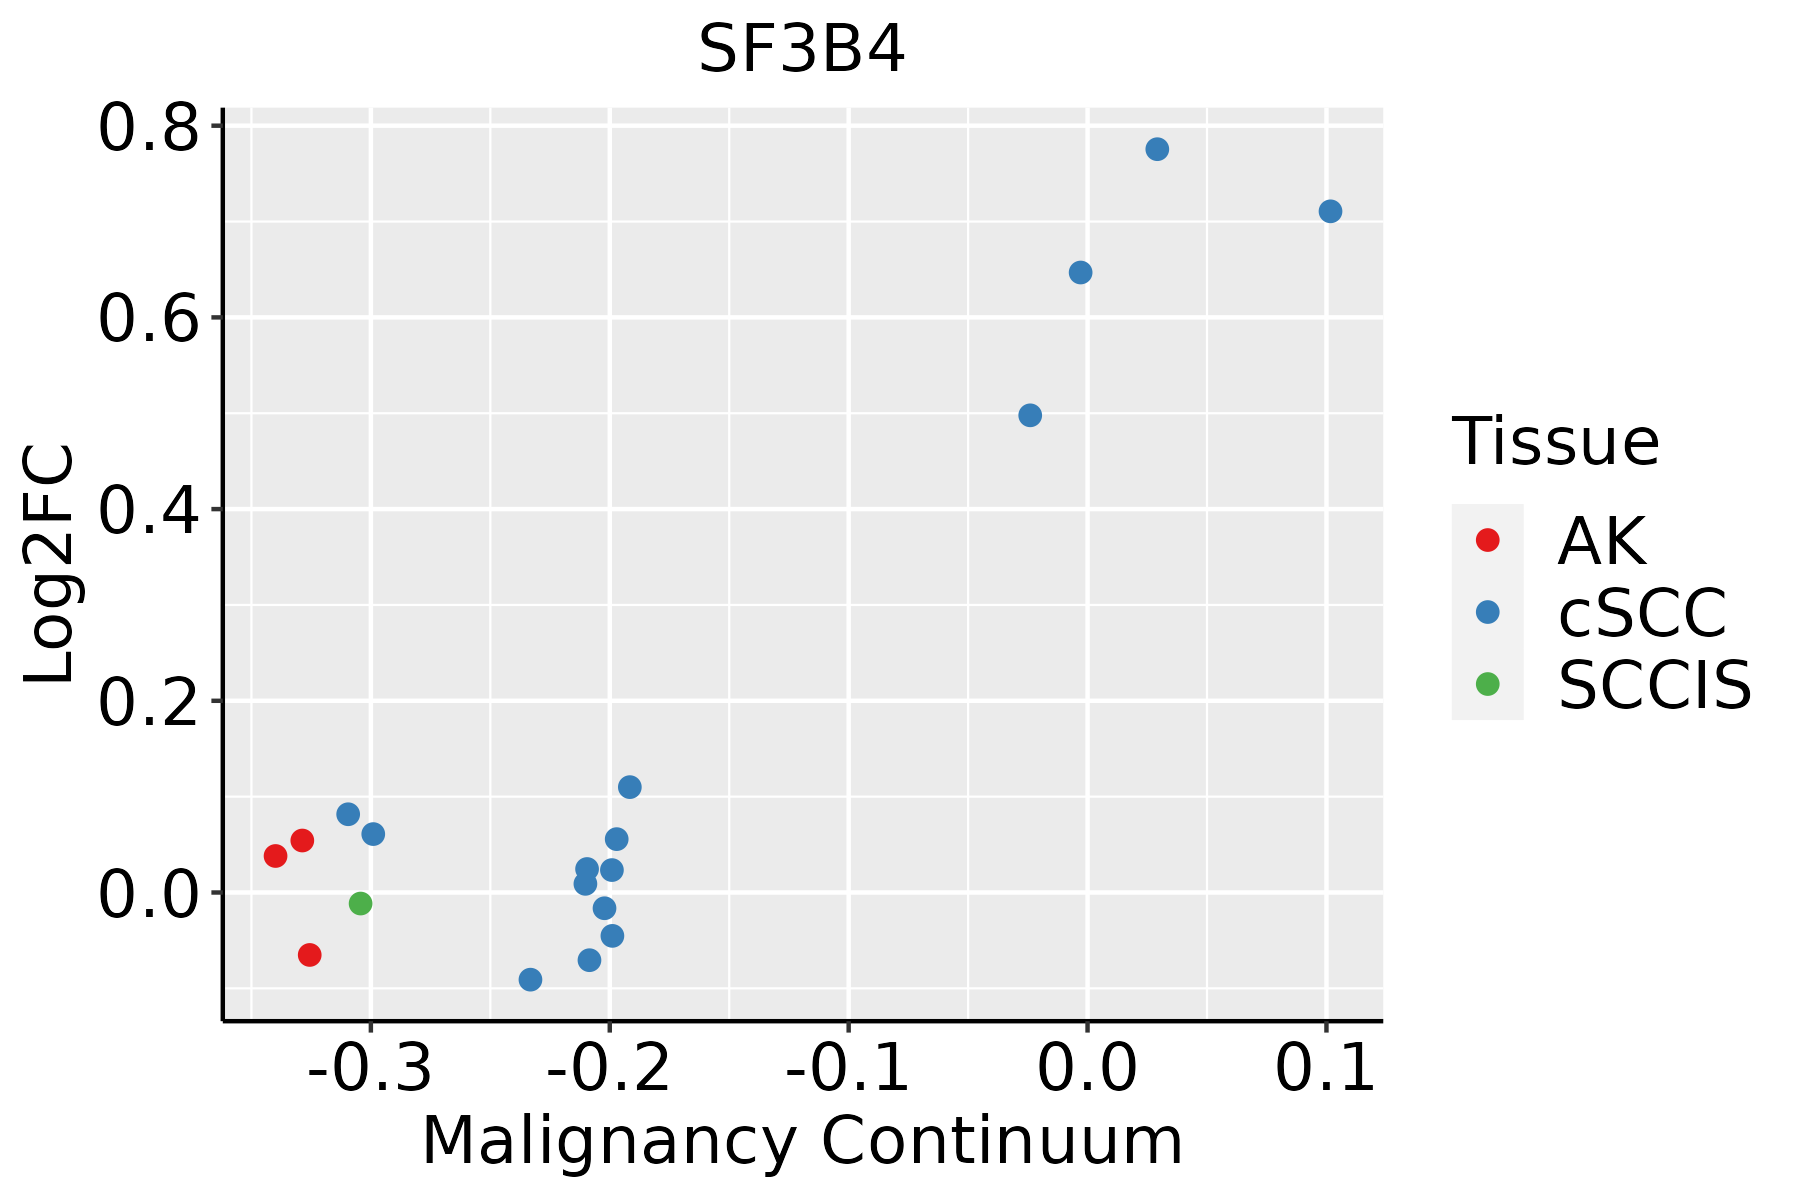 | AK: Actinic keratosis |
| cSCC: Cutaneous squamous cell carcinoma | ||
| SCCIS:squamous cell carcinoma in situ | ||
| Thyroid | 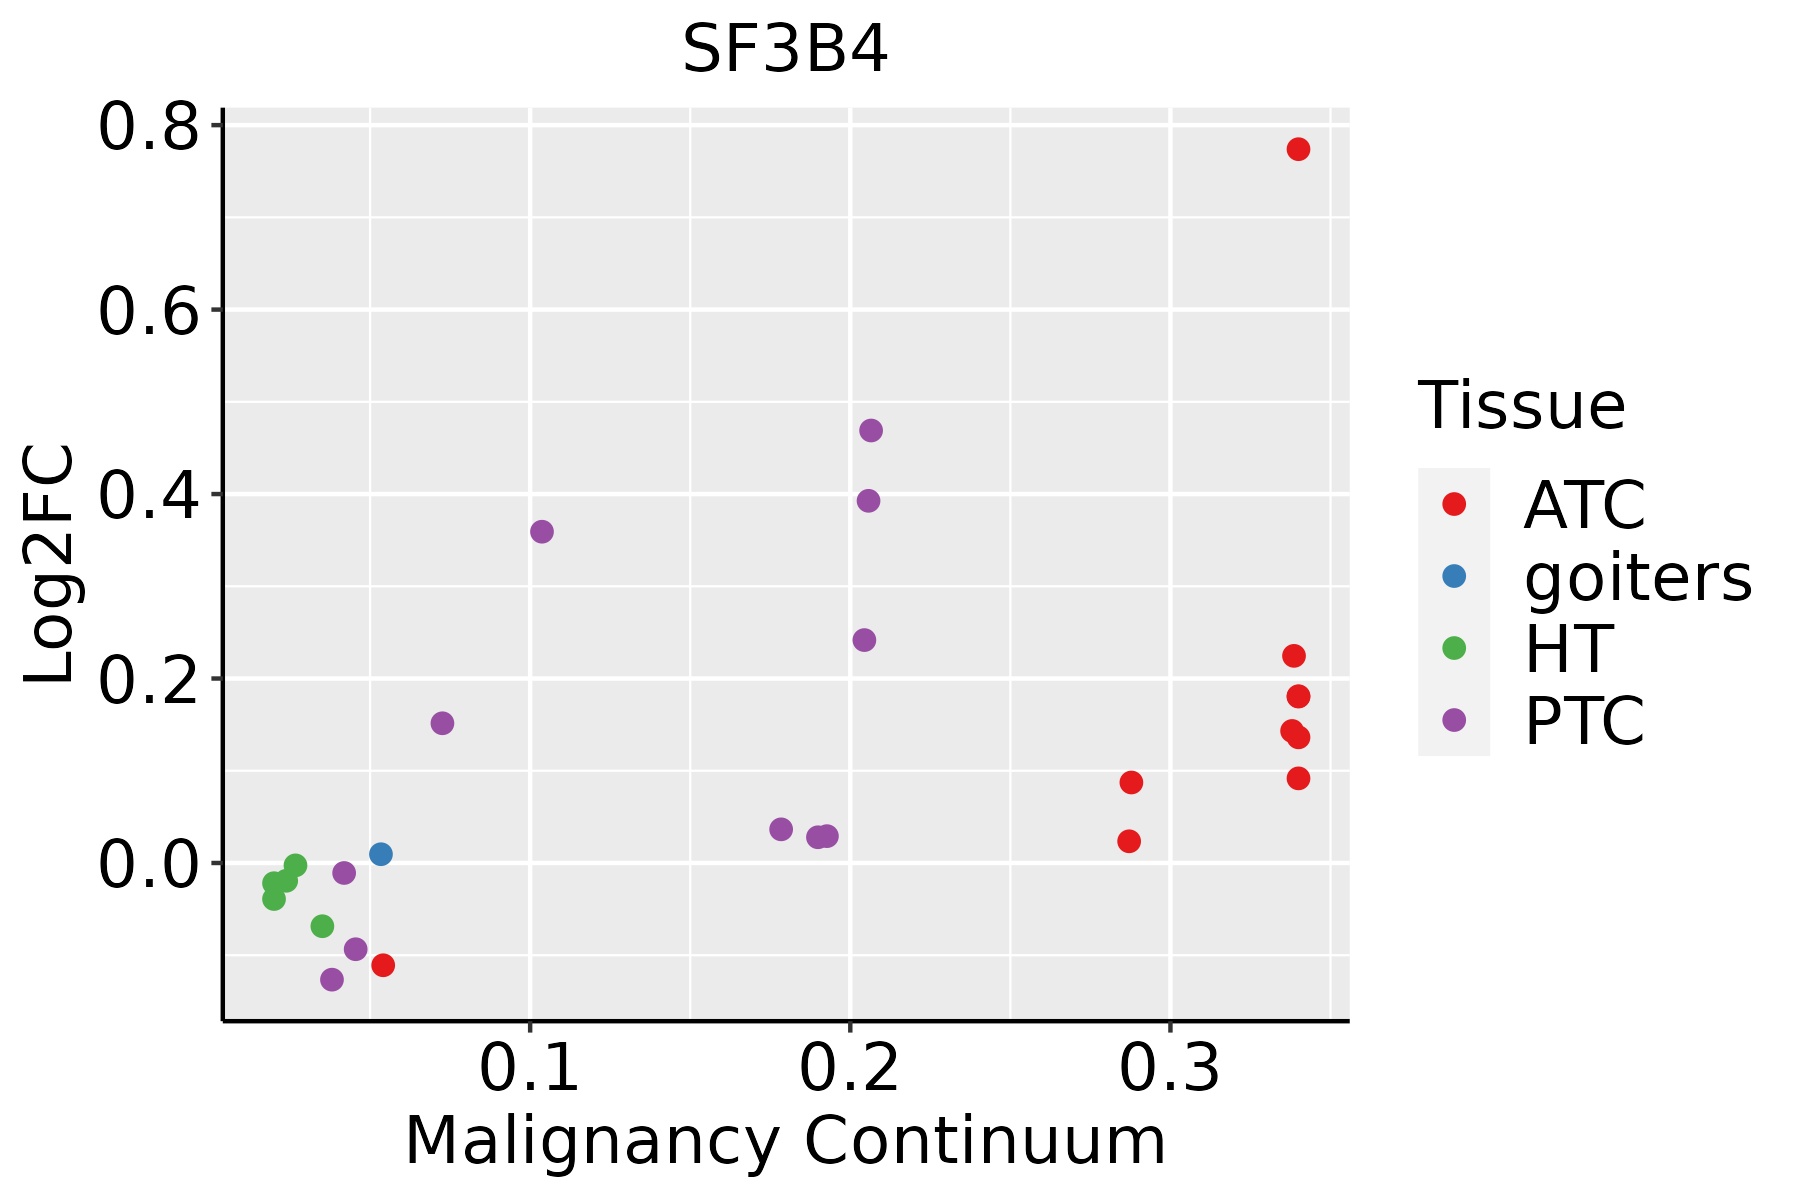 | ATC: Anaplastic thyroid cancer |
| HT: Hashimoto's thyroiditis | ||
| PTC: Papillary thyroid cancer |
| ∗log2FC in expression of this searched gene in stem-like cells from each diseased tissue sample relative to stem-like cells in normal samples in each tissue plotted against the malignancy continuum. Samples are colored based on if they are from different disease stage. |
Top |
Malignant transformation related pathway analysis |
| Find out the enriched GO biological processes and KEGG pathways involved in transition from healthy to precancer to cancer |
| Tissue | Disease Stage | Enriched GO biological Processes |
| Colorectum | AD |  |
| Colorectum | SER |  |
| Colorectum | MSS |  |
| Colorectum | MSI-H |  |
| Colorectum | FAP |  |
| ∗Top 15 enriched GO BP terms are showed in the bar plot of each disease state in each tissue. Each row represents a significant GO biological process which is colored according to the -log10(p.adjust). |
| Page: 1 2 3 4 5 6 7 8 9 |
| GO ID | Tissue | Disease Stage | Description | Gene Ratio | Bg Ratio | pvalue | p.adjust | Count |
| GO:0008380 | Colorectum | AD | RNA splicing | 169/3918 | 434/18723 | 3.59e-18 | 2.04e-15 | 169 |
| GO:0000377 | Colorectum | AD | RNA splicing, via transesterification reactions with bulged adenosine as nucleophile | 130/3918 | 320/18723 | 5.88e-16 | 2.16e-13 | 130 |
| GO:0000398 | Colorectum | AD | mRNA splicing, via spliceosome | 130/3918 | 320/18723 | 5.88e-16 | 2.16e-13 | 130 |
| GO:0000375 | Colorectum | AD | RNA splicing, via transesterification reactions | 131/3918 | 324/18723 | 7.11e-16 | 2.22e-13 | 131 |
| GO:1903311 | Colorectum | AD | regulation of mRNA metabolic process | 117/3918 | 288/18723 | 1.69e-14 | 4.23e-12 | 117 |
| GO:0043484 | Colorectum | AD | regulation of RNA splicing | 70/3918 | 148/18723 | 6.47e-13 | 1.16e-10 | 70 |
| GO:0048024 | Colorectum | AD | regulation of mRNA splicing, via spliceosome | 50/3918 | 101/18723 | 1.62e-10 | 1.56e-08 | 50 |
| GO:0050684 | Colorectum | AD | regulation of mRNA processing | 61/3918 | 137/18723 | 4.23e-10 | 3.58e-08 | 61 |
| GO:1903313 | Colorectum | AD | positive regulation of mRNA metabolic process | 44/3918 | 118/18723 | 3.20e-05 | 5.87e-04 | 44 |
| GO:0033120 | Colorectum | AD | positive regulation of RNA splicing | 19/3918 | 37/18723 | 4.08e-05 | 7.26e-04 | 19 |
| GO:0048026 | Colorectum | AD | positive regulation of mRNA splicing, via spliceosome | 12/3918 | 22/18723 | 5.38e-04 | 5.74e-03 | 12 |
| GO:0008380111 | Esophagus | ESCC | RNA splicing | 336/8552 | 434/18723 | 1.74e-42 | 3.67e-39 | 336 |
| GO:0000375111 | Esophagus | ESCC | RNA splicing, via transesterification reactions | 248/8552 | 324/18723 | 3.05e-30 | 1.49e-27 | 248 |
| GO:0000377111 | Esophagus | ESCC | RNA splicing, via transesterification reactions with bulged adenosine as nucleophile | 244/8552 | 320/18723 | 2.52e-29 | 1.07e-26 | 244 |
| GO:0000398111 | Esophagus | ESCC | mRNA splicing, via spliceosome | 244/8552 | 320/18723 | 2.52e-29 | 1.07e-26 | 244 |
| GO:1903311110 | Esophagus | ESCC | regulation of mRNA metabolic process | 210/8552 | 288/18723 | 3.25e-21 | 5.56e-19 | 210 |
| GO:0043484111 | Esophagus | ESCC | regulation of RNA splicing | 116/8552 | 148/18723 | 3.18e-16 | 2.38e-14 | 116 |
| GO:0050684110 | Esophagus | ESCC | regulation of mRNA processing | 109/8552 | 137/18723 | 3.51e-16 | 2.59e-14 | 109 |
| GO:0048024111 | Esophagus | ESCC | regulation of mRNA splicing, via spliceosome | 78/8552 | 101/18723 | 8.72e-11 | 2.66e-09 | 78 |
| GO:190331316 | Esophagus | ESCC | positive regulation of mRNA metabolic process | 87/8552 | 118/18723 | 5.10e-10 | 1.32e-08 | 87 |
| Page: 1 2 3 4 5 6 |
| Pathway ID | Tissue | Disease Stage | Description | Gene Ratio | Bg Ratio | pvalue | p.adjust | qvalue | Count |
| hsa0304027 | Esophagus | ESCC | Spliceosome | 128/4205 | 217/8465 | 3.31e-03 | 8.79e-03 | 4.50e-03 | 128 |
| hsa0304037 | Esophagus | ESCC | Spliceosome | 128/4205 | 217/8465 | 3.31e-03 | 8.79e-03 | 4.50e-03 | 128 |
| hsa030407 | Liver | Cirrhotic | Spliceosome | 102/2530 | 217/8465 | 5.69e-08 | 9.47e-07 | 5.84e-07 | 102 |
| hsa0304012 | Liver | Cirrhotic | Spliceosome | 102/2530 | 217/8465 | 5.69e-08 | 9.47e-07 | 5.84e-07 | 102 |
| hsa0304022 | Liver | HCC | Spliceosome | 122/4020 | 217/8465 | 5.55e-03 | 1.60e-02 | 8.91e-03 | 122 |
| hsa0304032 | Liver | HCC | Spliceosome | 122/4020 | 217/8465 | 5.55e-03 | 1.60e-02 | 8.91e-03 | 122 |
| hsa0304016 | Oral cavity | OSCC | Spliceosome | 123/3704 | 217/8465 | 7.21e-05 | 2.74e-04 | 1.40e-04 | 123 |
| hsa0304017 | Oral cavity | OSCC | Spliceosome | 123/3704 | 217/8465 | 7.21e-05 | 2.74e-04 | 1.40e-04 | 123 |
| hsa0304026 | Oral cavity | LP | Spliceosome | 106/2418 | 217/8465 | 1.30e-10 | 2.40e-09 | 1.55e-09 | 106 |
| hsa0304036 | Oral cavity | LP | Spliceosome | 106/2418 | 217/8465 | 1.30e-10 | 2.40e-09 | 1.55e-09 | 106 |
| Page: 1 |
Top |
Cell-cell communication analysis |
| Identification of potential cell-cell interactions between two cell types and their ligand-receptor pairs for different disease states |
| Ligand | Receptor | LRpair | Pathway | Tissue | Disease Stage |
| Page: 1 |
Top |
Single-cell gene regulatory network inference analysis |
| Find out the significant the regulons (TFs) and the target genes of each regulon across cell types for different disease states |
| TF | Cell Type | Tissue | Disease Stage | Target Gene | RSS | Regulon Activity |
| ∗The dot plots of a searched regulon are shown for all cell subpopulations in each disease state of each tissue based on the regulon specific score inferred using pySCENIC and by calculating the average expression. |
| Page: 1 |
Top |
Somatic mutation of malignant transformation related genes |
| Annotation of somatic variants for genes involved in malignant transformation |
| Hugo Symbol | Variant Class | Variant Classification | dbSNP RS | HGVSc | HGVSp | HGVSp Short | SWISSPROT | BIOTYPE | SIFT | PolyPhen | Tumor Sample Barcode | Tissue | Histology | Sex | Age | Stage | Therapy Types | Drugs | Outcome |
| SF3B4 | SNV | Missense_Mutation | c.1061G>T | p.Arg354Leu | p.R354L | Q15427 | protein_coding | deleterious(0.01) | benign(0.048) | TCGA-A2-A0CW-01 | Breast | breast invasive carcinoma | Female | >=65 | I/II | Hormone Therapy | anastrozole | SD | |
| SF3B4 | SNV | Missense_Mutation | c.360N>G | p.Phe120Leu | p.F120L | Q15427 | protein_coding | deleterious(0.03) | probably_damaging(0.998) | TCGA-C8-A12P-01 | Breast | breast invasive carcinoma | Female | <65 | I/II | Unknown | Unknown | SD | |
| SF3B4 | insertion | Frame_Shift_Ins | rs782357237 | c.1060dupC | p.Arg354ProfsTer132 | p.R354Pfs*132 | Q15427 | protein_coding | TCGA-D8-A13Y-01 | Breast | breast invasive carcinoma | Female | <65 | I/II | Chemotherapy | doxorubicin | SD | ||
| SF3B4 | SNV | Missense_Mutation | novel | c.718N>T | p.Pro240Ser | p.P240S | Q15427 | protein_coding | tolerated(0.19) | benign(0.009) | TCGA-HM-A6W2-06 | Cervix | cervical & endocervical cancer | Female | <65 | I/II | Chemotherapy | cisplatin | SD |
| SF3B4 | SNV | Missense_Mutation | c.869A>G | p.His290Arg | p.H290R | Q15427 | protein_coding | tolerated(0.3) | benign(0.007) | TCGA-A6-2686-01 | Colorectum | colon adenocarcinoma | Female | >=65 | I/II | Unknown | Unknown | SD | |
| SF3B4 | SNV | Missense_Mutation | novel | c.1249N>A | p.Pro417Thr | p.P417T | Q15427 | protein_coding | deleterious_low_confidence(0) | probably_damaging(0.981) | TCGA-AA-3947-01 | Colorectum | colon adenocarcinoma | Female | <65 | I/II | Unknown | Unknown | SD |
| SF3B4 | SNV | Missense_Mutation | novel | c.1259G>A | p.Gly420Asp | p.G420D | Q15427 | protein_coding | deleterious_low_confidence(0) | benign(0.029) | TCGA-AA-3949-01 | Colorectum | colon adenocarcinoma | Female | >=65 | III/IV | Unknown | Unknown | SD |
| SF3B4 | SNV | Missense_Mutation | c.578G>A | p.Arg193Gln | p.R193Q | Q15427 | protein_coding | deleterious(0.05) | probably_damaging(0.95) | TCGA-AA-A00N-01 | Colorectum | colon adenocarcinoma | Male | >=65 | I/II | Unknown | Unknown | PD | |
| SF3B4 | SNV | Missense_Mutation | c.1120N>T | p.Arg374Cys | p.R374C | Q15427 | protein_coding | deleterious_low_confidence(0.01) | possibly_damaging(0.725) | TCGA-D5-6540-01 | Colorectum | colon adenocarcinoma | Male | >=65 | I/II | Unknown | Unknown | SD | |
| SF3B4 | SNV | Missense_Mutation | c.940N>T | p.His314Tyr | p.H314Y | Q15427 | protein_coding | deleterious(0) | benign(0.066) | TCGA-G4-6588-01 | Colorectum | colon adenocarcinoma | Female | <65 | I/II | Unknown | Unknown | SD |
| Page: 1 2 3 4 5 |
Top |
Related drugs of malignant transformation related genes |
| Identification of chemicals and drugs interact with genes involved in malignant transfromation |
| (DGIdb 4.0) |
| Entrez ID | Symbol | Category | Interaction Types | Drug Claim Name | Drug Name | PMIDs |
| Page: 1 |

Copyright 2023-Present -The University of Texas Health Science Center at Houston |