
|
|||||
|
 | |
| |
| |
| |
| |
| |
|
Gene: SF3B2 |
Gene summary for SF3B2 |
| Gene information | Species | Human | Gene symbol | SF3B2 | Gene ID | 10992 |
| Gene name | splicing factor 3b subunit 2 | |
| Gene Alias | Cus1 | |
| Cytomap | 11q13.1 | |
| Gene Type | protein-coding | GO ID | GO:0000375 | UniProtAcc | Q13435 |
Top |
Malignant transformation analysis |
| Identification of the aberrant gene expression in precancerous and cancerous lesions by comparing the gene expression of stem-like cells in diseased tissues with normal stem cells |
| Entrez ID | Symbol | Replicates | Species | Organ | Tissue | Adj P-value | Log2FC | Malignancy |
| 10992 | SF3B2 | HTA11_3410_2000001011 | Human | Colorectum | AD | 3.19e-02 | 1.44e-01 | 0.0155 |
| 10992 | SF3B2 | HTA11_2487_2000001011 | Human | Colorectum | SER | 4.00e-02 | 3.40e-01 | -0.1808 |
| 10992 | SF3B2 | HTA11_1938_2000001011 | Human | Colorectum | AD | 5.38e-08 | 5.99e-01 | -0.0811 |
| 10992 | SF3B2 | HTA11_78_2000001011 | Human | Colorectum | AD | 1.04e-04 | 3.88e-01 | -0.1088 |
| 10992 | SF3B2 | HTA11_347_2000001011 | Human | Colorectum | AD | 7.77e-20 | 6.52e-01 | -0.1954 |
| 10992 | SF3B2 | HTA11_411_2000001011 | Human | Colorectum | SER | 8.17e-06 | 7.97e-01 | -0.2602 |
| 10992 | SF3B2 | HTA11_2112_2000001011 | Human | Colorectum | SER | 5.82e-03 | 4.05e-01 | -0.2196 |
| 10992 | SF3B2 | HTA11_3361_2000001011 | Human | Colorectum | AD | 1.37e-04 | 5.47e-01 | -0.1207 |
| 10992 | SF3B2 | HTA11_83_2000001011 | Human | Colorectum | SER | 6.18e-06 | 4.77e-01 | -0.1526 |
| 10992 | SF3B2 | HTA11_696_2000001011 | Human | Colorectum | AD | 1.23e-25 | 7.01e-01 | -0.1464 |
| 10992 | SF3B2 | HTA11_866_2000001011 | Human | Colorectum | AD | 3.99e-15 | 4.87e-01 | -0.1001 |
| 10992 | SF3B2 | HTA11_1391_2000001011 | Human | Colorectum | AD | 2.78e-21 | 8.02e-01 | -0.059 |
| 10992 | SF3B2 | HTA11_2992_2000001011 | Human | Colorectum | SER | 1.33e-02 | 5.34e-01 | -0.1706 |
| 10992 | SF3B2 | HTA11_546_2000001011 | Human | Colorectum | AD | 3.65e-06 | 5.78e-01 | -0.0842 |
| 10992 | SF3B2 | HTA11_866_3004761011 | Human | Colorectum | AD | 3.10e-14 | 6.41e-01 | 0.096 |
| 10992 | SF3B2 | HTA11_7663_2000001011 | Human | Colorectum | SER | 5.79e-06 | 6.00e-01 | 0.0131 |
| 10992 | SF3B2 | HTA11_6801_2000001011 | Human | Colorectum | SER | 9.18e-04 | 5.79e-01 | 0.0171 |
| 10992 | SF3B2 | HTA11_10711_2000001011 | Human | Colorectum | AD | 4.33e-06 | 3.87e-01 | 0.0338 |
| 10992 | SF3B2 | HTA11_7696_3000711011 | Human | Colorectum | AD | 8.50e-15 | 5.00e-01 | 0.0674 |
| 10992 | SF3B2 | HTA11_6818_2000001021 | Human | Colorectum | AD | 1.84e-02 | 4.42e-01 | 0.0588 |
| Page: 1 2 3 4 5 6 7 8 9 |
| Tissue | Expression Dynamics | Abbreviation |
| Colorectum (GSE201348) |  | FAP: Familial adenomatous polyposis |
| CRC: Colorectal cancer | ||
| Colorectum (HTA11) |  | AD: Adenomas |
| SER: Sessile serrated lesions | ||
| MSI-H: Microsatellite-high colorectal cancer | ||
| MSS: Microsatellite stable colorectal cancer | ||
| Endometrium | 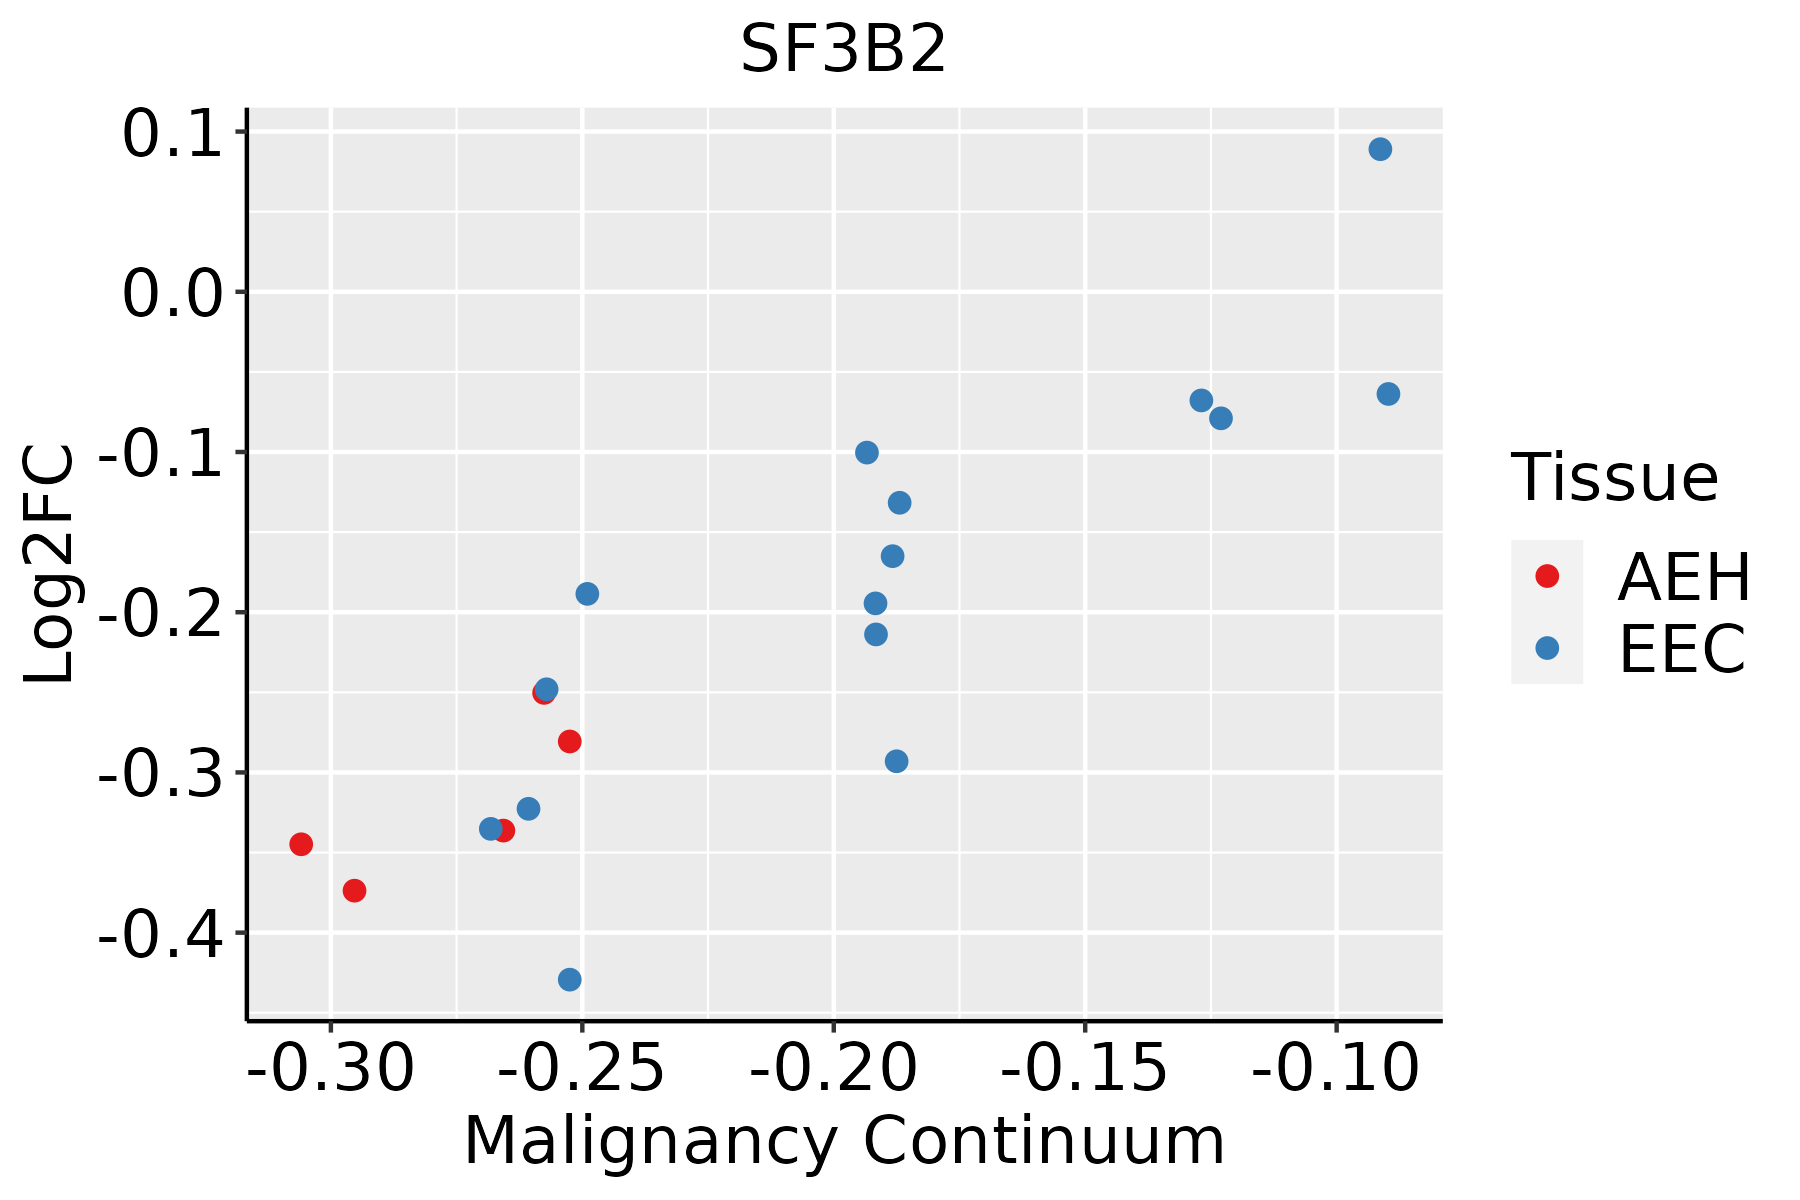 | AEH: Atypical endometrial hyperplasia |
| EEC: Endometrioid Cancer | ||
| Esophagus | 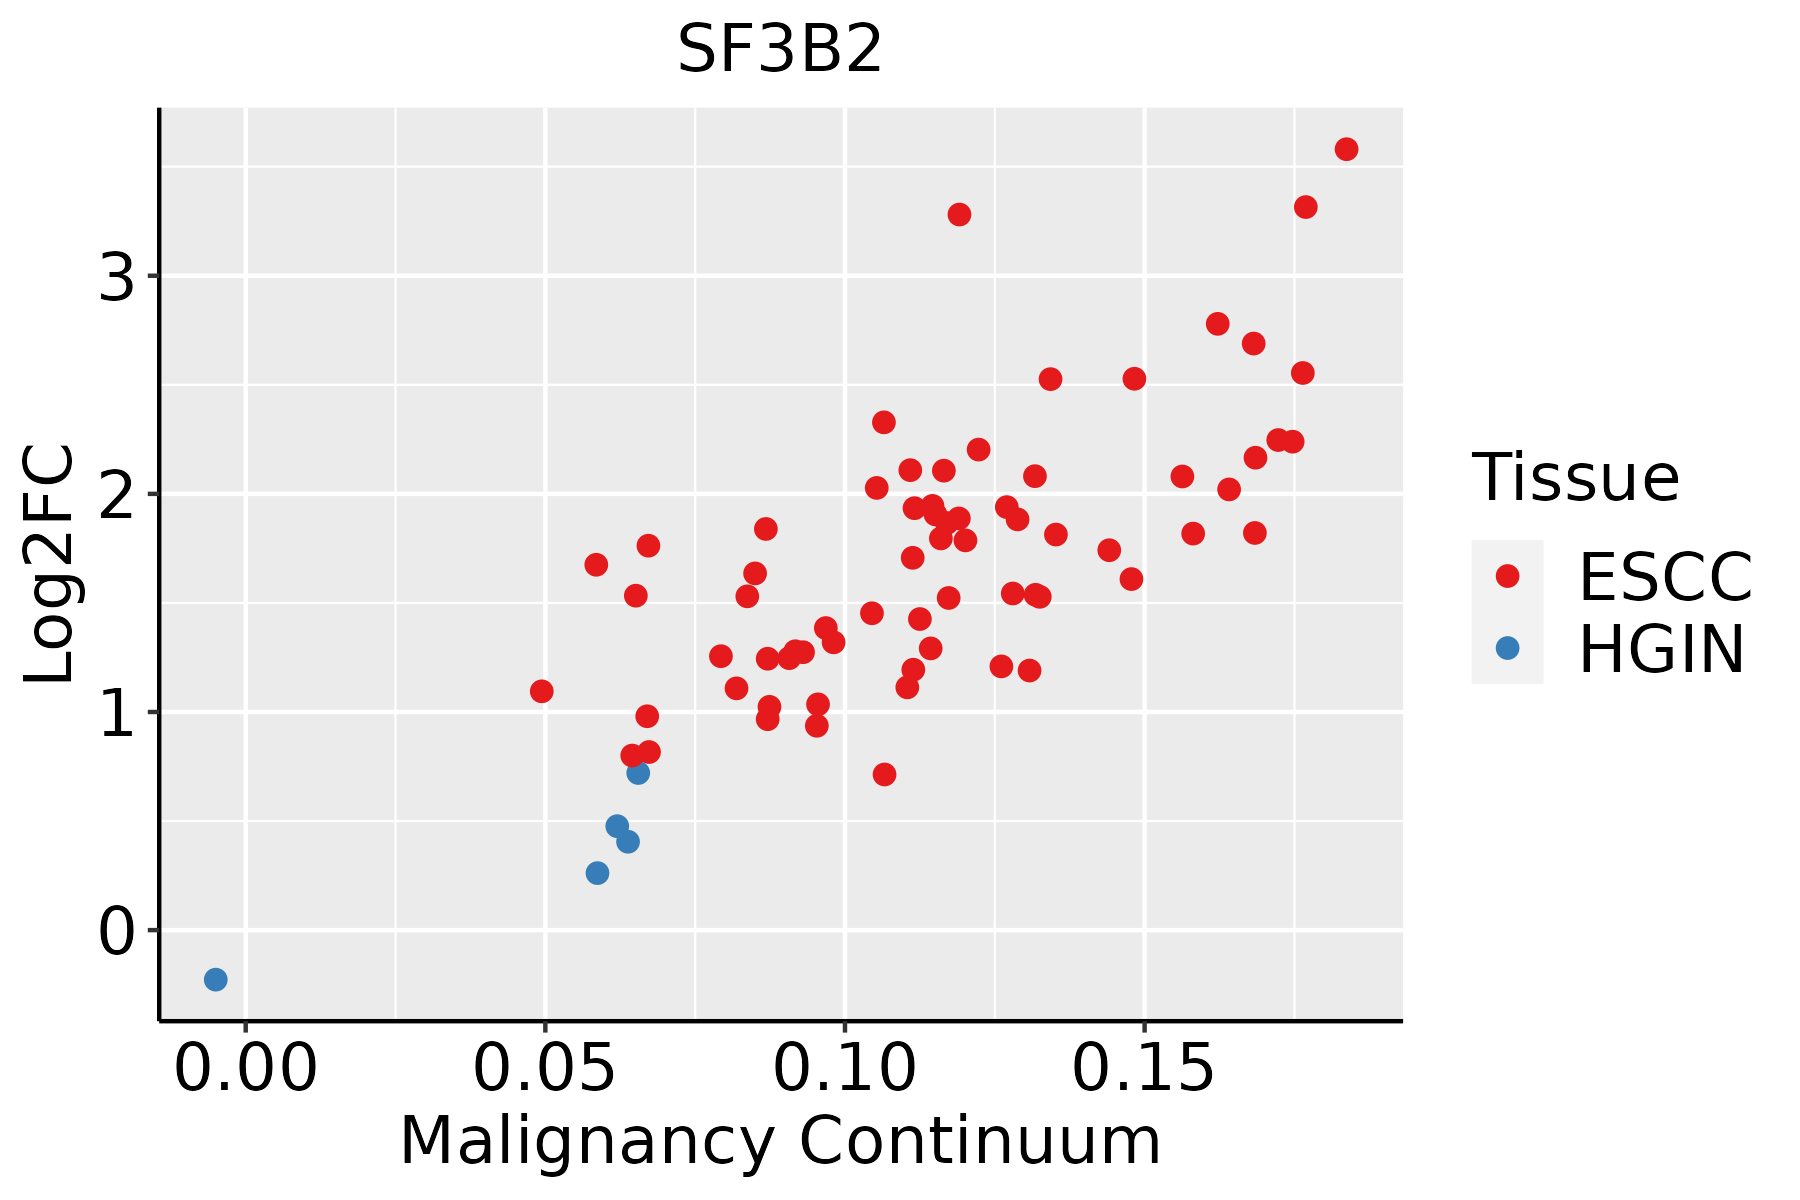 | ESCC: Esophageal squamous cell carcinoma |
| HGIN: High-grade intraepithelial neoplasias | ||
| LGIN: Low-grade intraepithelial neoplasias | ||
| Liver |  | HCC: Hepatocellular carcinoma |
| NAFLD: Non-alcoholic fatty liver disease | ||
| Oral Cavity | 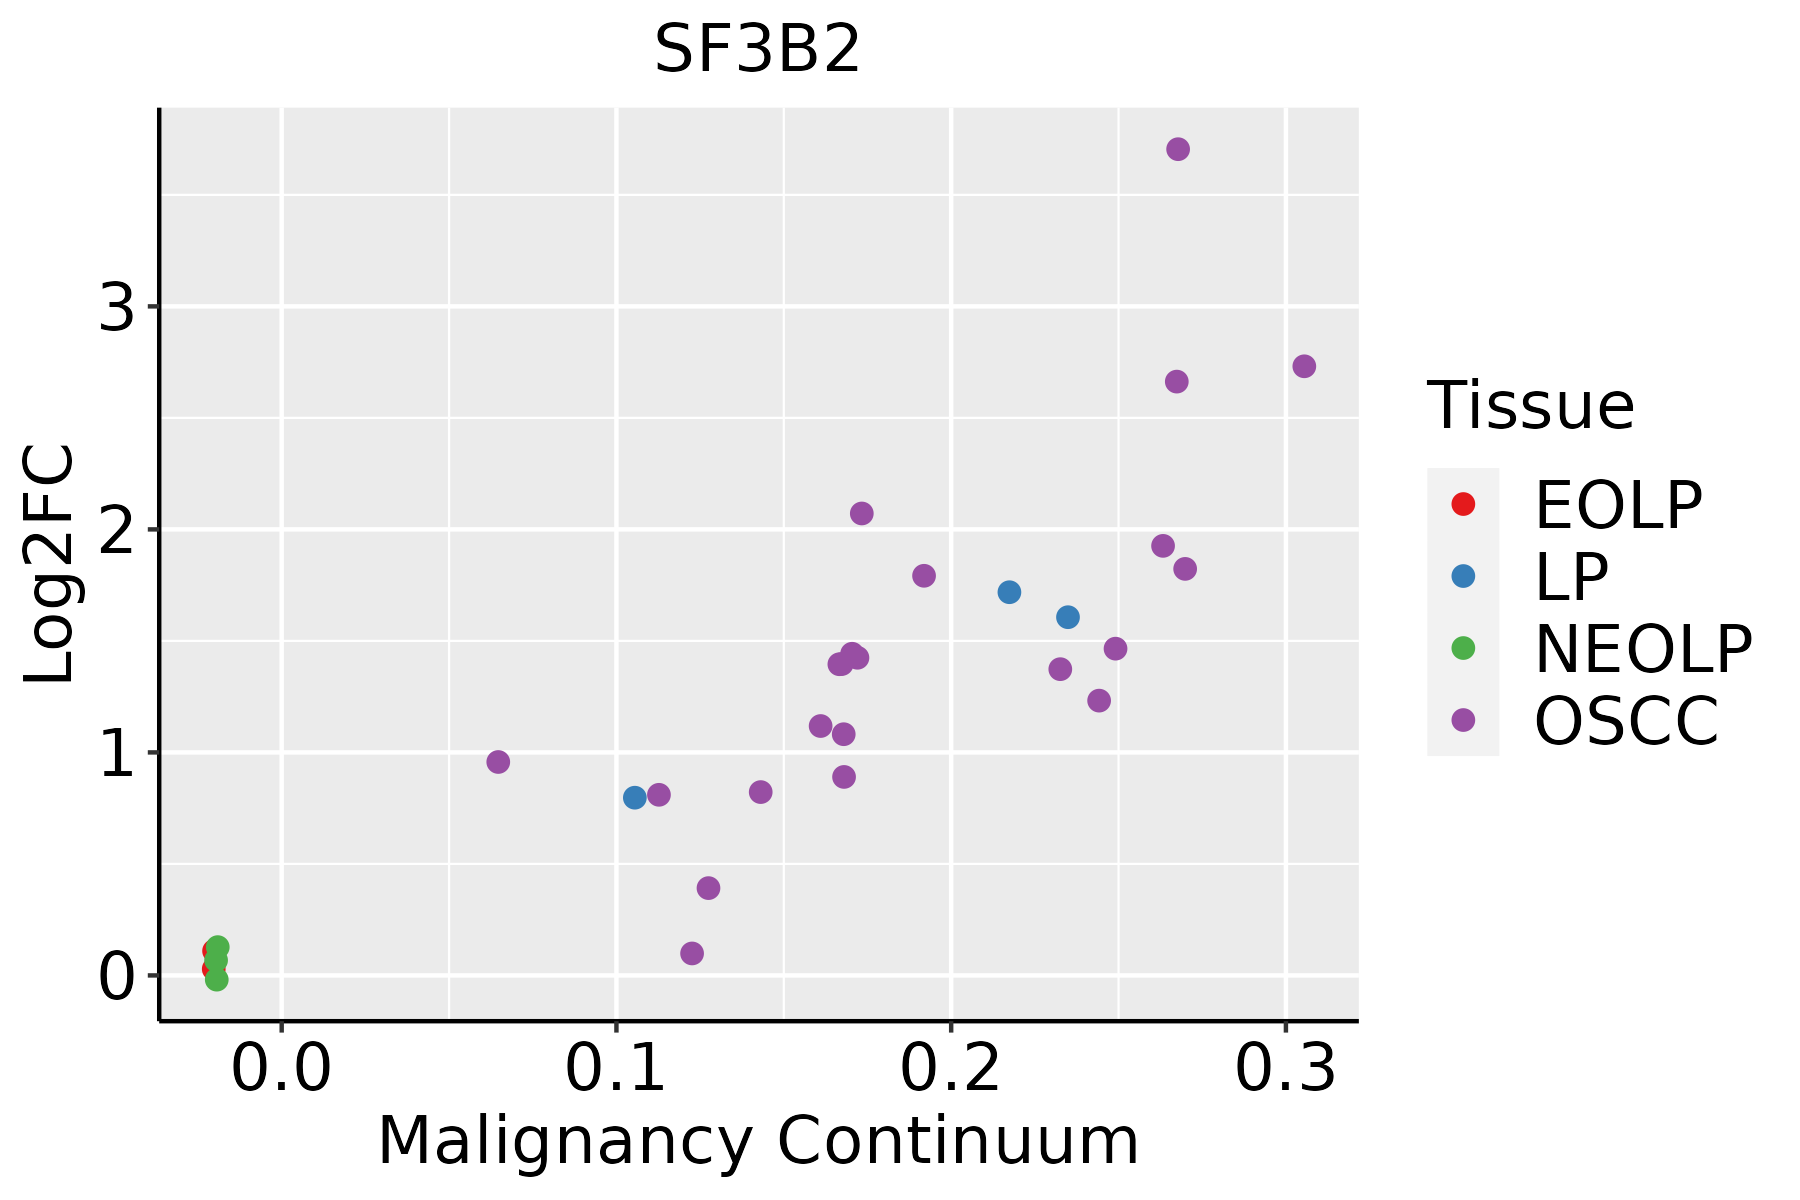 | EOLP: Erosive Oral lichen planus |
| LP: leukoplakia | ||
| NEOLP: Non-erosive oral lichen planus | ||
| OSCC: Oral squamous cell carcinoma | ||
| Skin |  | AK: Actinic keratosis |
| cSCC: Cutaneous squamous cell carcinoma | ||
| SCCIS:squamous cell carcinoma in situ | ||
| Thyroid | 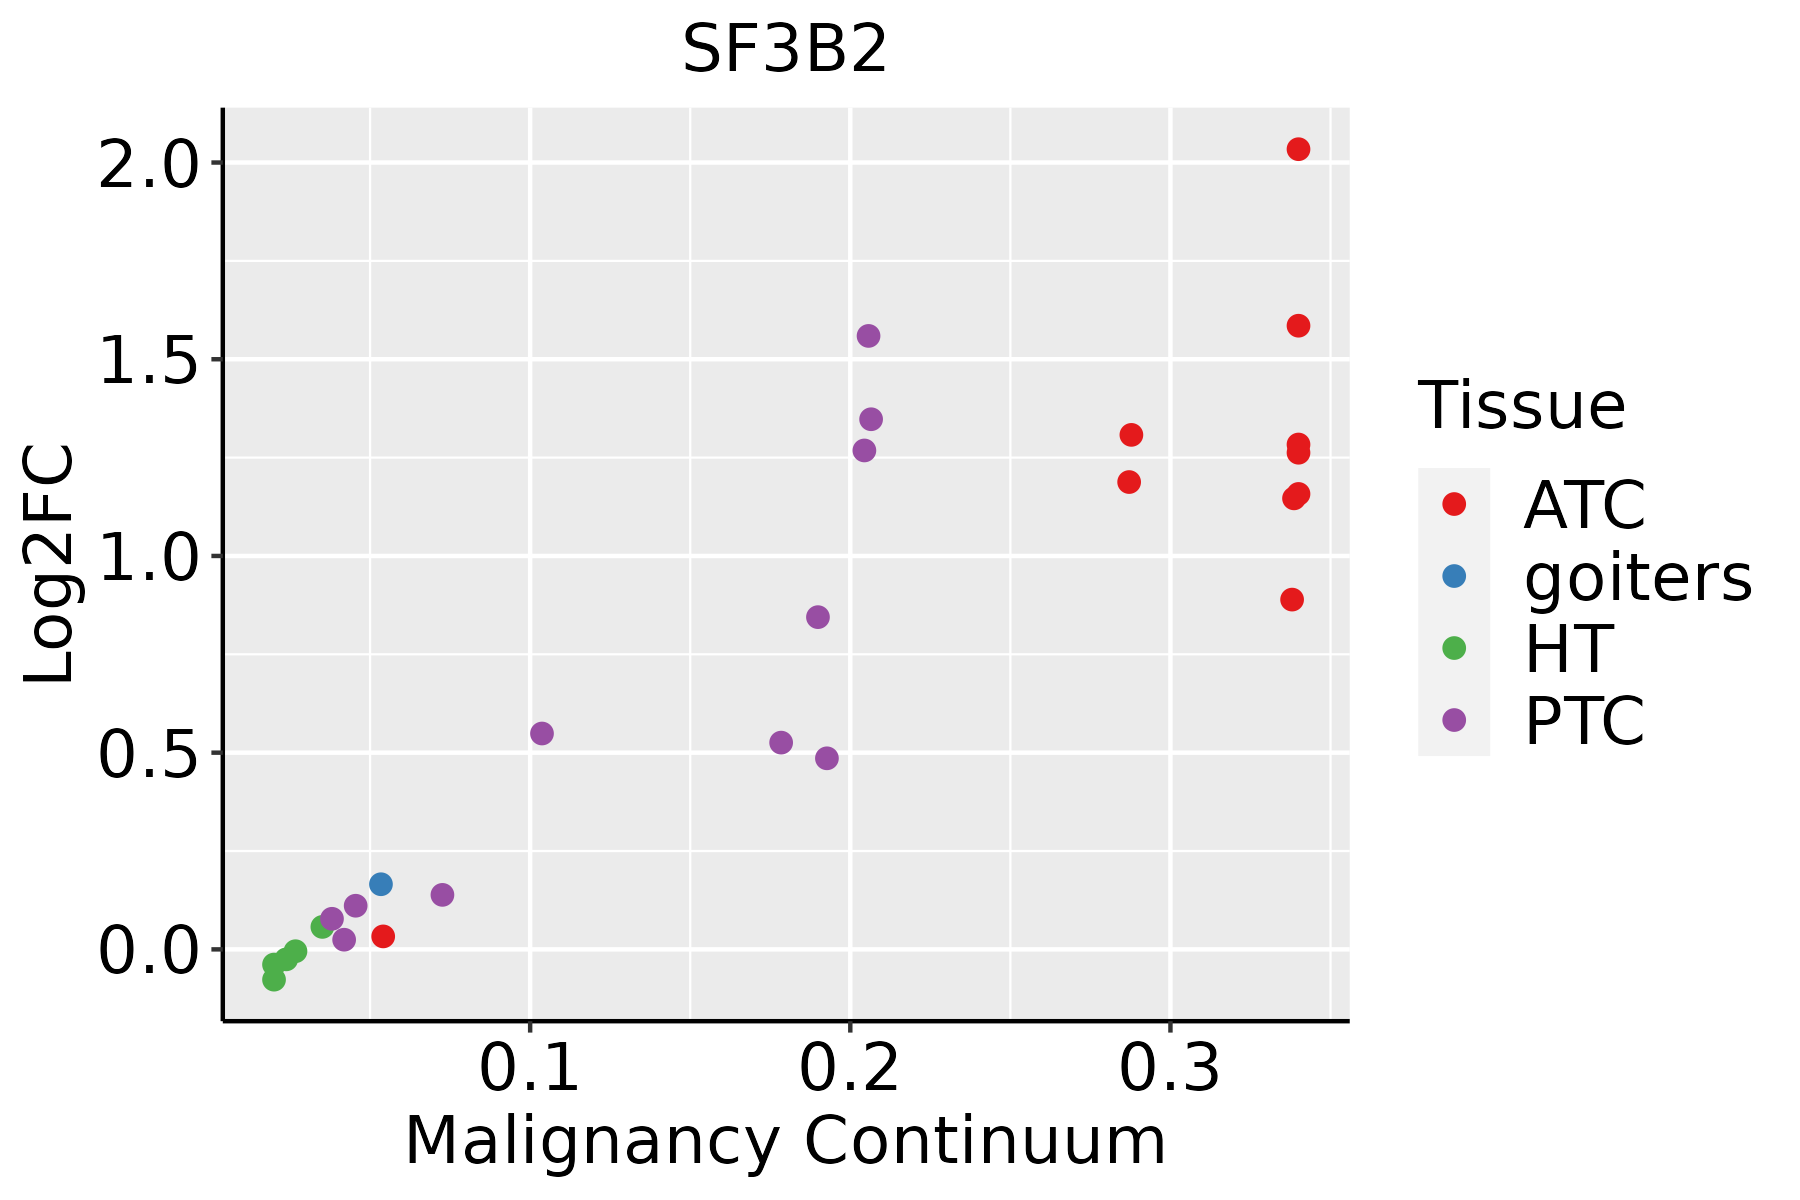 | ATC: Anaplastic thyroid cancer |
| HT: Hashimoto's thyroiditis | ||
| PTC: Papillary thyroid cancer |
| ∗log2FC in expression of this searched gene in stem-like cells from each diseased tissue sample relative to stem-like cells in normal samples in each tissue plotted against the malignancy continuum. Samples are colored based on if they are from different disease stage. |
Top |
Malignant transformation related pathway analysis |
| Find out the enriched GO biological processes and KEGG pathways involved in transition from healthy to precancer to cancer |
| Tissue | Disease Stage | Enriched GO biological Processes |
| Colorectum | AD |  |
| Colorectum | SER |  |
| Colorectum | MSS |  |
| Colorectum | MSI-H |  |
| Colorectum | FAP |  |
| ∗Top 15 enriched GO BP terms are showed in the bar plot of each disease state in each tissue. Each row represents a significant GO biological process which is colored according to the -log10(p.adjust). |
| Page: 1 2 3 4 5 6 7 8 9 |
| GO ID | Tissue | Disease Stage | Description | Gene Ratio | Bg Ratio | pvalue | p.adjust | Count |
| GO:0008380 | Colorectum | AD | RNA splicing | 169/3918 | 434/18723 | 3.59e-18 | 2.04e-15 | 169 |
| GO:0000377 | Colorectum | AD | RNA splicing, via transesterification reactions with bulged adenosine as nucleophile | 130/3918 | 320/18723 | 5.88e-16 | 2.16e-13 | 130 |
| GO:0000398 | Colorectum | AD | mRNA splicing, via spliceosome | 130/3918 | 320/18723 | 5.88e-16 | 2.16e-13 | 130 |
| GO:0000375 | Colorectum | AD | RNA splicing, via transesterification reactions | 131/3918 | 324/18723 | 7.11e-16 | 2.22e-13 | 131 |
| GO:00083801 | Colorectum | SER | RNA splicing | 123/2897 | 434/18723 | 3.84e-12 | 8.41e-10 | 123 |
| GO:00003751 | Colorectum | SER | RNA splicing, via transesterification reactions | 90/2897 | 324/18723 | 8.68e-09 | 7.50e-07 | 90 |
| GO:00003771 | Colorectum | SER | RNA splicing, via transesterification reactions with bulged adenosine as nucleophile | 89/2897 | 320/18723 | 9.82e-09 | 8.14e-07 | 89 |
| GO:00003981 | Colorectum | SER | mRNA splicing, via spliceosome | 89/2897 | 320/18723 | 9.82e-09 | 8.14e-07 | 89 |
| GO:00083802 | Colorectum | MSS | RNA splicing | 159/3467 | 434/18723 | 1.75e-19 | 1.22e-16 | 159 |
| GO:00003772 | Colorectum | MSS | RNA splicing, via transesterification reactions with bulged adenosine as nucleophile | 121/3467 | 320/18723 | 2.52e-16 | 8.27e-14 | 121 |
| GO:00003982 | Colorectum | MSS | mRNA splicing, via spliceosome | 121/3467 | 320/18723 | 2.52e-16 | 8.27e-14 | 121 |
| GO:00003752 | Colorectum | MSS | RNA splicing, via transesterification reactions | 122/3467 | 324/18723 | 2.75e-16 | 8.58e-14 | 122 |
| GO:00083803 | Colorectum | MSI-H | RNA splicing | 82/1319 | 434/18723 | 1.22e-16 | 4.53e-14 | 82 |
| GO:00003753 | Colorectum | MSI-H | RNA splicing, via transesterification reactions | 67/1319 | 324/18723 | 7.99e-16 | 2.61e-13 | 67 |
| GO:00003773 | Colorectum | MSI-H | RNA splicing, via transesterification reactions with bulged adenosine as nucleophile | 66/1319 | 320/18723 | 1.51e-15 | 4.41e-13 | 66 |
| GO:00003983 | Colorectum | MSI-H | mRNA splicing, via spliceosome | 66/1319 | 320/18723 | 1.51e-15 | 4.41e-13 | 66 |
| GO:000838016 | Endometrium | AEH | RNA splicing | 111/2100 | 434/18723 | 2.42e-17 | 1.12e-14 | 111 |
| GO:000037515 | Endometrium | AEH | RNA splicing, via transesterification reactions | 88/2100 | 324/18723 | 1.11e-15 | 3.91e-13 | 88 |
| GO:000037715 | Endometrium | AEH | RNA splicing, via transesterification reactions with bulged adenosine as nucleophile | 87/2100 | 320/18723 | 1.51e-15 | 4.78e-13 | 87 |
| GO:000039815 | Endometrium | AEH | mRNA splicing, via spliceosome | 87/2100 | 320/18723 | 1.51e-15 | 4.78e-13 | 87 |
| Page: 1 2 3 4 |
| Pathway ID | Tissue | Disease Stage | Description | Gene Ratio | Bg Ratio | pvalue | p.adjust | qvalue | Count |
| hsa03040 | Colorectum | AD | Spliceosome | 73/2092 | 217/8465 | 1.73e-03 | 9.68e-03 | 6.18e-03 | 73 |
| hsa030401 | Colorectum | AD | Spliceosome | 73/2092 | 217/8465 | 1.73e-03 | 9.68e-03 | 6.18e-03 | 73 |
| hsa030402 | Colorectum | MSS | Spliceosome | 66/1875 | 217/8465 | 2.58e-03 | 1.27e-02 | 7.81e-03 | 66 |
| hsa030403 | Colorectum | MSS | Spliceosome | 66/1875 | 217/8465 | 2.58e-03 | 1.27e-02 | 7.81e-03 | 66 |
| hsa030404 | Colorectum | MSI-H | Spliceosome | 37/797 | 217/8465 | 2.49e-04 | 3.23e-03 | 2.70e-03 | 37 |
| hsa030405 | Colorectum | MSI-H | Spliceosome | 37/797 | 217/8465 | 2.49e-04 | 3.23e-03 | 2.70e-03 | 37 |
| hsa030409 | Endometrium | AEH | Spliceosome | 54/1197 | 217/8465 | 1.47e-05 | 1.65e-04 | 1.21e-04 | 54 |
| hsa0304014 | Endometrium | AEH | Spliceosome | 54/1197 | 217/8465 | 1.47e-05 | 1.65e-04 | 1.21e-04 | 54 |
| hsa0304024 | Endometrium | EEC | Spliceosome | 54/1237 | 217/8465 | 3.78e-05 | 3.88e-04 | 2.89e-04 | 54 |
| hsa0304034 | Endometrium | EEC | Spliceosome | 54/1237 | 217/8465 | 3.78e-05 | 3.88e-04 | 2.89e-04 | 54 |
| hsa0304018 | Esophagus | HGIN | Spliceosome | 79/1383 | 217/8465 | 3.22e-13 | 7.00e-12 | 5.56e-12 | 79 |
| hsa0304019 | Esophagus | HGIN | Spliceosome | 79/1383 | 217/8465 | 3.22e-13 | 7.00e-12 | 5.56e-12 | 79 |
| hsa0304027 | Esophagus | ESCC | Spliceosome | 128/4205 | 217/8465 | 3.31e-03 | 8.79e-03 | 4.50e-03 | 128 |
| hsa0304037 | Esophagus | ESCC | Spliceosome | 128/4205 | 217/8465 | 3.31e-03 | 8.79e-03 | 4.50e-03 | 128 |
| hsa030407 | Liver | Cirrhotic | Spliceosome | 102/2530 | 217/8465 | 5.69e-08 | 9.47e-07 | 5.84e-07 | 102 |
| hsa0304012 | Liver | Cirrhotic | Spliceosome | 102/2530 | 217/8465 | 5.69e-08 | 9.47e-07 | 5.84e-07 | 102 |
| hsa0304022 | Liver | HCC | Spliceosome | 122/4020 | 217/8465 | 5.55e-03 | 1.60e-02 | 8.91e-03 | 122 |
| hsa0304032 | Liver | HCC | Spliceosome | 122/4020 | 217/8465 | 5.55e-03 | 1.60e-02 | 8.91e-03 | 122 |
| hsa0304016 | Oral cavity | OSCC | Spliceosome | 123/3704 | 217/8465 | 7.21e-05 | 2.74e-04 | 1.40e-04 | 123 |
| hsa0304017 | Oral cavity | OSCC | Spliceosome | 123/3704 | 217/8465 | 7.21e-05 | 2.74e-04 | 1.40e-04 | 123 |
| Page: 1 2 |
Top |
Cell-cell communication analysis |
| Identification of potential cell-cell interactions between two cell types and their ligand-receptor pairs for different disease states |
| Ligand | Receptor | LRpair | Pathway | Tissue | Disease Stage |
| Page: 1 |
Top |
Single-cell gene regulatory network inference analysis |
| Find out the significant the regulons (TFs) and the target genes of each regulon across cell types for different disease states |
| TF | Cell Type | Tissue | Disease Stage | Target Gene | RSS | Regulon Activity |
| ∗The dot plots of a searched regulon are shown for all cell subpopulations in each disease state of each tissue based on the regulon specific score inferred using pySCENIC and by calculating the average expression. |
| Page: 1 |
Top |
Somatic mutation of malignant transformation related genes |
| Annotation of somatic variants for genes involved in malignant transformation |
| Hugo Symbol | Variant Class | Variant Classification | dbSNP RS | HGVSc | HGVSp | HGVSp Short | SWISSPROT | BIOTYPE | SIFT | PolyPhen | Tumor Sample Barcode | Tissue | Histology | Sex | Age | Stage | Therapy Types | Drugs | Outcome |
| SF3B2 | SNV | Missense_Mutation | c.920N>T | p.Ser307Leu | p.S307L | Q13435 | protein_coding | tolerated(0.17) | benign(0) | TCGA-A2-A0T4-01 | Breast | breast invasive carcinoma | Female | <65 | I/II | Hormone Therapy | femara | SD | |
| SF3B2 | SNV | Missense_Mutation | c.1174N>A | p.Ala392Thr | p.A392T | Q13435 | protein_coding | tolerated(0.06) | benign(0.321) | TCGA-A2-A1G1-01 | Breast | breast invasive carcinoma | Female | >=65 | I/II | Unknown | Unknown | SD | |
| SF3B2 | SNV | Missense_Mutation | novel | c.2372N>C | p.Arg791Thr | p.R791T | Q13435 | protein_coding | deleterious(0.04) | possibly_damaging(0.546) | TCGA-A2-A25F-01 | Breast | breast invasive carcinoma | Female | >=65 | I/II | Chemotherapy | taxotere | SD |
| SF3B2 | SNV | Missense_Mutation | novel | c.665G>T | p.Arg222Leu | p.R222L | Q13435 | protein_coding | deleterious_low_confidence(0.01) | probably_damaging(0.931) | TCGA-AC-A3TM-01 | Breast | breast invasive carcinoma | Female | <65 | III/IV | Chemotherapy | cytoxan | CR |
| SF3B2 | SNV | Missense_Mutation | novel | c.1140N>T | p.Glu380Asp | p.E380D | Q13435 | protein_coding | tolerated(1) | benign(0.003) | TCGA-AC-A8OR-01 | Breast | breast invasive carcinoma | Female | >=65 | I/II | Unknown | Unknown | SD |
| SF3B2 | SNV | Missense_Mutation | rs200930603 | c.1072N>T | p.Arg358Cys | p.R358C | Q13435 | protein_coding | deleterious(0.02) | possibly_damaging(0.489) | TCGA-D8-A1XQ-01 | Breast | breast invasive carcinoma | Female | >=65 | I/II | Unknown | Unknown | SD |
| SF3B2 | SNV | Missense_Mutation | novel | c.110C>T | p.Ala37Val | p.A37V | Q13435 | protein_coding | tolerated_low_confidence(0.11) | benign(0.037) | TCGA-EW-A2FV-01 | Breast | breast invasive carcinoma | Female | <65 | III/IV | Chemotherapy | docetaxel | SD |
| SF3B2 | SNV | Missense_Mutation | novel | c.1505N>A | p.Arg502His | p.R502H | Q13435 | protein_coding | deleterious(0.01) | probably_damaging(0.998) | TCGA-2W-A8YY-01 | Cervix | cervical & endocervical cancer | Female | <65 | I/II | Chemotherapy | cisplatin | CR |
| SF3B2 | SNV | Missense_Mutation | c.791N>T | p.Ser264Phe | p.S264F | Q13435 | protein_coding | deleterious_low_confidence(0) | benign(0.243) | TCGA-FU-A23L-01 | Cervix | cervical & endocervical cancer | Female | <65 | I/II | Chemotherapy | cisplatin | CR | |
| SF3B2 | SNV | Missense_Mutation | c.2128N>A | p.Glu710Lys | p.E710K | Q13435 | protein_coding | deleterious(0.04) | benign(0.049) | TCGA-LP-A4AV-01 | Cervix | cervical & endocervical cancer | Female | <65 | I/II | Unknown | Unknown | SD |
| Page: 1 2 3 4 5 6 7 8 9 |
Top |
Related drugs of malignant transformation related genes |
| Identification of chemicals and drugs interact with genes involved in malignant transfromation |
| (DGIdb 4.0) |
| Entrez ID | Symbol | Category | Interaction Types | Drug Claim Name | Drug Name | PMIDs |
| 10992 | SF3B2 | NA | SPLICEOSTATIN-A | CHEMBL1221944 | 17643111 |
| Page: 1 |

Copyright 2023-Present -The University of Texas Health Science Center at Houston |