
|
|||||
|
 | |
| |
| |
| |
| |
| |
|
Gene: SF3B1 |
Gene summary for SF3B1 |
| Gene information | Species | Human | Gene symbol | SF3B1 | Gene ID | 23451 |
| Gene name | splicing factor 3b subunit 1 | |
| Gene Alias | Hsh155 | |
| Cytomap | 2q33.1 | |
| Gene Type | protein-coding | GO ID | GO:0000245 | UniProtAcc | B4DGZ4 |
Top |
Malignant transformation analysis |
| Identification of the aberrant gene expression in precancerous and cancerous lesions by comparing the gene expression of stem-like cells in diseased tissues with normal stem cells |
| Entrez ID | Symbol | Replicates | Species | Organ | Tissue | Adj P-value | Log2FC | Malignancy |
| 23451 | SF3B1 | CA_HPV_1 | Human | Cervix | CC | 1.61e-07 | -5.45e-02 | 0.0264 |
| 23451 | SF3B1 | CA_HPV_3 | Human | Cervix | CC | 6.67e-03 | 1.60e-02 | 0.0414 |
| 23451 | SF3B1 | CCI_1 | Human | Cervix | CC | 1.18e-04 | -5.44e-01 | 0.528 |
| 23451 | SF3B1 | CCII_1 | Human | Cervix | CC | 5.28e-08 | -5.18e-01 | 0.3249 |
| 23451 | SF3B1 | L1 | Human | Cervix | CC | 2.44e-07 | -2.17e-01 | 0.0802 |
| 23451 | SF3B1 | T3 | Human | Cervix | CC | 1.36e-03 | -1.02e-01 | 0.1389 |
| 23451 | SF3B1 | HTA11_3410_2000001011 | Human | Colorectum | AD | 1.42e-19 | -6.67e-01 | 0.0155 |
| 23451 | SF3B1 | HTA11_2487_2000001011 | Human | Colorectum | SER | 3.45e-08 | -5.65e-01 | -0.1808 |
| 23451 | SF3B1 | HTA11_1938_2000001011 | Human | Colorectum | AD | 3.59e-04 | -4.40e-01 | -0.0811 |
| 23451 | SF3B1 | HTA11_3361_2000001011 | Human | Colorectum | AD | 2.45e-08 | -6.58e-01 | -0.1207 |
| 23451 | SF3B1 | HTA11_696_2000001011 | Human | Colorectum | AD | 8.98e-08 | -4.40e-01 | -0.1464 |
| 23451 | SF3B1 | HTA11_866_2000001011 | Human | Colorectum | AD | 9.54e-10 | -4.75e-01 | -0.1001 |
| 23451 | SF3B1 | HTA11_7862_2000001011 | Human | Colorectum | AD | 1.71e-02 | -6.01e-01 | -0.0179 |
| 23451 | SF3B1 | HTA11_866_3004761011 | Human | Colorectum | AD | 2.24e-08 | -5.03e-01 | 0.096 |
| 23451 | SF3B1 | HTA11_10623_2000001011 | Human | Colorectum | AD | 2.78e-02 | -5.73e-01 | -0.0177 |
| 23451 | SF3B1 | HTA11_10711_2000001011 | Human | Colorectum | AD | 1.72e-07 | -6.06e-01 | 0.0338 |
| 23451 | SF3B1 | HTA11_7696_3000711011 | Human | Colorectum | AD | 2.77e-13 | -5.05e-01 | 0.0674 |
| 23451 | SF3B1 | HTA11_99999971662_82457 | Human | Colorectum | MSS | 1.90e-03 | -3.39e-01 | 0.3859 |
| 23451 | SF3B1 | HTA11_99999973899_84307 | Human | Colorectum | MSS | 4.04e-04 | -5.67e-01 | 0.2585 |
| 23451 | SF3B1 | HTA11_99999974143_84620 | Human | Colorectum | MSS | 2.39e-10 | -4.69e-01 | 0.3005 |
| Page: 1 2 3 4 5 6 7 8 9 10 11 12 |
| Tissue | Expression Dynamics | Abbreviation |
| Cervix | 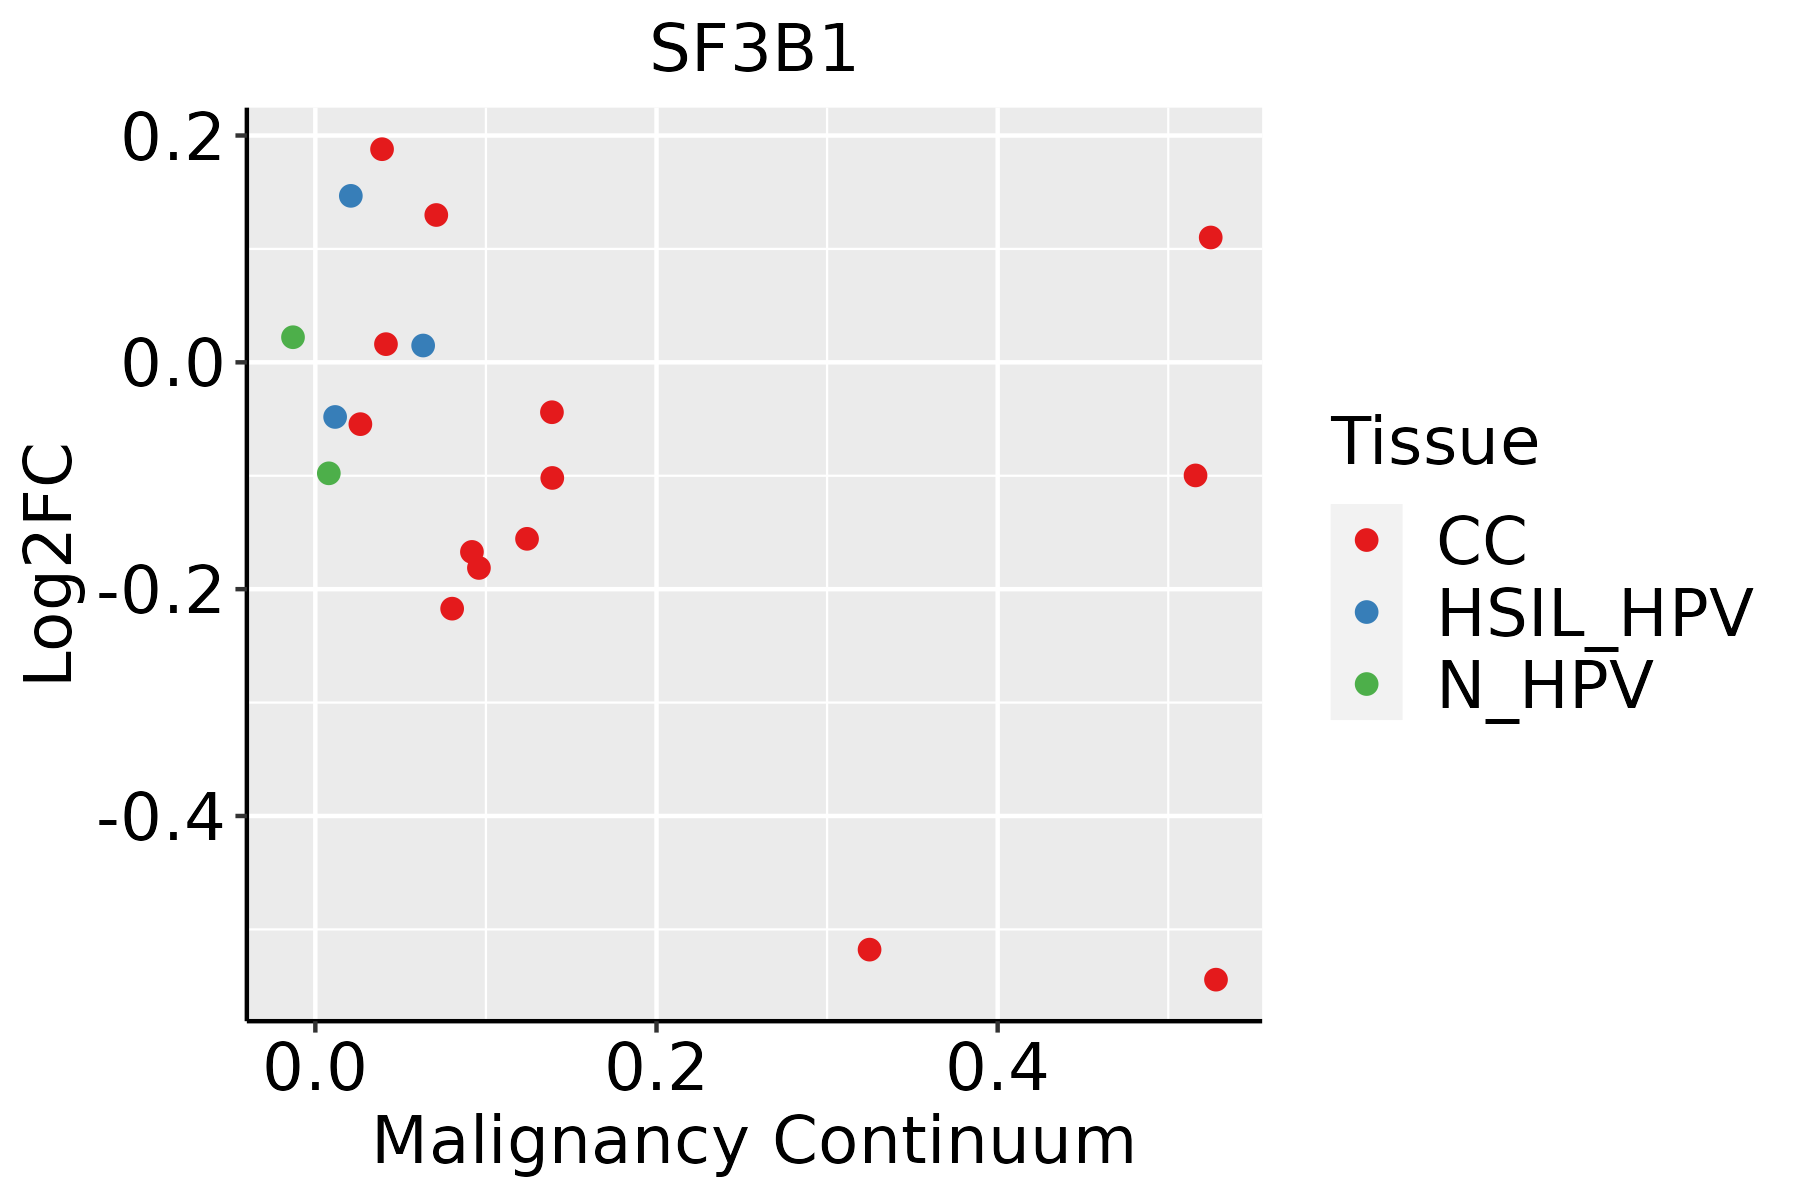 | CC: Cervix cancer |
| HSIL_HPV: HPV-infected high-grade squamous intraepithelial lesions | ||
| N_HPV: HPV-infected normal cervix | ||
| Colorectum (GSE201348) |  | FAP: Familial adenomatous polyposis |
| CRC: Colorectal cancer | ||
| Colorectum (HTA11) |  | AD: Adenomas |
| SER: Sessile serrated lesions | ||
| MSI-H: Microsatellite-high colorectal cancer | ||
| MSS: Microsatellite stable colorectal cancer | ||
| Endometrium |  | AEH: Atypical endometrial hyperplasia |
| EEC: Endometrioid Cancer | ||
| Esophagus |  | ESCC: Esophageal squamous cell carcinoma |
| HGIN: High-grade intraepithelial neoplasias | ||
| LGIN: Low-grade intraepithelial neoplasias | ||
| Liver |  | HCC: Hepatocellular carcinoma |
| NAFLD: Non-alcoholic fatty liver disease | ||
| Oral Cavity | 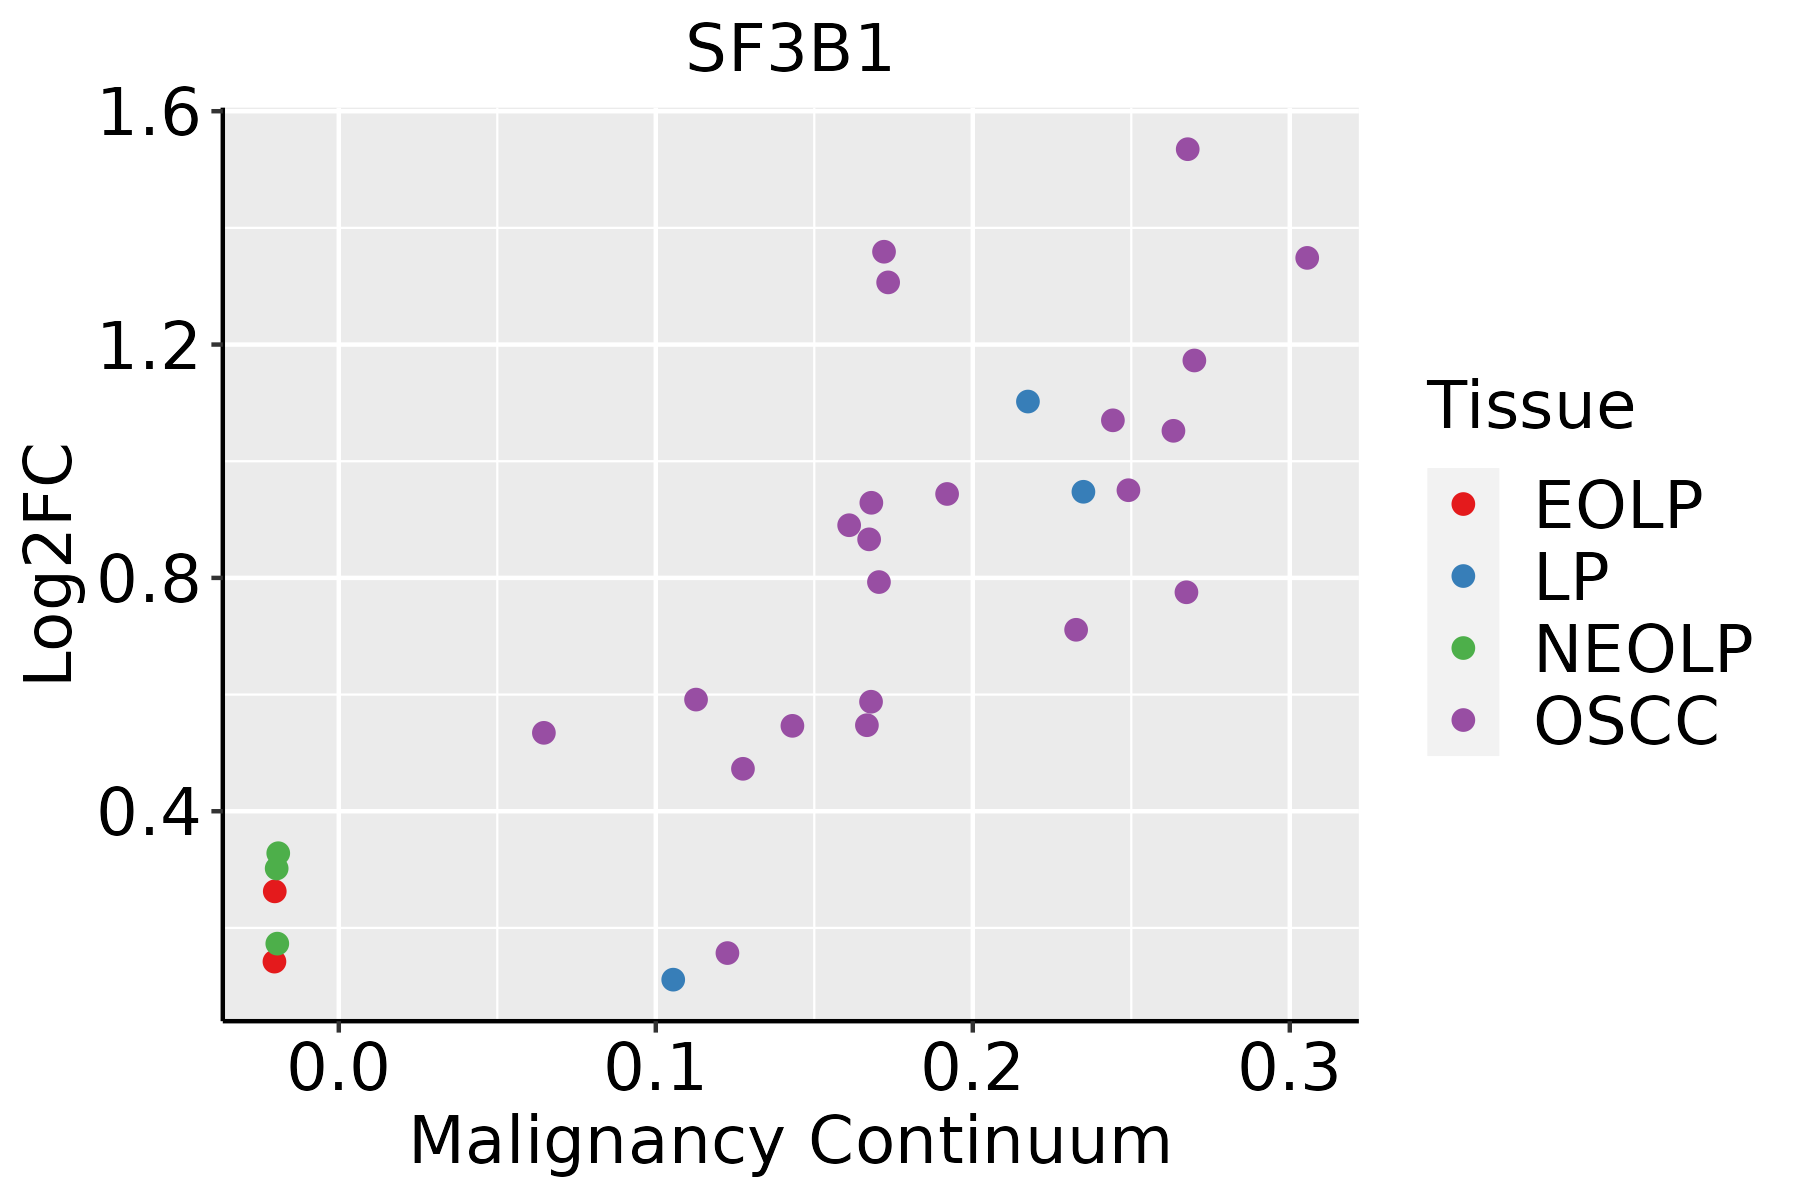 | EOLP: Erosive Oral lichen planus |
| LP: leukoplakia | ||
| NEOLP: Non-erosive oral lichen planus | ||
| OSCC: Oral squamous cell carcinoma | ||
| Prostate | 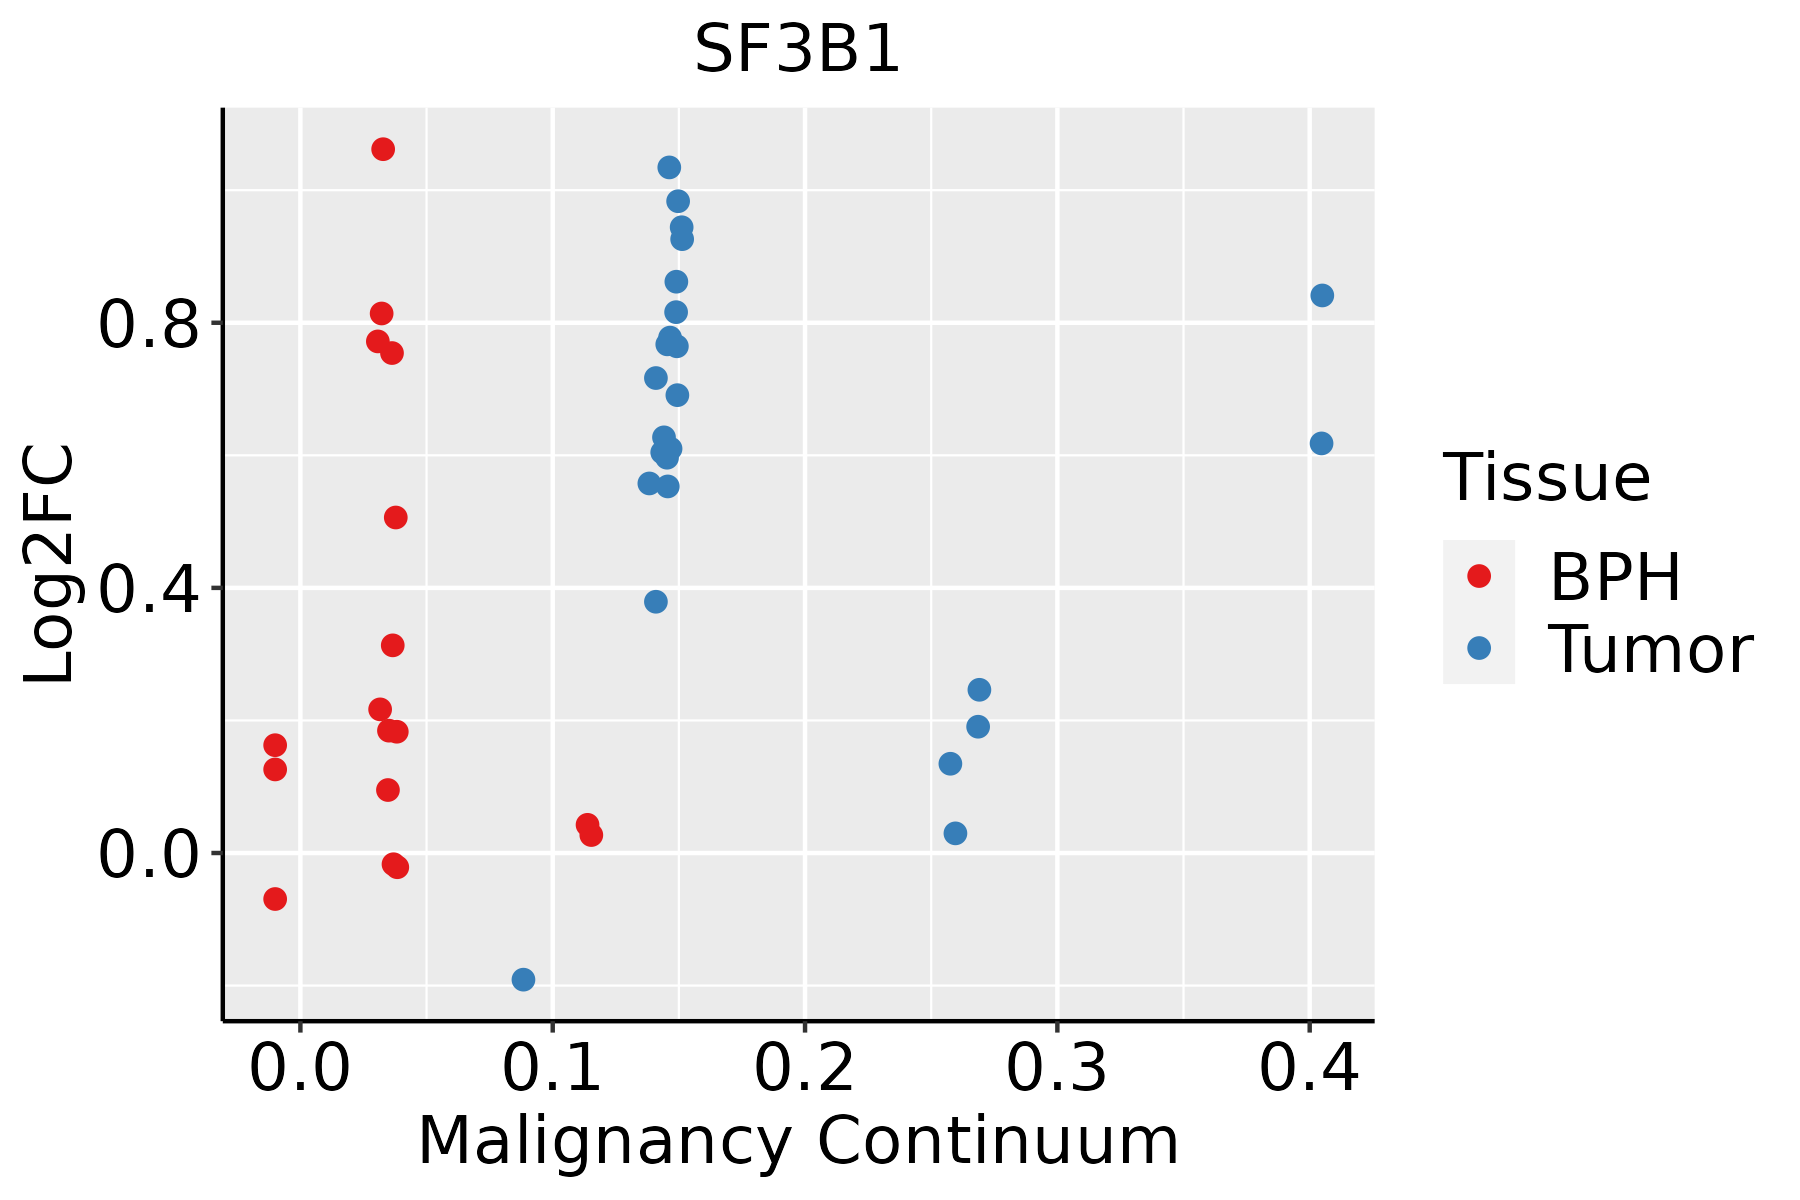 | BPH: Benign Prostatic Hyperplasia |
| Skin | 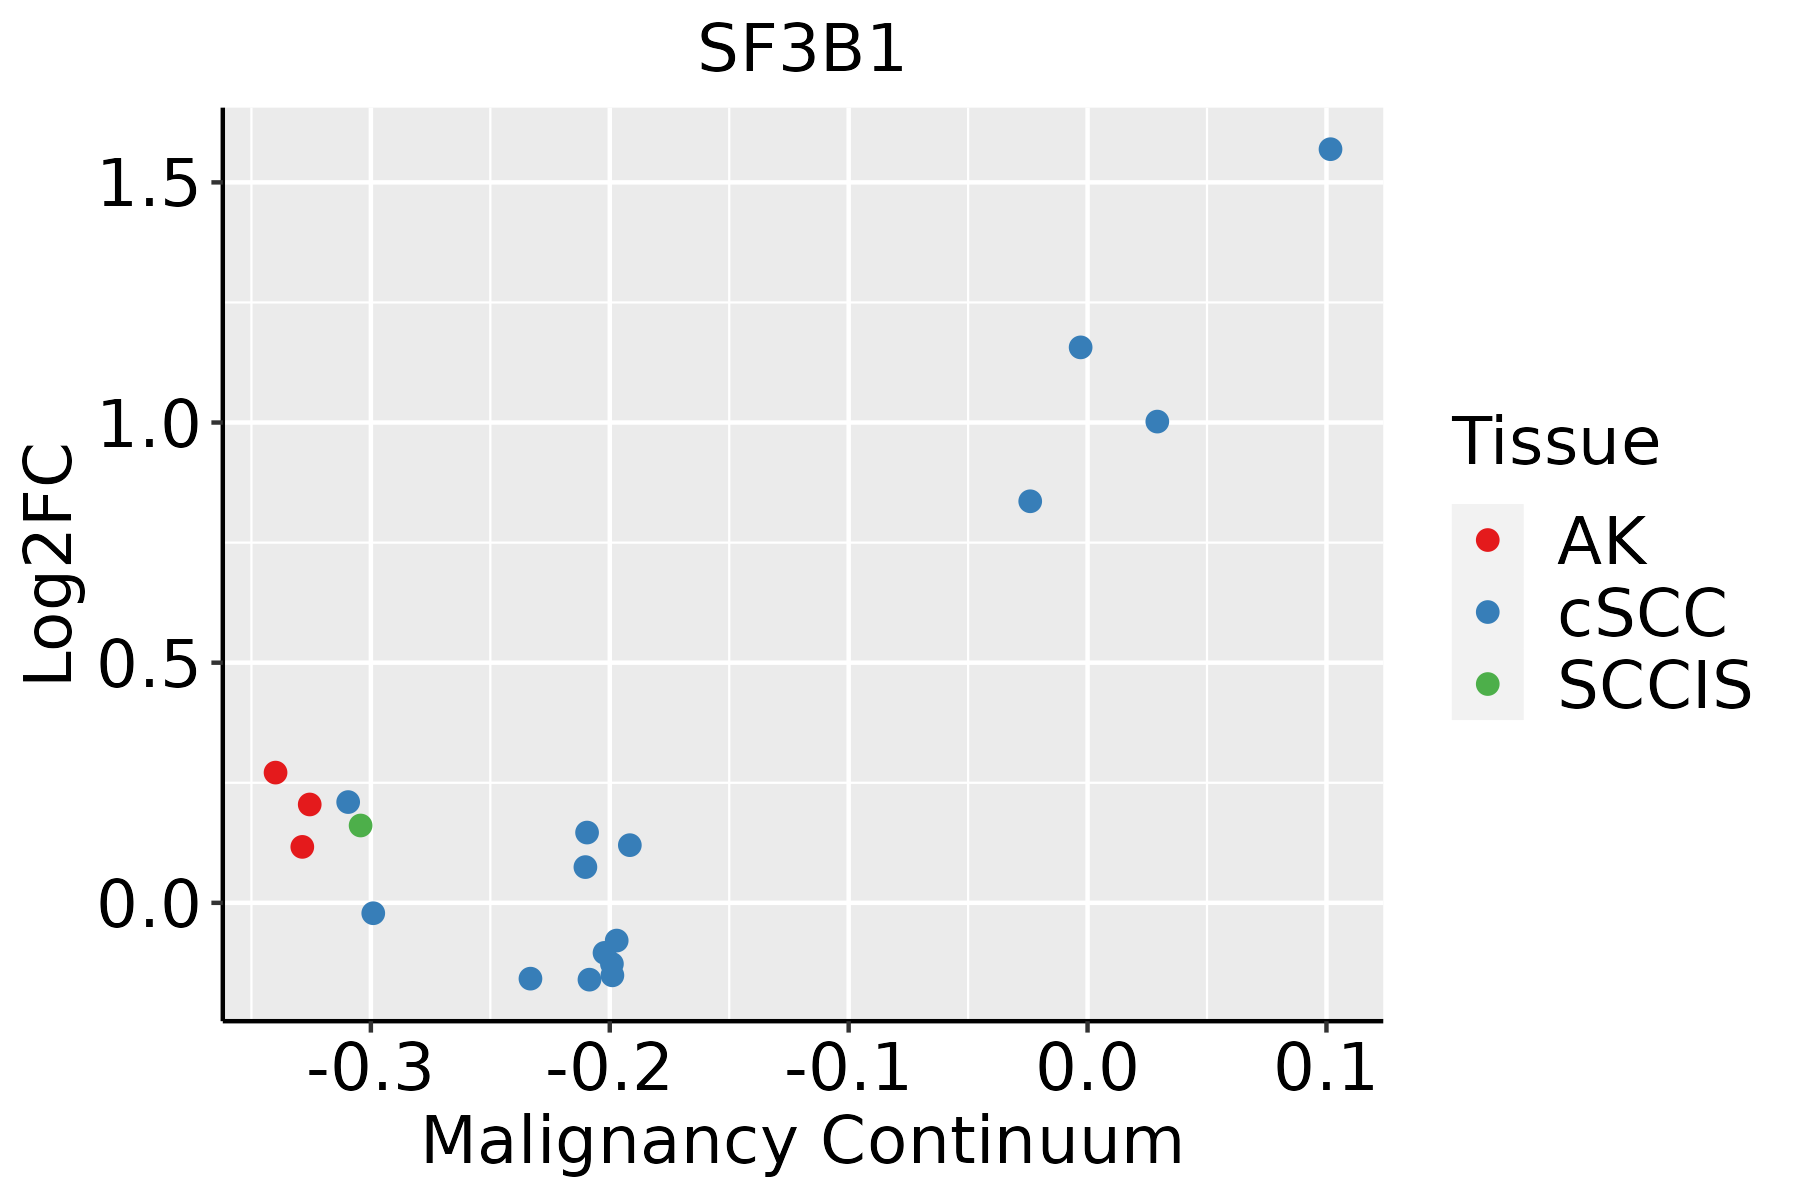 | AK: Actinic keratosis |
| cSCC: Cutaneous squamous cell carcinoma | ||
| SCCIS:squamous cell carcinoma in situ | ||
| Thyroid | 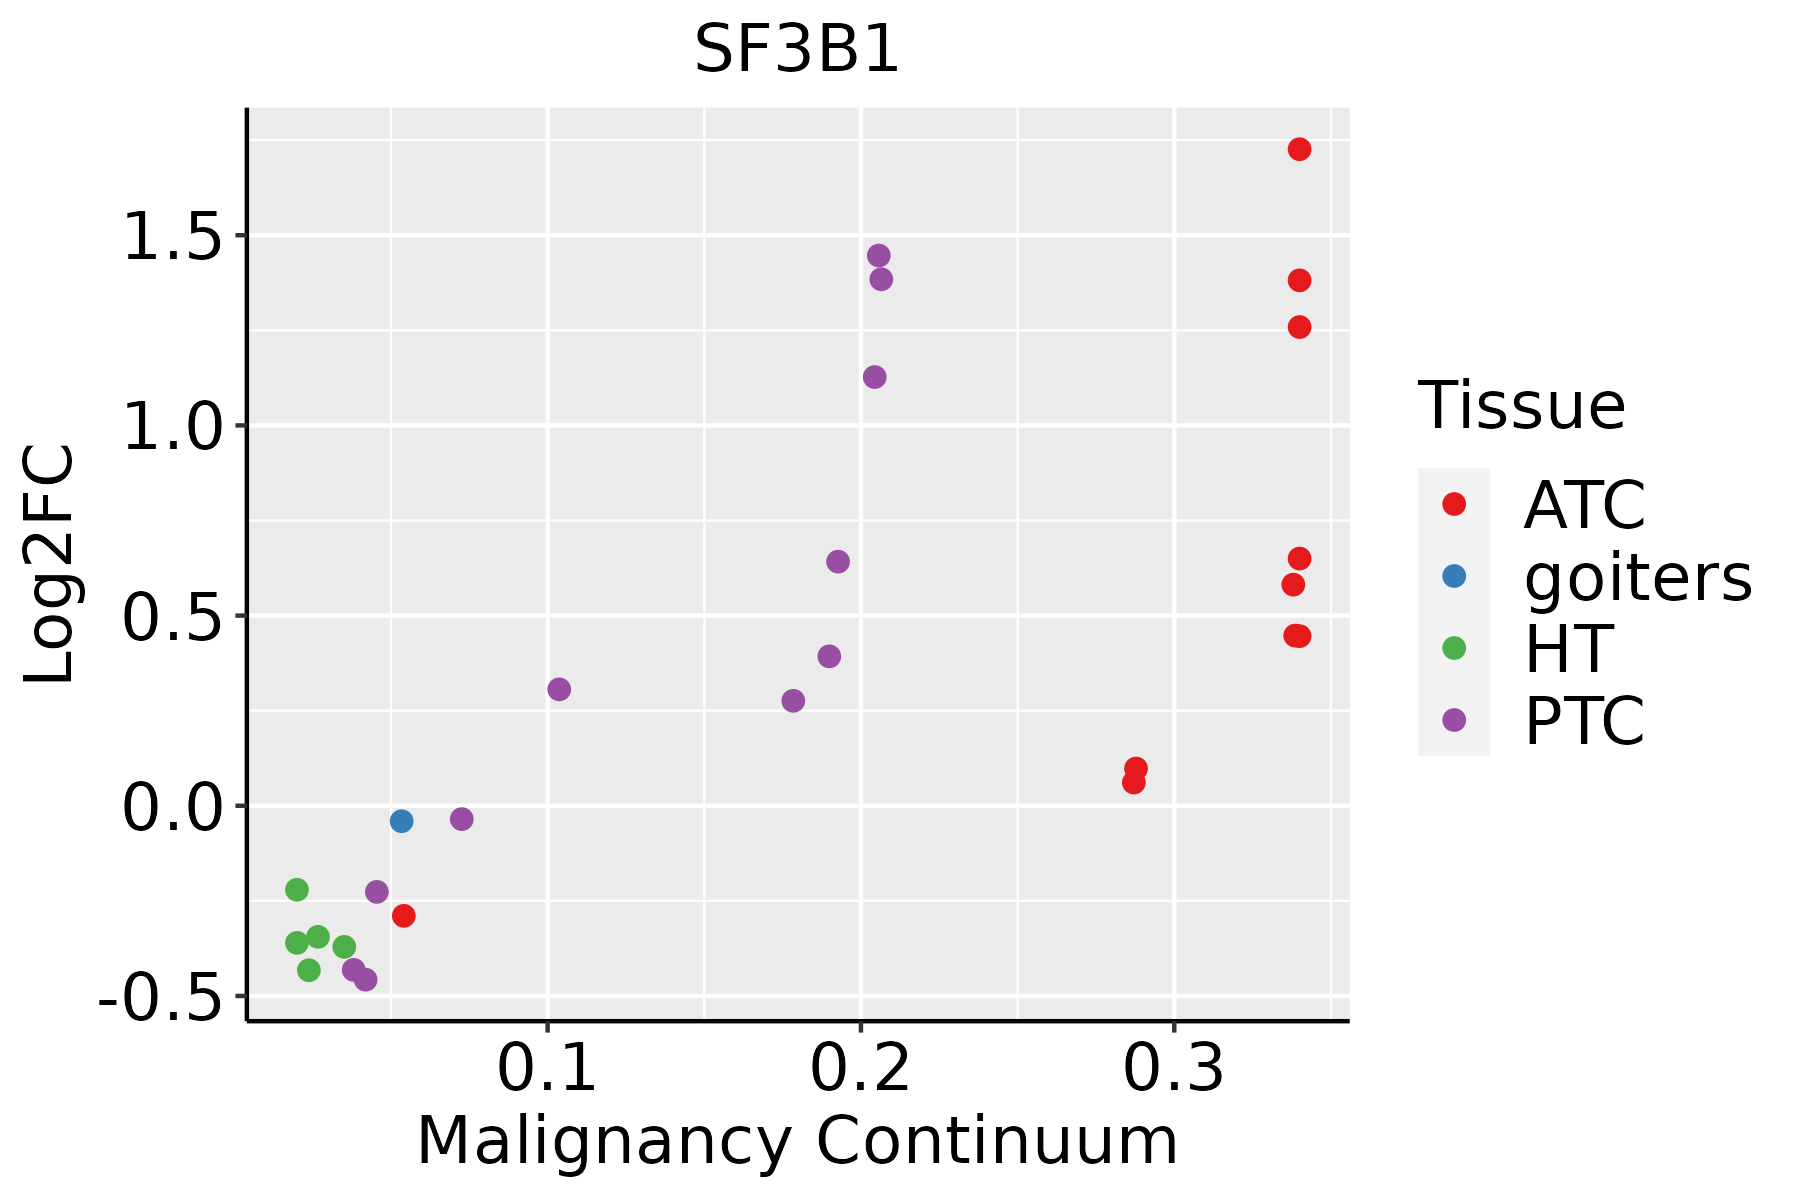 | ATC: Anaplastic thyroid cancer |
| HT: Hashimoto's thyroiditis | ||
| PTC: Papillary thyroid cancer |
| ∗log2FC in expression of this searched gene in stem-like cells from each diseased tissue sample relative to stem-like cells in normal samples in each tissue plotted against the malignancy continuum. Samples are colored based on if they are from different disease stage. |
Top |
Malignant transformation related pathway analysis |
| Find out the enriched GO biological processes and KEGG pathways involved in transition from healthy to precancer to cancer |
| Tissue | Disease Stage | Enriched GO biological Processes |
| Colorectum | AD |  |
| Colorectum | SER |  |
| Colorectum | MSS |  |
| Colorectum | MSI-H |  |
| Colorectum | FAP |  |
| ∗Top 15 enriched GO BP terms are showed in the bar plot of each disease state in each tissue. Each row represents a significant GO biological process which is colored according to the -log10(p.adjust). |
| Page: 1 2 3 4 5 6 7 8 9 |
| GO ID | Tissue | Disease Stage | Description | Gene Ratio | Bg Ratio | pvalue | p.adjust | Count |
| GO:002261310 | Cervix | CC | ribonucleoprotein complex biogenesis | 88/2311 | 463/18723 | 2.11e-05 | 3.82e-04 | 88 |
| GO:002261810 | Cervix | CC | ribonucleoprotein complex assembly | 49/2311 | 220/18723 | 2.52e-05 | 4.29e-04 | 49 |
| GO:007182610 | Cervix | CC | ribonucleoprotein complex subunit organization | 49/2311 | 227/18723 | 5.91e-05 | 8.54e-04 | 49 |
| GO:000838010 | Cervix | CC | RNA splicing | 76/2311 | 434/18723 | 9.79e-04 | 8.19e-03 | 76 |
| GO:000037710 | Cervix | CC | RNA splicing, via transesterification reactions with bulged adenosine as nucleophile | 55/2311 | 320/18723 | 6.71e-03 | 3.70e-02 | 55 |
| GO:000039810 | Cervix | CC | mRNA splicing, via spliceosome | 55/2311 | 320/18723 | 6.71e-03 | 3.70e-02 | 55 |
| GO:000037510 | Cervix | CC | RNA splicing, via transesterification reactions | 55/2311 | 324/18723 | 8.61e-03 | 4.44e-02 | 55 |
| GO:0008380 | Colorectum | AD | RNA splicing | 169/3918 | 434/18723 | 3.59e-18 | 2.04e-15 | 169 |
| GO:0000377 | Colorectum | AD | RNA splicing, via transesterification reactions with bulged adenosine as nucleophile | 130/3918 | 320/18723 | 5.88e-16 | 2.16e-13 | 130 |
| GO:0000398 | Colorectum | AD | mRNA splicing, via spliceosome | 130/3918 | 320/18723 | 5.88e-16 | 2.16e-13 | 130 |
| GO:0000375 | Colorectum | AD | RNA splicing, via transesterification reactions | 131/3918 | 324/18723 | 7.11e-16 | 2.22e-13 | 131 |
| GO:0022618 | Colorectum | AD | ribonucleoprotein complex assembly | 92/3918 | 220/18723 | 1.49e-12 | 2.60e-10 | 92 |
| GO:0071826 | Colorectum | AD | ribonucleoprotein complex subunit organization | 94/3918 | 227/18723 | 1.70e-12 | 2.87e-10 | 94 |
| GO:0022613 | Colorectum | AD | ribonucleoprotein complex biogenesis | 151/3918 | 463/18723 | 1.96e-09 | 1.39e-07 | 151 |
| GO:0000245 | Colorectum | AD | spliceosomal complex assembly | 33/3918 | 79/18723 | 2.15e-05 | 4.33e-04 | 33 |
| GO:00083801 | Colorectum | SER | RNA splicing | 123/2897 | 434/18723 | 3.84e-12 | 8.41e-10 | 123 |
| GO:00226181 | Colorectum | SER | ribonucleoprotein complex assembly | 69/2897 | 220/18723 | 2.25e-09 | 2.15e-07 | 69 |
| GO:00718261 | Colorectum | SER | ribonucleoprotein complex subunit organization | 70/2897 | 227/18723 | 3.83e-09 | 3.51e-07 | 70 |
| GO:00003751 | Colorectum | SER | RNA splicing, via transesterification reactions | 90/2897 | 324/18723 | 8.68e-09 | 7.50e-07 | 90 |
| GO:00003771 | Colorectum | SER | RNA splicing, via transesterification reactions with bulged adenosine as nucleophile | 89/2897 | 320/18723 | 9.82e-09 | 8.14e-07 | 89 |
| Page: 1 2 3 4 5 6 7 8 9 10 |
| Pathway ID | Tissue | Disease Stage | Description | Gene Ratio | Bg Ratio | pvalue | p.adjust | qvalue | Count |
| hsa03040 | Colorectum | AD | Spliceosome | 73/2092 | 217/8465 | 1.73e-03 | 9.68e-03 | 6.18e-03 | 73 |
| hsa030401 | Colorectum | AD | Spliceosome | 73/2092 | 217/8465 | 1.73e-03 | 9.68e-03 | 6.18e-03 | 73 |
| hsa030402 | Colorectum | MSS | Spliceosome | 66/1875 | 217/8465 | 2.58e-03 | 1.27e-02 | 7.81e-03 | 66 |
| hsa030403 | Colorectum | MSS | Spliceosome | 66/1875 | 217/8465 | 2.58e-03 | 1.27e-02 | 7.81e-03 | 66 |
| hsa030409 | Endometrium | AEH | Spliceosome | 54/1197 | 217/8465 | 1.47e-05 | 1.65e-04 | 1.21e-04 | 54 |
| hsa0304014 | Endometrium | AEH | Spliceosome | 54/1197 | 217/8465 | 1.47e-05 | 1.65e-04 | 1.21e-04 | 54 |
| hsa0304024 | Endometrium | EEC | Spliceosome | 54/1237 | 217/8465 | 3.78e-05 | 3.88e-04 | 2.89e-04 | 54 |
| hsa0304034 | Endometrium | EEC | Spliceosome | 54/1237 | 217/8465 | 3.78e-05 | 3.88e-04 | 2.89e-04 | 54 |
| hsa0304018 | Esophagus | HGIN | Spliceosome | 79/1383 | 217/8465 | 3.22e-13 | 7.00e-12 | 5.56e-12 | 79 |
| hsa0304019 | Esophagus | HGIN | Spliceosome | 79/1383 | 217/8465 | 3.22e-13 | 7.00e-12 | 5.56e-12 | 79 |
| hsa0304027 | Esophagus | ESCC | Spliceosome | 128/4205 | 217/8465 | 3.31e-03 | 8.79e-03 | 4.50e-03 | 128 |
| hsa0304037 | Esophagus | ESCC | Spliceosome | 128/4205 | 217/8465 | 3.31e-03 | 8.79e-03 | 4.50e-03 | 128 |
| hsa030407 | Liver | Cirrhotic | Spliceosome | 102/2530 | 217/8465 | 5.69e-08 | 9.47e-07 | 5.84e-07 | 102 |
| hsa0304012 | Liver | Cirrhotic | Spliceosome | 102/2530 | 217/8465 | 5.69e-08 | 9.47e-07 | 5.84e-07 | 102 |
| hsa0304022 | Liver | HCC | Spliceosome | 122/4020 | 217/8465 | 5.55e-03 | 1.60e-02 | 8.91e-03 | 122 |
| hsa0304032 | Liver | HCC | Spliceosome | 122/4020 | 217/8465 | 5.55e-03 | 1.60e-02 | 8.91e-03 | 122 |
| hsa0304016 | Oral cavity | OSCC | Spliceosome | 123/3704 | 217/8465 | 7.21e-05 | 2.74e-04 | 1.40e-04 | 123 |
| hsa0304017 | Oral cavity | OSCC | Spliceosome | 123/3704 | 217/8465 | 7.21e-05 | 2.74e-04 | 1.40e-04 | 123 |
| hsa0304026 | Oral cavity | LP | Spliceosome | 106/2418 | 217/8465 | 1.30e-10 | 2.40e-09 | 1.55e-09 | 106 |
| hsa0304036 | Oral cavity | LP | Spliceosome | 106/2418 | 217/8465 | 1.30e-10 | 2.40e-09 | 1.55e-09 | 106 |
| Page: 1 2 |
Top |
Cell-cell communication analysis |
| Identification of potential cell-cell interactions between two cell types and their ligand-receptor pairs for different disease states |
| Ligand | Receptor | LRpair | Pathway | Tissue | Disease Stage |
| Page: 1 |
Top |
Single-cell gene regulatory network inference analysis |
| Find out the significant the regulons (TFs) and the target genes of each regulon across cell types for different disease states |
| TF | Cell Type | Tissue | Disease Stage | Target Gene | RSS | Regulon Activity |
| SF3B1 | M1MAC | Skin | Healthy | PTPRC,ATRX,RAB3GAP1, etc. | 1.08e-02 |  |
| SF3B1 | BN | Skin | Healthy | PTPRC,ATRX,RAB3GAP1, etc. | 8.47e-03 | |
| ∗The dot plots of a searched regulon are shown for all cell subpopulations in each disease state of each tissue based on the regulon specific score inferred using pySCENIC and by calculating the average expression. |
| Page: 1 |
Top |
Somatic mutation of malignant transformation related genes |
| Annotation of somatic variants for genes involved in malignant transformation |
| Hugo Symbol | Variant Class | Variant Classification | dbSNP RS | HGVSc | HGVSp | HGVSp Short | SWISSPROT | BIOTYPE | SIFT | PolyPhen | Tumor Sample Barcode | Tissue | Histology | Sex | Age | Stage | Therapy Types | Drugs | Outcome |
| SF3B1 | SNV | Missense_Mutation | c.1390N>T | p.Leu464Phe | p.L464F | O75533 | protein_coding | deleterious(0) | probably_damaging(0.973) | TCGA-AC-A23H-01 | Breast | breast invasive carcinoma | Female | >=65 | I/II | Unknown | Unknown | PD | |
| SF3B1 | SNV | Missense_Mutation | c.1864N>C | p.Glu622Gln | p.E622Q | O75533 | protein_coding | deleterious(0) | probably_damaging(0.992) | TCGA-AC-A2B8-01 | Breast | breast invasive carcinoma | Female | >=65 | I/II | Chemotherapy | chemo | PD | |
| SF3B1 | SNV | Missense_Mutation | novel | c.2836A>C | p.Lys946Gln | p.K946Q | O75533 | protein_coding | deleterious(0.03) | possibly_damaging(0.615) | TCGA-AO-A0J7-01 | Breast | breast invasive carcinoma | Female | >=65 | I/II | Chemotherapy | doxorubicin | SD |
| SF3B1 | SNV | Missense_Mutation | c.2404N>C | p.Glu802Gln | p.E802Q | O75533 | protein_coding | tolerated(0.22) | benign(0.285) | TCGA-AO-A0JC-01 | Breast | breast invasive carcinoma | Female | <65 | I/II | Chemotherapy | fluorouracil | SD | |
| SF3B1 | SNV | Missense_Mutation | c.1898N>T | p.Ala633Val | p.A633V | O75533 | protein_coding | deleterious(0) | probably_damaging(0.91) | TCGA-B6-A0I2-01 | Breast | breast invasive carcinoma | Female | <65 | I/II | Unknown | Unknown | SD | |
| SF3B1 | SNV | Missense_Mutation | c.1996N>G | p.Lys666Glu | p.K666E | O75533 | protein_coding | deleterious(0) | probably_damaging(0.983) | TCGA-BH-A0HP-01 | Breast | breast invasive carcinoma | Female | >=65 | III/IV | Chemotherapy | doxorubicin | SD | |
| SF3B1 | SNV | Missense_Mutation | c.2294N>G | p.Tyr765Cys | p.Y765C | O75533 | protein_coding | deleterious(0) | probably_damaging(0.997) | TCGA-BH-A0HY-01 | Breast | breast invasive carcinoma | Female | <65 | I/II | Hormone Therapy | taxotere | CR | |
| SF3B1 | SNV | Missense_Mutation | rs377023736 | c.1998G>C | p.Lys666Asn | p.K666N | O75533 | protein_coding | deleterious(0) | probably_damaging(0.992) | TCGA-LD-A74U-01 | Breast | breast invasive carcinoma | Female | >=65 | III/IV | Chemotherapy | taxotere | SD |
| SF3B1 | insertion | Nonsense_Mutation | novel | c.1921_1922insATAAGTAGTATATTTAGAGTATTTGGTTTTCATGATG | p.Ile641AsnfsTer3 | p.I641Nfs*3 | O75533 | protein_coding | TCGA-A2-A0D1-01 | Breast | breast invasive carcinoma | Female | >=65 | I/II | Chemotherapy | taxotere | SD | ||
| SF3B1 | insertion | Frame_Shift_Ins | novel | c.1404_1405insGTTATTGATAGGATACTGTACAAACTTGATG | p.Pro469ValfsTer12 | p.P469Vfs*12 | O75533 | protein_coding | TCGA-AN-A03X-01 | Breast | breast invasive carcinoma | Female | >=65 | I/II | Unknown | Unknown | SD |
| Page: 1 2 3 4 5 6 7 8 9 10 11 12 13 14 15 16 |
Top |
Related drugs of malignant transformation related genes |
| Identification of chemicals and drugs interact with genes involved in malignant transfromation |
| (DGIdb 4.0) |
| Entrez ID | Symbol | Category | Interaction Types | Drug Claim Name | Drug Name | PMIDs |
| 23451 | SF3B1 | CLINICALLY ACTIONABLE | N/A | 24220272,21998214,22096241 | ||
| 23451 | SF3B1 | CLINICALLY ACTIONABLE | Spliceostatin A | 25424858 | ||
| 23451 | SF3B1 | CLINICALLY ACTIONABLE | E7107 | E7107 | 27622333 | |
| 23451 | SF3B1 | CLINICALLY ACTIONABLE | H3B-8800 |
| Page: 1 |

Copyright 2023-Present -The University of Texas Health Science Center at Houston |