
|
|||||
|
 | |
| |
| |
| |
| |
| |
|
Gene: SF3A3 |
Gene summary for SF3A3 |
| Gene information | Species | Human | Gene symbol | SF3A3 | Gene ID | 10946 |
| Gene name | splicing factor 3a subunit 3 | |
| Gene Alias | PRP9 | |
| Cytomap | 1p34.3 | |
| Gene Type | protein-coding | GO ID | GO:0000245 | UniProtAcc | B4DW90 |
Top |
Malignant transformation analysis |
| Identification of the aberrant gene expression in precancerous and cancerous lesions by comparing the gene expression of stem-like cells in diseased tissues with normal stem cells |
| Entrez ID | Symbol | Replicates | Species | Organ | Tissue | Adj P-value | Log2FC | Malignancy |
| 10946 | SF3A3 | LZE4T | Human | Esophagus | ESCC | 1.63e-13 | 2.53e-01 | 0.0811 |
| 10946 | SF3A3 | LZE7T | Human | Esophagus | ESCC | 5.08e-08 | 6.23e-01 | 0.0667 |
| 10946 | SF3A3 | LZE8T | Human | Esophagus | ESCC | 5.08e-08 | 1.70e-01 | 0.067 |
| 10946 | SF3A3 | LZE22D1 | Human | Esophagus | HGIN | 2.98e-04 | -5.51e-03 | 0.0595 |
| 10946 | SF3A3 | LZE22T | Human | Esophagus | ESCC | 2.78e-07 | 3.27e-01 | 0.068 |
| 10946 | SF3A3 | LZE24D1 | Human | Esophagus | HGIN | 7.05e-03 | 2.98e-01 | 0.054 |
| 10946 | SF3A3 | LZE24T | Human | Esophagus | ESCC | 1.28e-18 | 4.67e-01 | 0.0596 |
| 10946 | SF3A3 | LZE21T | Human | Esophagus | ESCC | 1.32e-04 | 2.62e-01 | 0.0655 |
| 10946 | SF3A3 | LZE6T | Human | Esophagus | ESCC | 6.49e-05 | 2.09e-01 | 0.0845 |
| 10946 | SF3A3 | P1T-E | Human | Esophagus | ESCC | 2.63e-04 | 2.92e-01 | 0.0875 |
| 10946 | SF3A3 | P2T-E | Human | Esophagus | ESCC | 2.03e-53 | 9.42e-01 | 0.1177 |
| 10946 | SF3A3 | P4T-E | Human | Esophagus | ESCC | 3.26e-29 | 7.47e-01 | 0.1323 |
| 10946 | SF3A3 | P5T-E | Human | Esophagus | ESCC | 3.38e-20 | 5.99e-01 | 0.1327 |
| 10946 | SF3A3 | P8T-E | Human | Esophagus | ESCC | 2.82e-25 | 4.86e-01 | 0.0889 |
| 10946 | SF3A3 | P9T-E | Human | Esophagus | ESCC | 9.21e-15 | 3.13e-01 | 0.1131 |
| 10946 | SF3A3 | P10T-E | Human | Esophagus | ESCC | 2.37e-42 | 8.78e-01 | 0.116 |
| 10946 | SF3A3 | P11T-E | Human | Esophagus | ESCC | 5.82e-24 | 7.87e-01 | 0.1426 |
| 10946 | SF3A3 | P12T-E | Human | Esophagus | ESCC | 5.48e-25 | 5.54e-01 | 0.1122 |
| 10946 | SF3A3 | P15T-E | Human | Esophagus | ESCC | 2.37e-26 | 6.99e-01 | 0.1149 |
| 10946 | SF3A3 | P16T-E | Human | Esophagus | ESCC | 3.45e-32 | 5.32e-01 | 0.1153 |
| Page: 1 2 3 4 5 6 |
| Tissue | Expression Dynamics | Abbreviation |
| Esophagus | 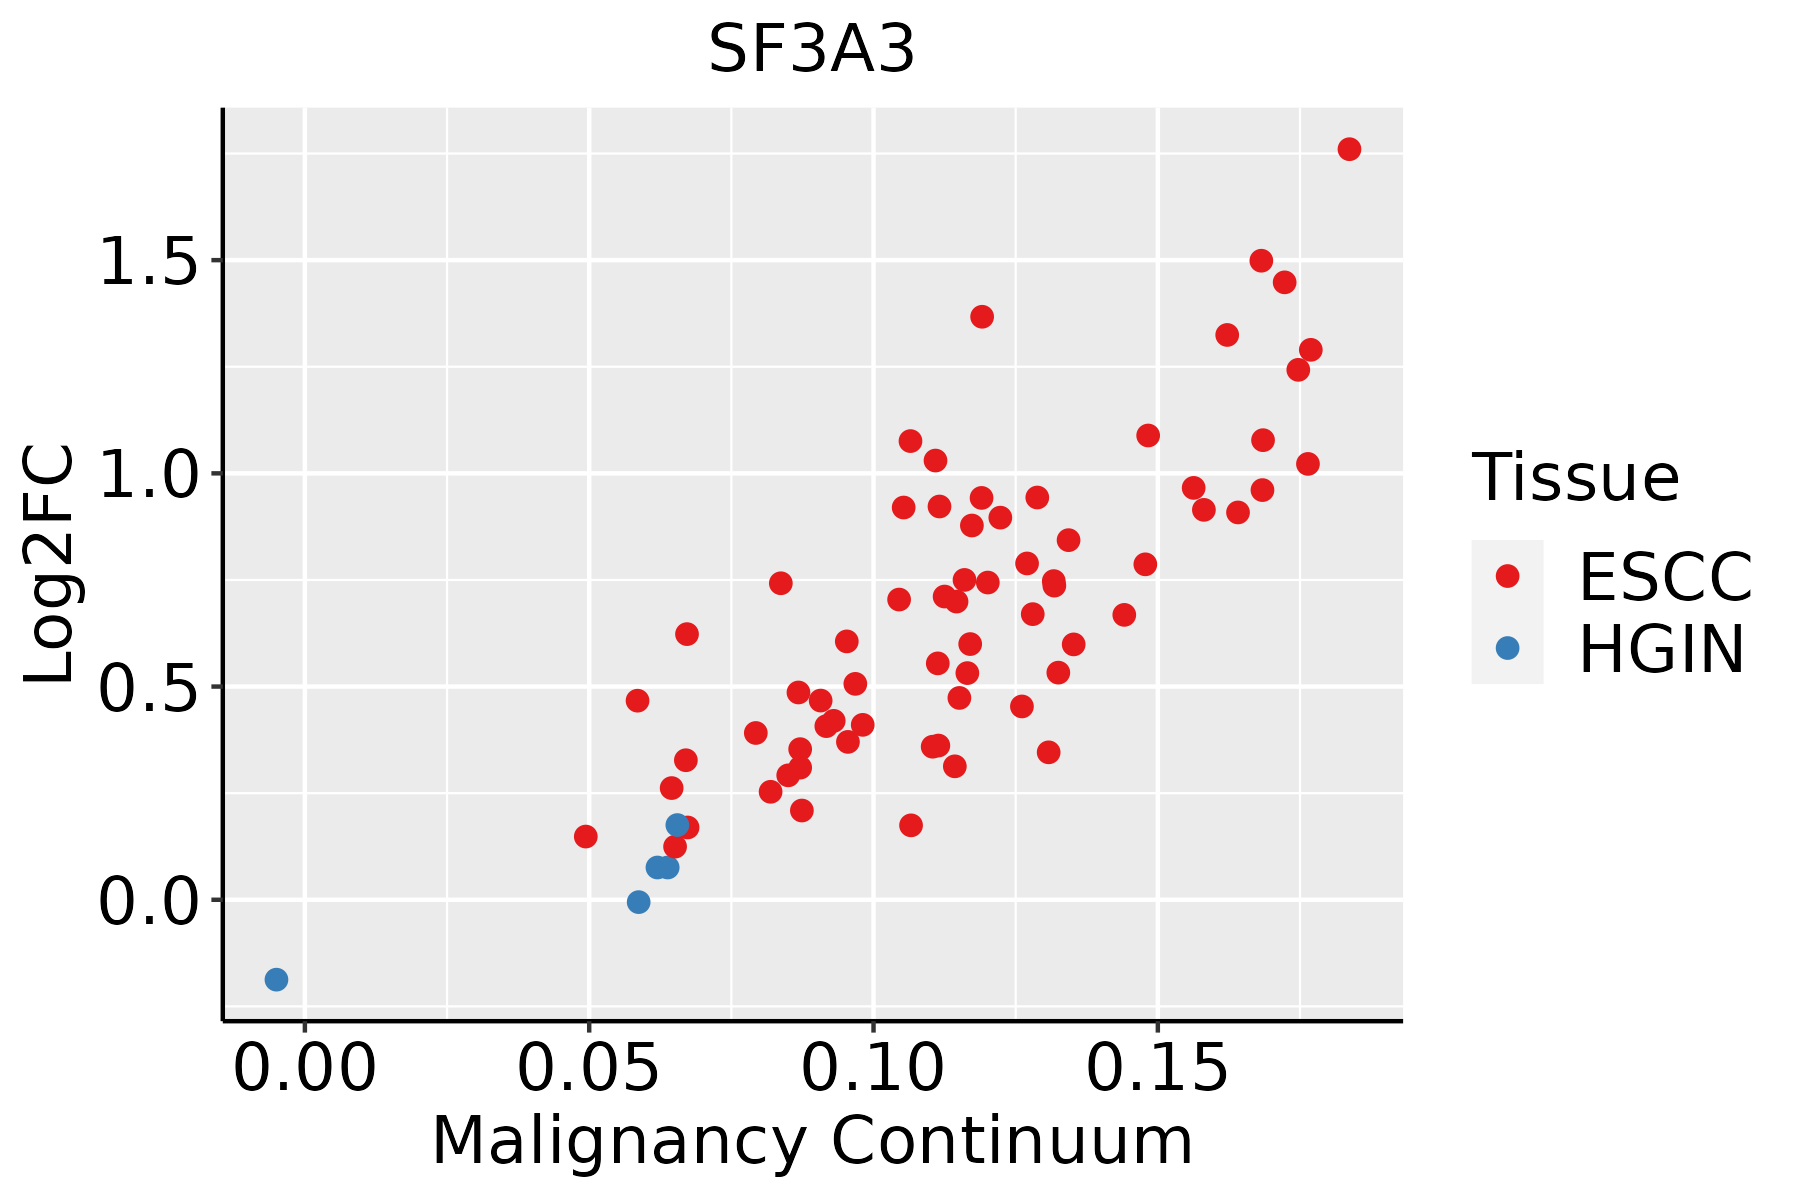 | ESCC: Esophageal squamous cell carcinoma |
| HGIN: High-grade intraepithelial neoplasias | ||
| LGIN: Low-grade intraepithelial neoplasias | ||
| Liver | 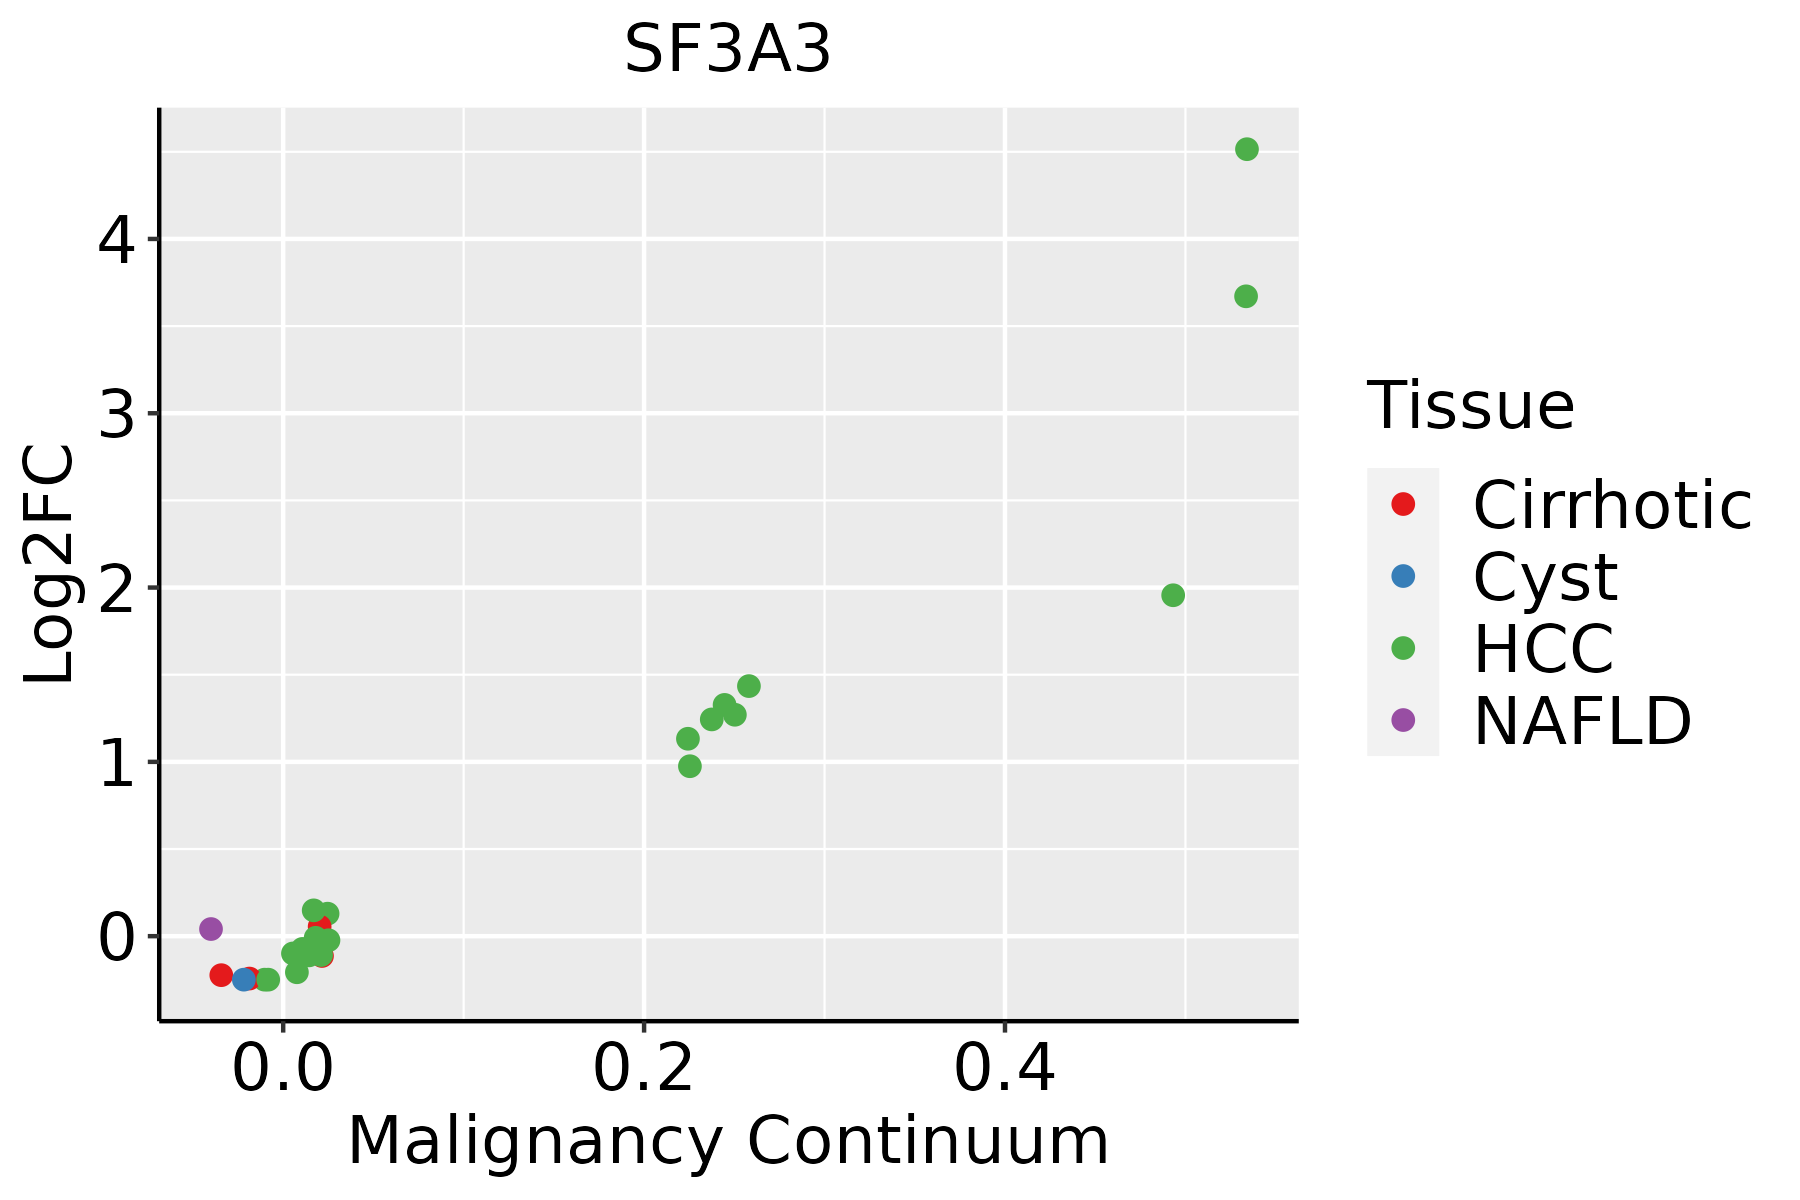 | HCC: Hepatocellular carcinoma |
| NAFLD: Non-alcoholic fatty liver disease | ||
| Oral Cavity | 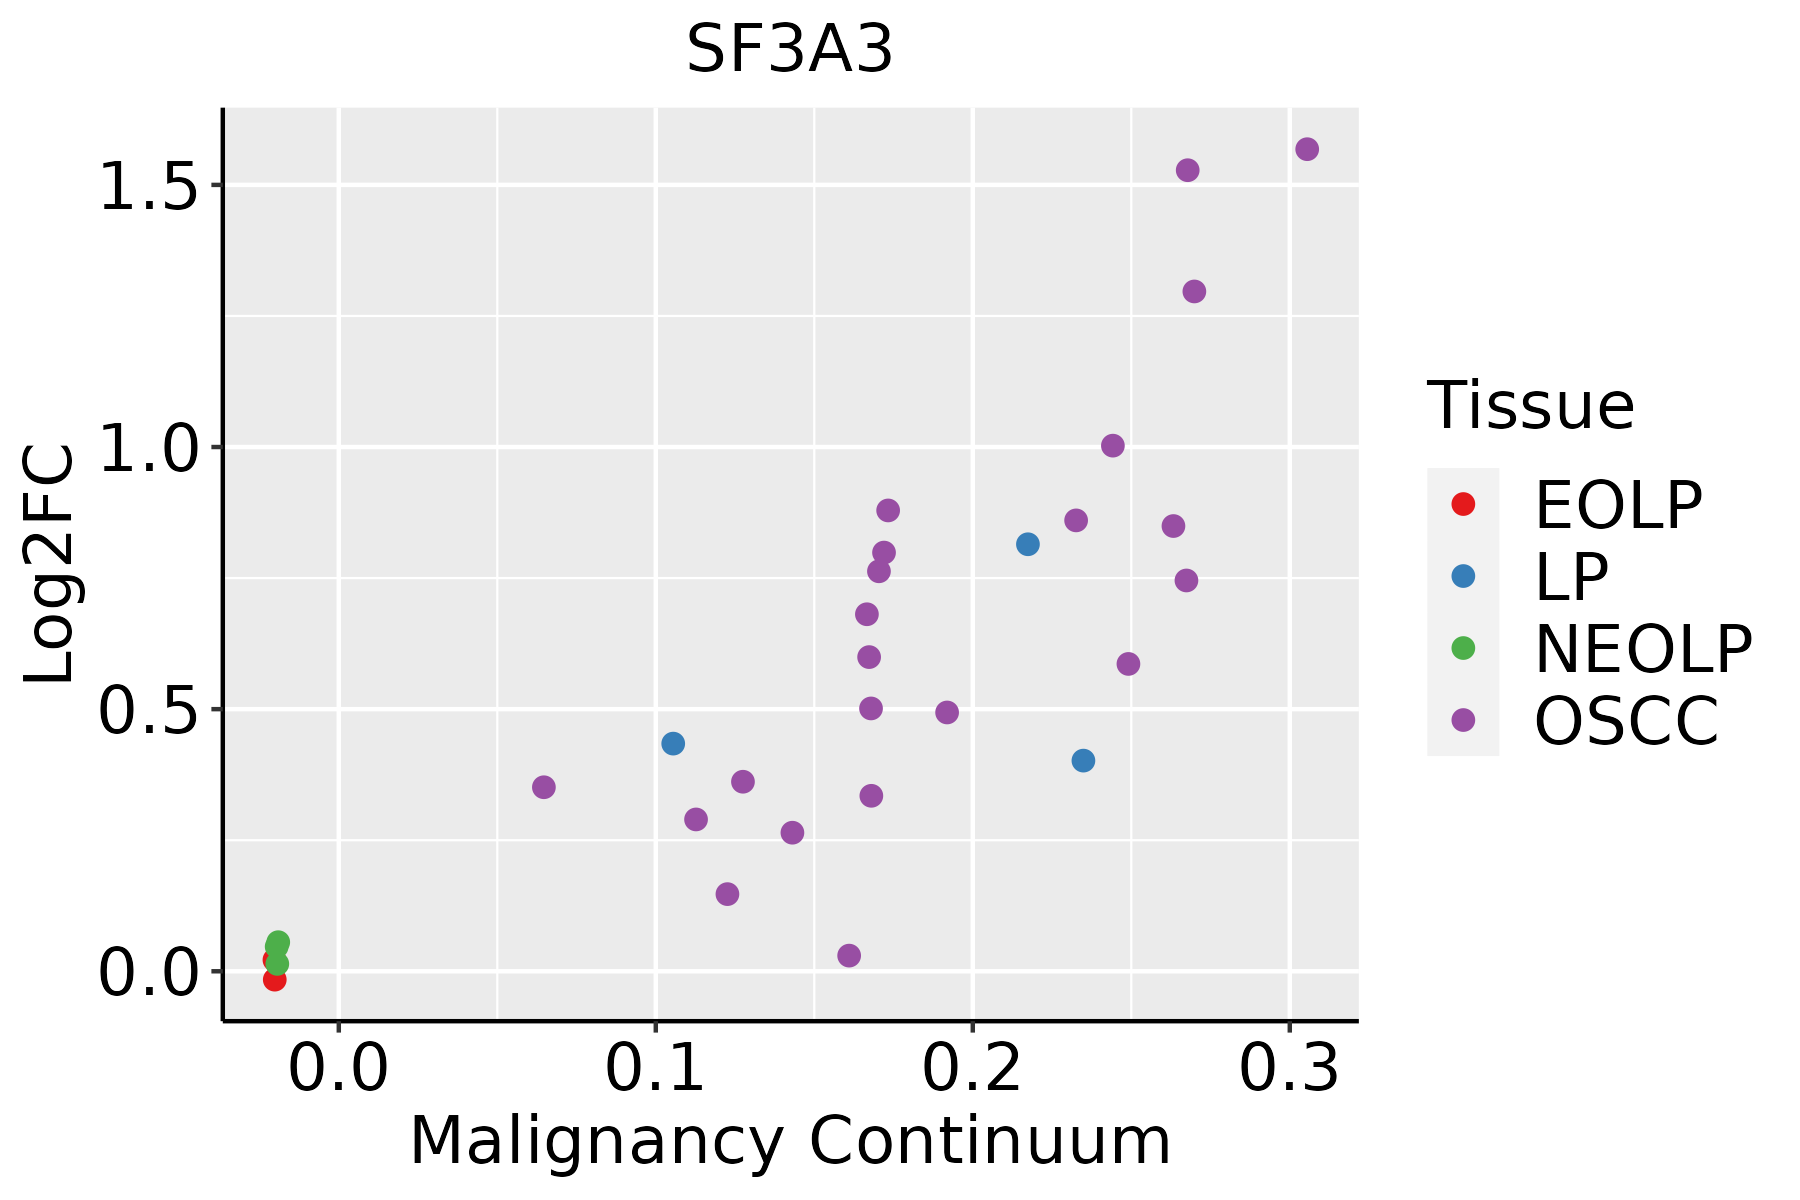 | EOLP: Erosive Oral lichen planus |
| LP: leukoplakia | ||
| NEOLP: Non-erosive oral lichen planus | ||
| OSCC: Oral squamous cell carcinoma | ||
| Skin | 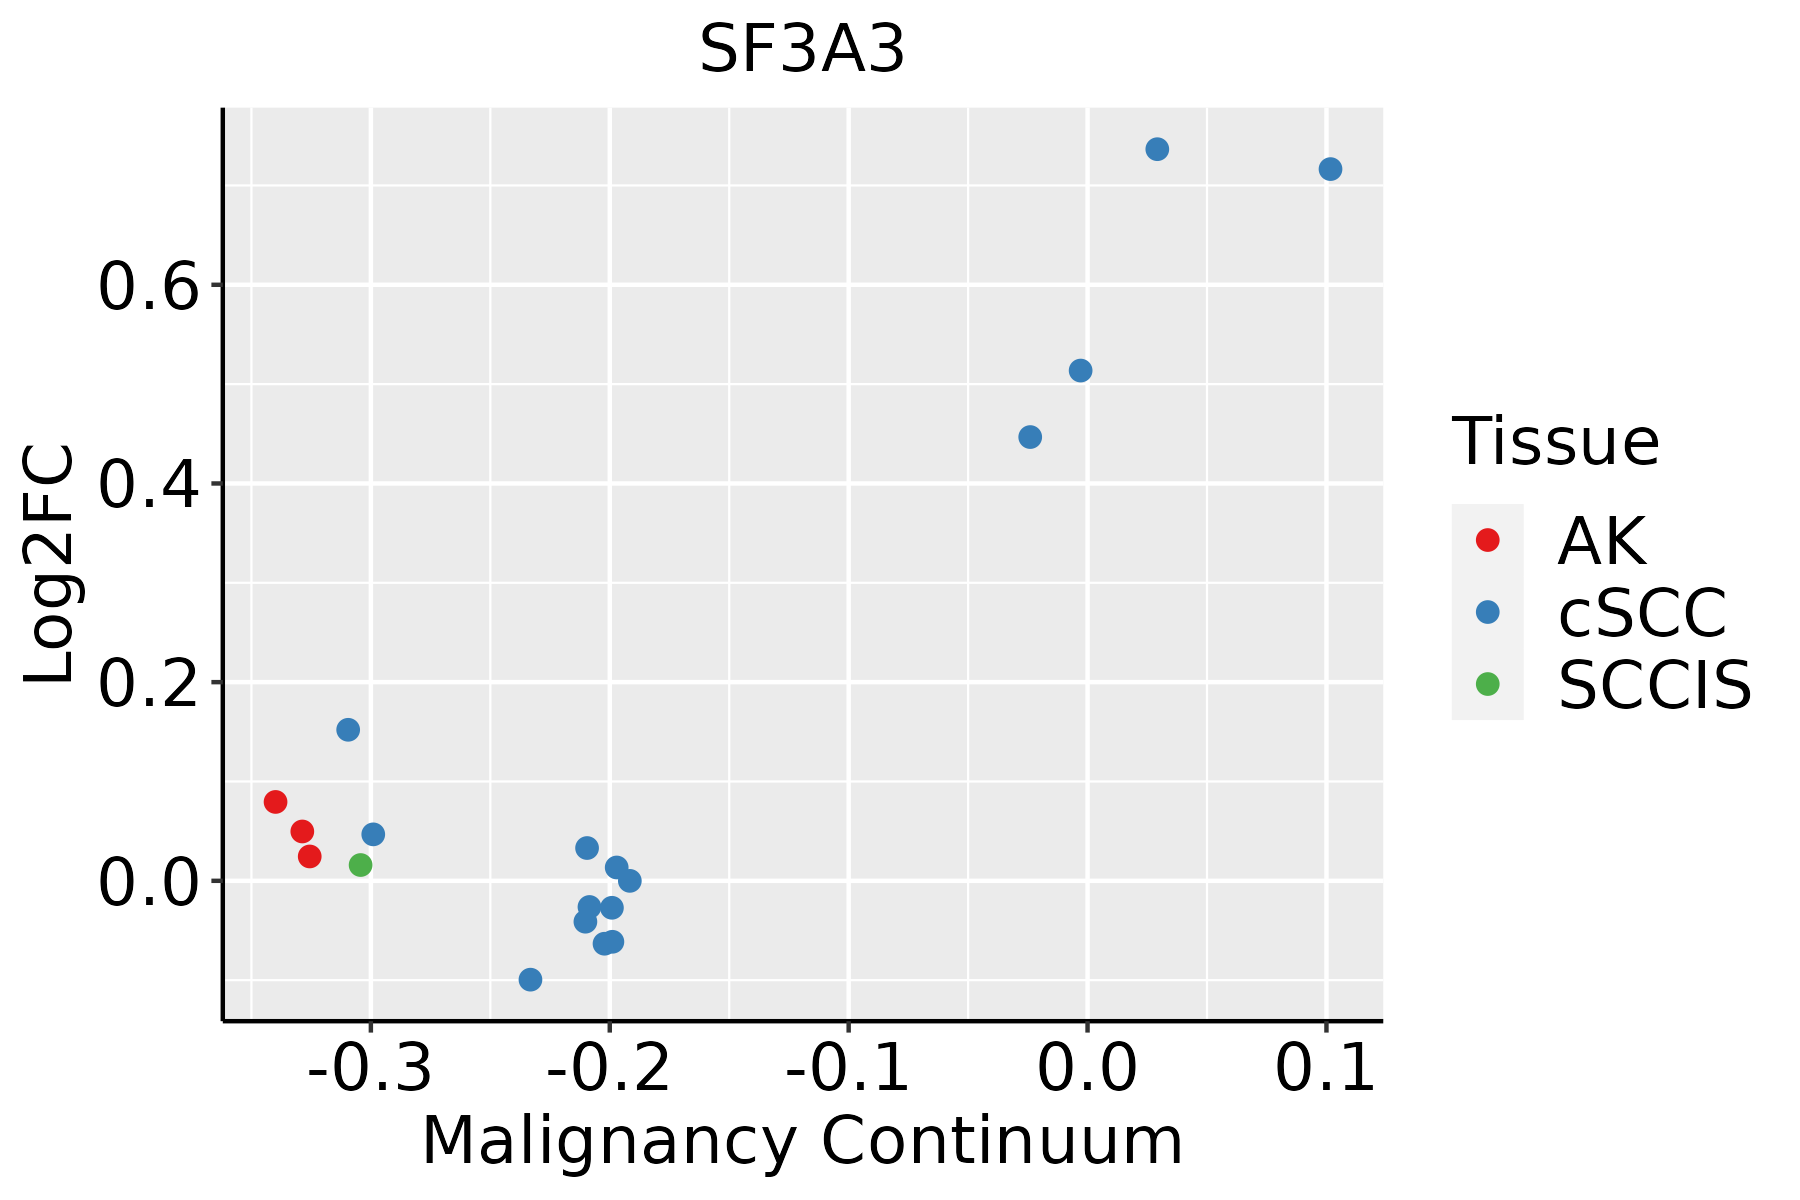 | AK: Actinic keratosis |
| cSCC: Cutaneous squamous cell carcinoma | ||
| SCCIS:squamous cell carcinoma in situ | ||
| Thyroid | 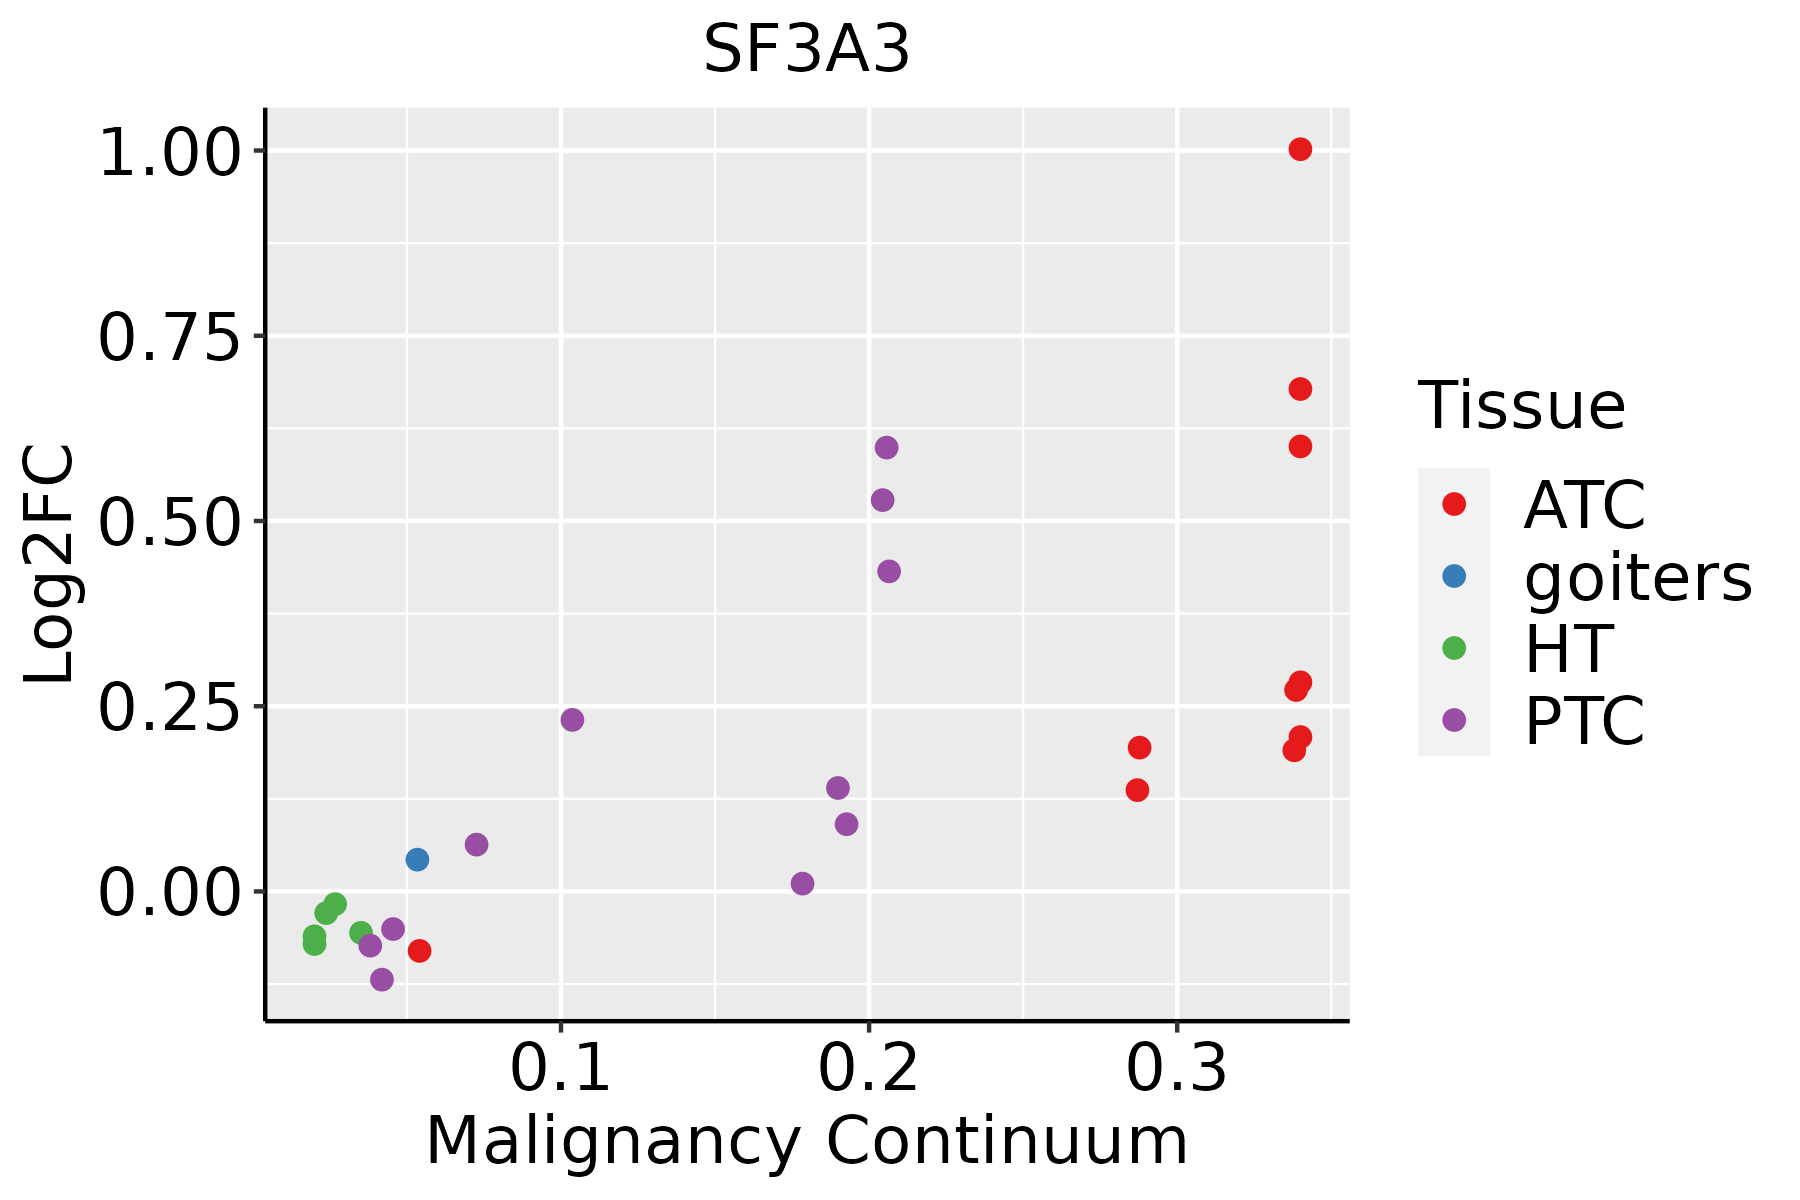 | ATC: Anaplastic thyroid cancer |
| HT: Hashimoto's thyroiditis | ||
| PTC: Papillary thyroid cancer |
| ∗log2FC in expression of this searched gene in stem-like cells from each diseased tissue sample relative to stem-like cells in normal samples in each tissue plotted against the malignancy continuum. Samples are colored based on if they are from different disease stage. |
Top |
Malignant transformation related pathway analysis |
| Find out the enriched GO biological processes and KEGG pathways involved in transition from healthy to precancer to cancer |
| Tissue | Disease Stage | Enriched GO biological Processes |
| Colorectum | AD |  |
| Colorectum | SER |  |
| Colorectum | MSS |  |
| Colorectum | MSI-H |  |
| Colorectum | FAP |  |
| ∗Top 15 enriched GO BP terms are showed in the bar plot of each disease state in each tissue. Each row represents a significant GO biological process which is colored according to the -log10(p.adjust). |
| Page: 1 2 3 4 5 6 7 8 9 |
| GO ID | Tissue | Disease Stage | Description | Gene Ratio | Bg Ratio | pvalue | p.adjust | Count |
| GO:000838026 | Esophagus | HGIN | RNA splicing | 160/2587 | 434/18723 | 3.74e-34 | 1.12e-30 | 160 |
| GO:002261327 | Esophagus | HGIN | ribonucleoprotein complex biogenesis | 158/2587 | 463/18723 | 2.61e-29 | 5.23e-26 | 158 |
| GO:000037520 | Esophagus | HGIN | RNA splicing, via transesterification reactions | 115/2587 | 324/18723 | 3.16e-23 | 3.80e-20 | 115 |
| GO:000037720 | Esophagus | HGIN | RNA splicing, via transesterification reactions with bulged adenosine as nucleophile | 113/2587 | 320/18723 | 1.24e-22 | 9.26e-20 | 113 |
| GO:000039820 | Esophagus | HGIN | mRNA splicing, via spliceosome | 113/2587 | 320/18723 | 1.24e-22 | 9.26e-20 | 113 |
| GO:007182627 | Esophagus | HGIN | ribonucleoprotein complex subunit organization | 84/2587 | 227/18723 | 1.34e-18 | 5.37e-16 | 84 |
| GO:002261827 | Esophagus | HGIN | ribonucleoprotein complex assembly | 82/2587 | 220/18723 | 2.07e-18 | 7.36e-16 | 82 |
| GO:00002457 | Esophagus | HGIN | spliceosomal complex assembly | 25/2587 | 79/18723 | 3.74e-05 | 9.30e-04 | 25 |
| GO:00063764 | Esophagus | HGIN | mRNA splice site selection | 15/2587 | 49/18723 | 1.88e-03 | 2.01e-02 | 15 |
| GO:0022613111 | Esophagus | ESCC | ribonucleoprotein complex biogenesis | 365/8552 | 463/18723 | 1.74e-49 | 1.11e-45 | 365 |
| GO:0008380111 | Esophagus | ESCC | RNA splicing | 336/8552 | 434/18723 | 1.74e-42 | 3.67e-39 | 336 |
| GO:0000375111 | Esophagus | ESCC | RNA splicing, via transesterification reactions | 248/8552 | 324/18723 | 3.05e-30 | 1.49e-27 | 248 |
| GO:0000377111 | Esophagus | ESCC | RNA splicing, via transesterification reactions with bulged adenosine as nucleophile | 244/8552 | 320/18723 | 2.52e-29 | 1.07e-26 | 244 |
| GO:0000398111 | Esophagus | ESCC | mRNA splicing, via spliceosome | 244/8552 | 320/18723 | 2.52e-29 | 1.07e-26 | 244 |
| GO:0071826111 | Esophagus | ESCC | ribonucleoprotein complex subunit organization | 166/8552 | 227/18723 | 2.94e-17 | 2.42e-15 | 166 |
| GO:0022618111 | Esophagus | ESCC | ribonucleoprotein complex assembly | 159/8552 | 220/18723 | 8.19e-16 | 5.71e-14 | 159 |
| GO:000024514 | Esophagus | ESCC | spliceosomal complex assembly | 48/8552 | 79/18723 | 4.93e-03 | 1.89e-02 | 48 |
| GO:000838012 | Liver | Cirrhotic | RNA splicing | 229/4634 | 434/18723 | 9.13e-37 | 2.86e-33 | 229 |
| GO:002261312 | Liver | Cirrhotic | ribonucleoprotein complex biogenesis | 231/4634 | 463/18723 | 3.28e-32 | 6.86e-29 | 231 |
| GO:000037512 | Liver | Cirrhotic | RNA splicing, via transesterification reactions | 175/4634 | 324/18723 | 5.95e-30 | 7.47e-27 | 175 |
| Page: 1 2 3 4 |
| Pathway ID | Tissue | Disease Stage | Description | Gene Ratio | Bg Ratio | pvalue | p.adjust | qvalue | Count |
| hsa0304018 | Esophagus | HGIN | Spliceosome | 79/1383 | 217/8465 | 3.22e-13 | 7.00e-12 | 5.56e-12 | 79 |
| hsa0304019 | Esophagus | HGIN | Spliceosome | 79/1383 | 217/8465 | 3.22e-13 | 7.00e-12 | 5.56e-12 | 79 |
| hsa0304027 | Esophagus | ESCC | Spliceosome | 128/4205 | 217/8465 | 3.31e-03 | 8.79e-03 | 4.50e-03 | 128 |
| hsa0304037 | Esophagus | ESCC | Spliceosome | 128/4205 | 217/8465 | 3.31e-03 | 8.79e-03 | 4.50e-03 | 128 |
| hsa030407 | Liver | Cirrhotic | Spliceosome | 102/2530 | 217/8465 | 5.69e-08 | 9.47e-07 | 5.84e-07 | 102 |
| hsa0304012 | Liver | Cirrhotic | Spliceosome | 102/2530 | 217/8465 | 5.69e-08 | 9.47e-07 | 5.84e-07 | 102 |
| hsa0304022 | Liver | HCC | Spliceosome | 122/4020 | 217/8465 | 5.55e-03 | 1.60e-02 | 8.91e-03 | 122 |
| hsa0304032 | Liver | HCC | Spliceosome | 122/4020 | 217/8465 | 5.55e-03 | 1.60e-02 | 8.91e-03 | 122 |
| hsa0304016 | Oral cavity | OSCC | Spliceosome | 123/3704 | 217/8465 | 7.21e-05 | 2.74e-04 | 1.40e-04 | 123 |
| hsa0304017 | Oral cavity | OSCC | Spliceosome | 123/3704 | 217/8465 | 7.21e-05 | 2.74e-04 | 1.40e-04 | 123 |
| Page: 1 |
Top |
Cell-cell communication analysis |
| Identification of potential cell-cell interactions between two cell types and their ligand-receptor pairs for different disease states |
| Ligand | Receptor | LRpair | Pathway | Tissue | Disease Stage |
| Page: 1 |
Top |
Single-cell gene regulatory network inference analysis |
| Find out the significant the regulons (TFs) and the target genes of each regulon across cell types for different disease states |
| TF | Cell Type | Tissue | Disease Stage | Target Gene | RSS | Regulon Activity |
| ∗The dot plots of a searched regulon are shown for all cell subpopulations in each disease state of each tissue based on the regulon specific score inferred using pySCENIC and by calculating the average expression. |
| Page: 1 |
Top |
Somatic mutation of malignant transformation related genes |
| Annotation of somatic variants for genes involved in malignant transformation |
| Hugo Symbol | Variant Class | Variant Classification | dbSNP RS | HGVSc | HGVSp | HGVSp Short | SWISSPROT | BIOTYPE | SIFT | PolyPhen | Tumor Sample Barcode | Tissue | Histology | Sex | Age | Stage | Therapy Types | Drugs | Outcome |
| SF3A3 | SNV | Missense_Mutation | novel | c.260N>C | p.Arg87Thr | p.R87T | Q12874 | protein_coding | deleterious(0) | probably_damaging(0.977) | TCGA-3C-AALI-01 | Breast | breast invasive carcinoma | Female | <65 | I/II | Unspecific | Poly E | Complete Response |
| SF3A3 | SNV | Missense_Mutation | c.644N>T | p.Ala215Val | p.A215V | Q12874 | protein_coding | tolerated(0.18) | benign(0) | TCGA-BH-A0HF-01 | Breast | breast invasive carcinoma | Female | >=65 | I/II | Hormone Therapy | arimidex | SD | |
| SF3A3 | insertion | Frame_Shift_Ins | novel | c.751_752insTAATGGAACTTATGGTCATATGGGAAAAACAGACAAATAAG | p.Ser251LeufsTer27 | p.S251Lfs*27 | Q12874 | protein_coding | TCGA-C8-A1HE-01 | Breast | breast invasive carcinoma | Female | <65 | I/II | Unknown | Unknown | SD | ||
| SF3A3 | deletion | Frame_Shift_Del | novel | c.693delA | p.Glu232ArgfsTer6 | p.E232Rfs*6 | Q12874 | protein_coding | TCGA-D8-A27V-01 | Breast | breast invasive carcinoma | Female | <65 | I/II | Hormone Therapy | tamoxiphen | SD | ||
| SF3A3 | deletion | Frame_Shift_Del | novel | c.1308delG | p.Arg436SerfsTer14 | p.R436Sfs*14 | Q12874 | protein_coding | TCGA-EW-A2FV-01 | Breast | breast invasive carcinoma | Female | <65 | III/IV | Chemotherapy | docetaxel | SD | ||
| SF3A3 | SNV | Missense_Mutation | novel | c.184N>A | p.Asp62Asn | p.D62N | Q12874 | protein_coding | tolerated(0.1) | benign(0.035) | TCGA-C5-A2LY-01 | Cervix | cervical & endocervical cancer | Female | <65 | I/II | Chemotherapy | cisplatin | SD |
| SF3A3 | SNV | Missense_Mutation | novel | c.6G>C | p.Glu2Asp | p.E2D | Q12874 | protein_coding | tolerated(0.3) | probably_damaging(0.956) | TCGA-C5-A3HF-01 | Cervix | cervical & endocervical cancer | Female | <65 | I/II | Unknown | Unknown | PD |
| SF3A3 | SNV | Missense_Mutation | c.816N>C | p.Leu272Phe | p.L272F | Q12874 | protein_coding | deleterious(0) | possibly_damaging(0.783) | TCGA-JX-A3Q0-01 | Cervix | cervical & endocervical cancer | Female | <65 | III/IV | Unknown | Unknown | SD | |
| SF3A3 | SNV | Missense_Mutation | novel | c.646N>A | p.Glu216Lys | p.E216K | Q12874 | protein_coding | tolerated(0.08) | benign(0.01) | TCGA-JX-A3Q0-01 | Cervix | cervical & endocervical cancer | Female | <65 | III/IV | Unknown | Unknown | SD |
| SF3A3 | SNV | Missense_Mutation | novel | c.142N>A | p.Asp48Asn | p.D48N | Q12874 | protein_coding | deleterious(0.03) | benign(0.226) | TCGA-ZJ-AAXT-01 | Cervix | cervical & endocervical cancer | Female | <65 | III/IV | Unknown | Unknown | SD |
| Page: 1 2 3 4 5 |
Top |
Related drugs of malignant transformation related genes |
| Identification of chemicals and drugs interact with genes involved in malignant transfromation |
| (DGIdb 4.0) |
| Entrez ID | Symbol | Category | Interaction Types | Drug Claim Name | Drug Name | PMIDs |
| Page: 1 |

Copyright 2023-Present -The University of Texas Health Science Center at Houston |