
|
|||||
|
 | |
| |
| |
| |
| |
| |
|
Gene: SETDB1 |
Gene summary for SETDB1 |
| Gene information | Species | Human | Gene symbol | SETDB1 | Gene ID | 9869 |
| Gene name | SET domain bifurcated histone lysine methyltransferase 1 | |
| Gene Alias | ESET | |
| Cytomap | 1q21.3 | |
| Gene Type | protein-coding | GO ID | GO:0006325 | UniProtAcc | Q15047 |
Top |
Malignant transformation analysis |
| Identification of the aberrant gene expression in precancerous and cancerous lesions by comparing the gene expression of stem-like cells in diseased tissues with normal stem cells |
| Entrez ID | Symbol | Replicates | Species | Organ | Tissue | Adj P-value | Log2FC | Malignancy |
| 9869 | SETDB1 | LZE4T | Human | Esophagus | ESCC | 6.07e-05 | 1.90e-01 | 0.0811 |
| 9869 | SETDB1 | LZE7T | Human | Esophagus | ESCC | 1.03e-07 | 4.20e-01 | 0.0667 |
| 9869 | SETDB1 | LZE8T | Human | Esophagus | ESCC | 9.23e-03 | 1.03e-01 | 0.067 |
| 9869 | SETDB1 | LZE24T | Human | Esophagus | ESCC | 2.95e-12 | 2.17e-01 | 0.0596 |
| 9869 | SETDB1 | P1T-E | Human | Esophagus | ESCC | 4.31e-04 | 2.18e-01 | 0.0875 |
| 9869 | SETDB1 | P2T-E | Human | Esophagus | ESCC | 7.35e-13 | 3.23e-01 | 0.1177 |
| 9869 | SETDB1 | P4T-E | Human | Esophagus | ESCC | 1.20e-09 | 2.44e-01 | 0.1323 |
| 9869 | SETDB1 | P5T-E | Human | Esophagus | ESCC | 3.26e-09 | 1.65e-01 | 0.1327 |
| 9869 | SETDB1 | P8T-E | Human | Esophagus | ESCC | 1.39e-15 | 2.27e-01 | 0.0889 |
| 9869 | SETDB1 | P9T-E | Human | Esophagus | ESCC | 1.29e-12 | 1.47e-01 | 0.1131 |
| 9869 | SETDB1 | P10T-E | Human | Esophagus | ESCC | 6.51e-16 | 3.38e-01 | 0.116 |
| 9869 | SETDB1 | P11T-E | Human | Esophagus | ESCC | 1.09e-05 | 2.66e-01 | 0.1426 |
| 9869 | SETDB1 | P12T-E | Human | Esophagus | ESCC | 3.84e-16 | 2.02e-01 | 0.1122 |
| 9869 | SETDB1 | P15T-E | Human | Esophagus | ESCC | 4.12e-12 | 3.09e-01 | 0.1149 |
| 9869 | SETDB1 | P16T-E | Human | Esophagus | ESCC | 1.66e-18 | 3.06e-01 | 0.1153 |
| 9869 | SETDB1 | P17T-E | Human | Esophagus | ESCC | 9.37e-04 | 1.49e-01 | 0.1278 |
| 9869 | SETDB1 | P20T-E | Human | Esophagus | ESCC | 2.13e-14 | 2.43e-01 | 0.1124 |
| 9869 | SETDB1 | P21T-E | Human | Esophagus | ESCC | 1.62e-18 | 2.55e-01 | 0.1617 |
| 9869 | SETDB1 | P22T-E | Human | Esophagus | ESCC | 1.86e-21 | 3.01e-01 | 0.1236 |
| 9869 | SETDB1 | P23T-E | Human | Esophagus | ESCC | 2.76e-16 | 3.84e-01 | 0.108 |
| Page: 1 2 3 4 |
| Tissue | Expression Dynamics | Abbreviation |
| Esophagus | 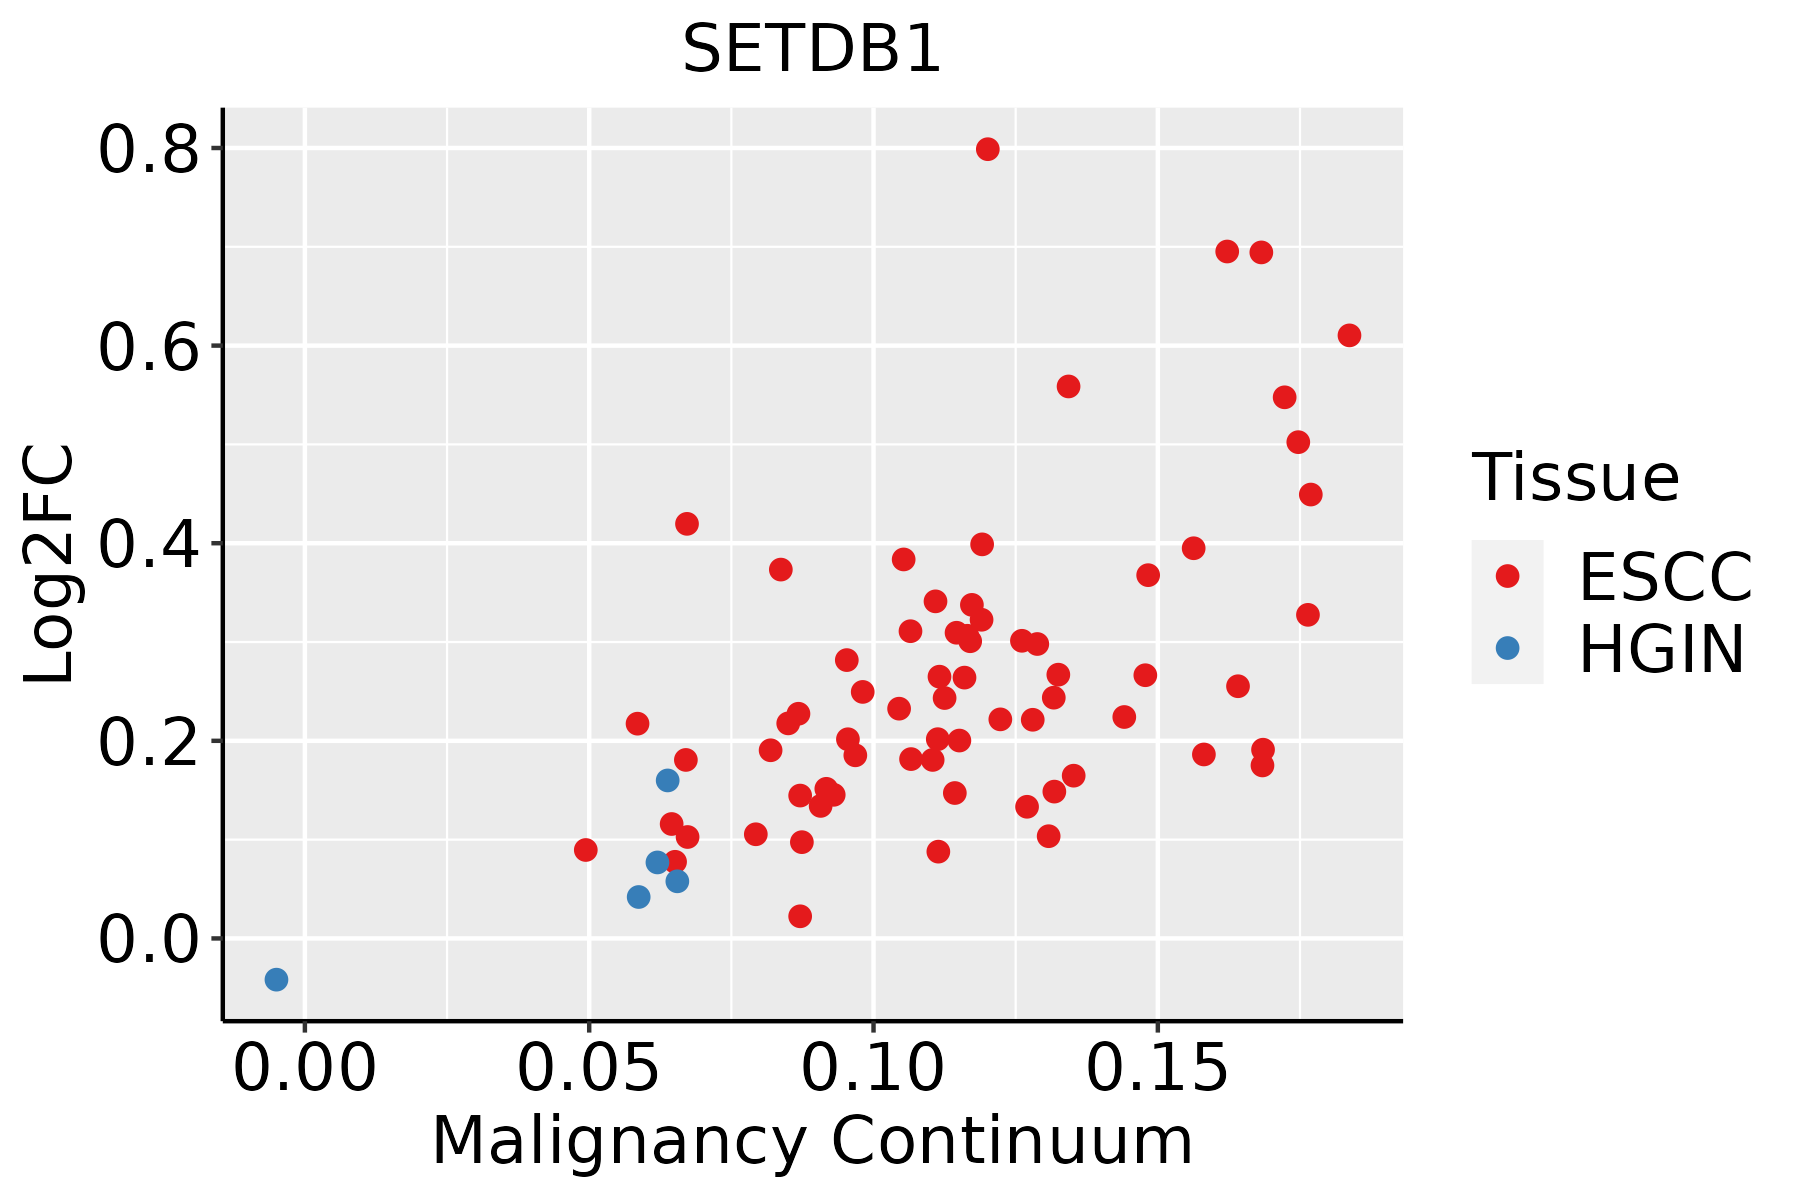 | ESCC: Esophageal squamous cell carcinoma |
| HGIN: High-grade intraepithelial neoplasias | ||
| LGIN: Low-grade intraepithelial neoplasias | ||
| Liver | 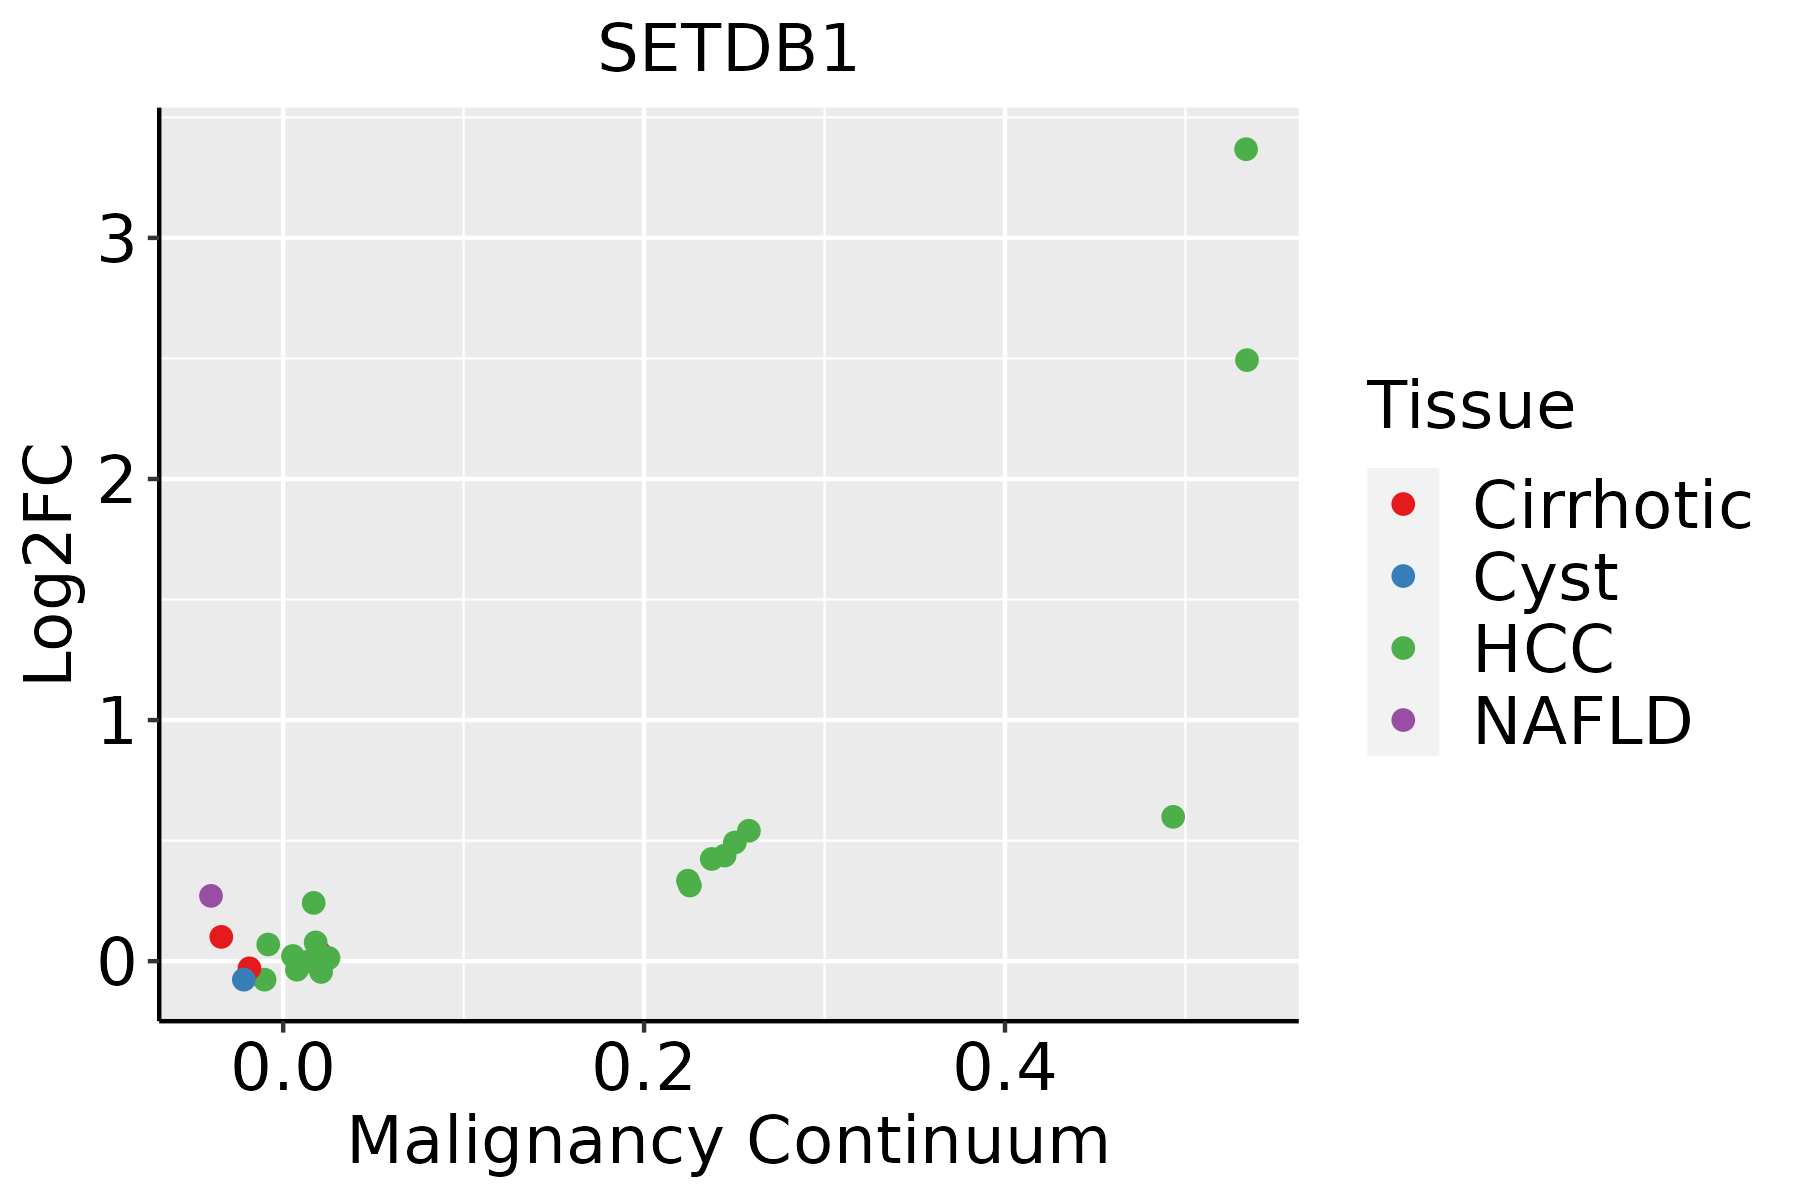 | HCC: Hepatocellular carcinoma |
| NAFLD: Non-alcoholic fatty liver disease |
| ∗log2FC in expression of this searched gene in stem-like cells from each diseased tissue sample relative to stem-like cells in normal samples in each tissue plotted against the malignancy continuum. Samples are colored based on if they are from different disease stage. |
Top |
Malignant transformation related pathway analysis |
| Find out the enriched GO biological processes and KEGG pathways involved in transition from healthy to precancer to cancer |
| Tissue | Disease Stage | Enriched GO biological Processes |
| Colorectum | AD |  |
| Colorectum | SER |  |
| Colorectum | MSS |  |
| Colorectum | MSI-H |  |
| Colorectum | FAP |  |
| ∗Top 15 enriched GO BP terms are showed in the bar plot of each disease state in each tissue. Each row represents a significant GO biological process which is colored according to the -log10(p.adjust). |
| Page: 1 2 3 4 5 6 7 8 9 |
| GO ID | Tissue | Disease Stage | Description | Gene Ratio | Bg Ratio | pvalue | p.adjust | Count |
| GO:0016032111 | Esophagus | ESCC | viral process | 301/8552 | 415/18723 | 3.34e-29 | 1.32e-26 | 301 |
| GO:001657015 | Esophagus | ESCC | histone modification | 323/8552 | 463/18723 | 2.61e-26 | 7.88e-24 | 323 |
| GO:0019058111 | Esophagus | ESCC | viral life cycle | 226/8552 | 317/18723 | 1.17e-20 | 1.76e-18 | 226 |
| GO:001820514 | Esophagus | ESCC | peptidyl-lysine modification | 259/8552 | 376/18723 | 3.90e-20 | 5.26e-18 | 259 |
| GO:003304416 | Esophagus | ESCC | regulation of chromosome organization | 145/8552 | 187/18723 | 3.80e-19 | 4.31e-17 | 145 |
| GO:0019079111 | Esophagus | ESCC | viral genome replication | 102/8552 | 131/18723 | 4.31e-14 | 2.19e-12 | 102 |
| GO:0050792111 | Esophagus | ESCC | regulation of viral process | 119/8552 | 164/18723 | 2.19e-12 | 9.03e-11 | 119 |
| GO:0031667111 | Esophagus | ESCC | response to nutrient levels | 289/8552 | 474/18723 | 9.25e-12 | 3.47e-10 | 289 |
| GO:1903900111 | Esophagus | ESCC | regulation of viral life cycle | 106/8552 | 148/18723 | 1.26e-10 | 3.72e-09 | 106 |
| GO:00434143 | Esophagus | ESCC | macromolecule methylation | 199/8552 | 316/18723 | 3.44e-10 | 9.57e-09 | 199 |
| GO:0045069110 | Esophagus | ESCC | regulation of viral genome replication | 67/8552 | 85/18723 | 3.81e-10 | 1.04e-08 | 67 |
| GO:200125219 | Esophagus | ESCC | positive regulation of chromosome organization | 64/8552 | 82/18723 | 1.98e-09 | 4.52e-08 | 64 |
| GO:00322592 | Esophagus | ESCC | methylation | 222/8552 | 364/18723 | 2.26e-09 | 5.09e-08 | 222 |
| GO:000632517 | Esophagus | ESCC | chromatin organization | 240/8552 | 409/18723 | 6.52e-08 | 1.14e-06 | 240 |
| GO:000758410 | Esophagus | ESCC | response to nutrient | 114/8552 | 174/18723 | 9.43e-08 | 1.56e-06 | 114 |
| GO:000726510 | Esophagus | ESCC | Ras protein signal transduction | 201/8552 | 337/18723 | 1.44e-07 | 2.30e-06 | 201 |
| GO:00400295 | Esophagus | ESCC | regulation of gene expression, epigenetic | 74/8552 | 105/18723 | 2.24e-07 | 3.42e-06 | 74 |
| GO:004852516 | Esophagus | ESCC | negative regulation of viral process | 66/8552 | 92/18723 | 3.49e-07 | 4.88e-06 | 66 |
| GO:004507114 | Esophagus | ESCC | negative regulation of viral genome replication | 44/8552 | 56/18723 | 4.84e-07 | 6.50e-06 | 44 |
| GO:000647914 | Esophagus | ESCC | protein methylation | 115/8552 | 181/18723 | 9.07e-07 | 1.16e-05 | 115 |
| Page: 1 2 3 4 5 |
| Pathway ID | Tissue | Disease Stage | Description | Gene Ratio | Bg Ratio | pvalue | p.adjust | qvalue | Count |
| hsa0031010 | Esophagus | ESCC | Lysine degradation | 41/4205 | 63/8465 | 9.63e-03 | 2.27e-02 | 1.16e-02 | 41 |
| hsa0031013 | Esophagus | ESCC | Lysine degradation | 41/4205 | 63/8465 | 9.63e-03 | 2.27e-02 | 1.16e-02 | 41 |
| hsa003108 | Liver | NAFLD | Lysine degradation | 21/1043 | 63/8465 | 1.09e-05 | 3.58e-04 | 2.89e-04 | 21 |
| hsa0031011 | Liver | NAFLD | Lysine degradation | 21/1043 | 63/8465 | 1.09e-05 | 3.58e-04 | 2.89e-04 | 21 |
| hsa0031041 | Liver | HCC | Lysine degradation | 47/4020 | 63/8465 | 1.02e-05 | 7.58e-05 | 4.22e-05 | 47 |
| hsa0031051 | Liver | HCC | Lysine degradation | 47/4020 | 63/8465 | 1.02e-05 | 7.58e-05 | 4.22e-05 | 47 |
| Page: 1 |
Top |
Cell-cell communication analysis |
| Identification of potential cell-cell interactions between two cell types and their ligand-receptor pairs for different disease states |
| Ligand | Receptor | LRpair | Pathway | Tissue | Disease Stage |
| Page: 1 |
Top |
Single-cell gene regulatory network inference analysis |
| Find out the significant the regulons (TFs) and the target genes of each regulon across cell types for different disease states |
| TF | Cell Type | Tissue | Disease Stage | Target Gene | RSS | Regulon Activity |
| SETDB1 | NEUT | Endometrium | EEC | IFT57,DUSP18,CLDN1, etc. | 9.48e-02 |  |
| SETDB1 | M1MAC | Esophagus | ADJ | BSPRY,ERP44,RNF216, etc. | 5.26e-01 |  |
| SETDB1 | NK | Esophagus | ADJ | BSPRY,ERP44,RNF216, etc. | 1.07e-01 | |
| SETDB1 | NK | Esophagus | ESCC | BSPRY,ERP44,RNF216, etc. | 7.37e-02 |  |
| SETDB1 | M1MAC | Esophagus | ESCC | BSPRY,ERP44,RNF216, etc. | 5.51e-01 | |
| SETDB1 | TREG | Lung | AAH | ZNF26,DCAF16,SLC25A4, etc. | 6.72e-02 |  |
| SETDB1 | CAF | Oral cavity | EOLP | TSGA10,SNX30,IFIT3, etc. | 9.69e-02 |  |
| SETDB1 | FIB | Oral cavity | Healthy | TSGA10,SNX30,IFIT3, etc. | 1.16e-01 |  |
| SETDB1 | MVA | Thyroid | HT | ACAD10,PDP1,MTND2P13, etc. | 3.37e-01 |  |
| ∗The dot plots of a searched regulon are shown for all cell subpopulations in each disease state of each tissue based on the regulon specific score inferred using pySCENIC and by calculating the average expression. |
| Page: 1 |
Top |
Somatic mutation of malignant transformation related genes |
| Annotation of somatic variants for genes involved in malignant transformation |
| Hugo Symbol | Variant Class | Variant Classification | dbSNP RS | HGVSc | HGVSp | HGVSp Short | SWISSPROT | BIOTYPE | SIFT | PolyPhen | Tumor Sample Barcode | Tissue | Histology | Sex | Age | Stage | Therapy Types | Drugs | Outcome |
| SETDB1 | SNV | Missense_Mutation | c.892N>T | p.Asp298Tyr | p.D298Y | Q15047 | protein_coding | deleterious(0) | probably_damaging(0.999) | TCGA-A1-A0SO-01 | Breast | breast invasive carcinoma | Female | >=65 | I/II | Chemotherapy | SD | ||
| SETDB1 | SNV | Missense_Mutation | c.2536N>T | p.Gly846Cys | p.G846C | Q15047 | protein_coding | deleterious(0) | probably_damaging(1) | TCGA-A2-A04P-01 | Breast | breast invasive carcinoma | Female | <65 | III/IV | Chemotherapy | taxol | PD | |
| SETDB1 | SNV | Missense_Mutation | c.3340N>C | p.Thr1114Pro | p.T1114P | Q15047 | protein_coding | tolerated_low_confidence(0.23) | benign(0.153) | TCGA-A2-A0CS-01 | Breast | breast invasive carcinoma | Female | >=65 | III/IV | Hormone Therapy | anastrozole | SD | |
| SETDB1 | SNV | Missense_Mutation | c.3340A>C | p.Thr1114Pro | p.T1114P | Q15047 | protein_coding | tolerated_low_confidence(0.23) | benign(0.153) | TCGA-A2-A1G4-01 | Breast | breast invasive carcinoma | Female | >=65 | III/IV | Chemotherapy | adriamycin | SD | |
| SETDB1 | SNV | Missense_Mutation | c.1493N>A | p.Ser498Tyr | p.S498Y | Q15047 | protein_coding | deleterious(0) | probably_damaging(0.979) | TCGA-A8-A06Q-01 | Breast | breast invasive carcinoma | Female | <65 | III/IV | Unknown | Unknown | SD | |
| SETDB1 | SNV | Missense_Mutation | c.1454N>C | p.Lys485Thr | p.K485T | Q15047 | protein_coding | tolerated(0.09) | possibly_damaging(0.749) | TCGA-A8-A07L-01 | Breast | breast invasive carcinoma | Female | <65 | III/IV | Chemotherapy | CR | ||
| SETDB1 | SNV | Missense_Mutation | c.3319G>C | p.Glu1107Gln | p.E1107Q | Q15047 | protein_coding | tolerated_low_confidence(0.22) | benign(0.365) | TCGA-AC-A23H-01 | Breast | breast invasive carcinoma | Female | >=65 | I/II | Unknown | Unknown | PD | |
| SETDB1 | SNV | Missense_Mutation | rs751371356 | c.3176N>A | p.Arg1059Gln | p.R1059Q | Q15047 | protein_coding | tolerated_low_confidence(0.19) | benign(0.003) | TCGA-AN-A04C-01 | Breast | breast invasive carcinoma | Female | <65 | I/II | Unknown | Unknown | SD |
| SETDB1 | SNV | Missense_Mutation | c.2613N>C | p.Glu871Asp | p.E871D | Q15047 | protein_coding | deleterious(0) | probably_damaging(0.992) | TCGA-AN-A0XW-01 | Breast | breast invasive carcinoma | Female | <65 | III/IV | Unknown | Unknown | SD | |
| SETDB1 | SNV | Missense_Mutation | c.201N>T | p.Trp67Cys | p.W67C | Q15047 | protein_coding | tolerated_low_confidence(0.32) | possibly_damaging(0.667) | TCGA-AO-A128-01 | Breast | breast invasive carcinoma | Female | <65 | I/II | Chemotherapy | doxorubicin | SD |
| Page: 1 2 3 4 5 6 7 8 9 10 11 12 13 14 15 16 |
Top |
Related drugs of malignant transformation related genes |
| Identification of chemicals and drugs interact with genes involved in malignant transfromation |
| (DGIdb 4.0) |
| Entrez ID | Symbol | Category | Interaction Types | Drug Claim Name | Drug Name | PMIDs |
| Page: 1 |

Copyright 2023-Present -The University of Texas Health Science Center at Houston |