
|
|||||
|
 | |
| |
| |
| |
| |
| |
|
Gene: SETD9 |
Gene summary for SETD9 |
| Gene information | Species | Human | Gene symbol | SETD9 | Gene ID | 133383 |
| Gene name | SET domain containing 9 | |
| Gene Alias | C5orf35 | |
| Cytomap | 5q11.2 | |
| Gene Type | protein-coding | GO ID | GO:0007154 | UniProtAcc | Q8NE22 |
Top |
Malignant transformation analysis |
| Identification of the aberrant gene expression in precancerous and cancerous lesions by comparing the gene expression of stem-like cells in diseased tissues with normal stem cells |
| Entrez ID | Symbol | Replicates | Species | Organ | Tissue | Adj P-value | Log2FC | Malignancy |
| 133383 | SETD9 | LZE7T | Human | Esophagus | ESCC | 3.37e-02 | 1.22e-01 | 0.0667 |
| 133383 | SETD9 | LZE8T | Human | Esophagus | ESCC | 2.24e-06 | 1.97e-01 | 0.067 |
| 133383 | SETD9 | LZE22T | Human | Esophagus | ESCC | 1.72e-03 | 3.00e-01 | 0.068 |
| 133383 | SETD9 | LZE24T | Human | Esophagus | ESCC | 1.57e-11 | 2.30e-01 | 0.0596 |
| 133383 | SETD9 | LZE21T | Human | Esophagus | ESCC | 2.65e-05 | 4.14e-01 | 0.0655 |
| 133383 | SETD9 | P1T-E | Human | Esophagus | ESCC | 8.39e-10 | 4.12e-01 | 0.0875 |
| 133383 | SETD9 | P2T-E | Human | Esophagus | ESCC | 3.54e-19 | 4.38e-01 | 0.1177 |
| 133383 | SETD9 | P4T-E | Human | Esophagus | ESCC | 2.68e-16 | 4.18e-01 | 0.1323 |
| 133383 | SETD9 | P5T-E | Human | Esophagus | ESCC | 7.13e-10 | 1.39e-01 | 0.1327 |
| 133383 | SETD9 | P8T-E | Human | Esophagus | ESCC | 1.86e-10 | 1.88e-01 | 0.0889 |
| 133383 | SETD9 | P9T-E | Human | Esophagus | ESCC | 1.57e-11 | 2.36e-01 | 0.1131 |
| 133383 | SETD9 | P10T-E | Human | Esophagus | ESCC | 3.47e-07 | 1.16e-01 | 0.116 |
| 133383 | SETD9 | P11T-E | Human | Esophagus | ESCC | 3.35e-07 | 2.72e-01 | 0.1426 |
| 133383 | SETD9 | P12T-E | Human | Esophagus | ESCC | 2.74e-03 | 5.45e-02 | 0.1122 |
| 133383 | SETD9 | P15T-E | Human | Esophagus | ESCC | 2.93e-08 | 8.12e-02 | 0.1149 |
| 133383 | SETD9 | P16T-E | Human | Esophagus | ESCC | 1.67e-06 | 1.41e-01 | 0.1153 |
| 133383 | SETD9 | P17T-E | Human | Esophagus | ESCC | 7.16e-04 | 2.94e-01 | 0.1278 |
| 133383 | SETD9 | P19T-E | Human | Esophagus | ESCC | 2.42e-02 | 2.47e-01 | 0.1662 |
| 133383 | SETD9 | P21T-E | Human | Esophagus | ESCC | 7.93e-11 | 2.25e-01 | 0.1617 |
| 133383 | SETD9 | P22T-E | Human | Esophagus | ESCC | 2.12e-18 | 3.64e-01 | 0.1236 |
| Page: 1 2 3 |
| Tissue | Expression Dynamics | Abbreviation |
| Esophagus | 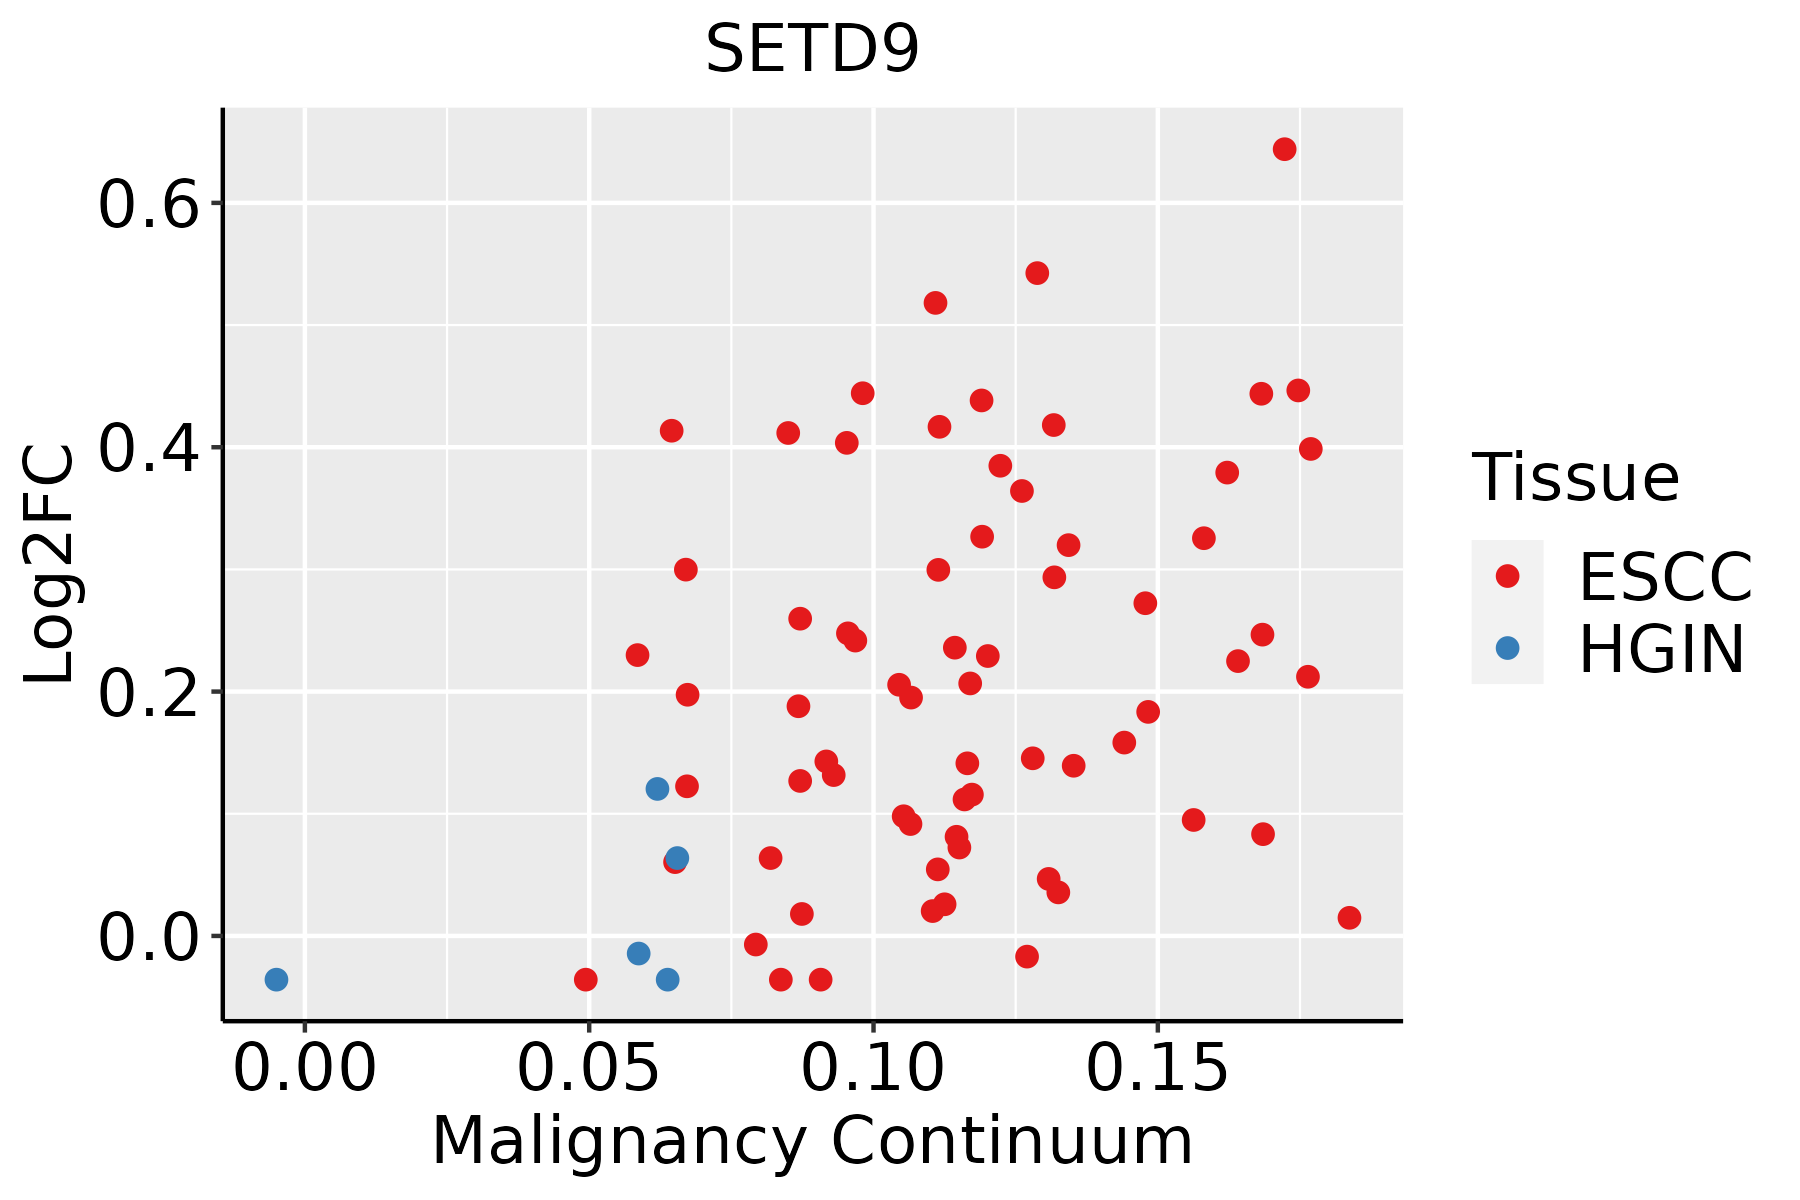 | ESCC: Esophageal squamous cell carcinoma |
| HGIN: High-grade intraepithelial neoplasias | ||
| LGIN: Low-grade intraepithelial neoplasias | ||
| Thyroid | 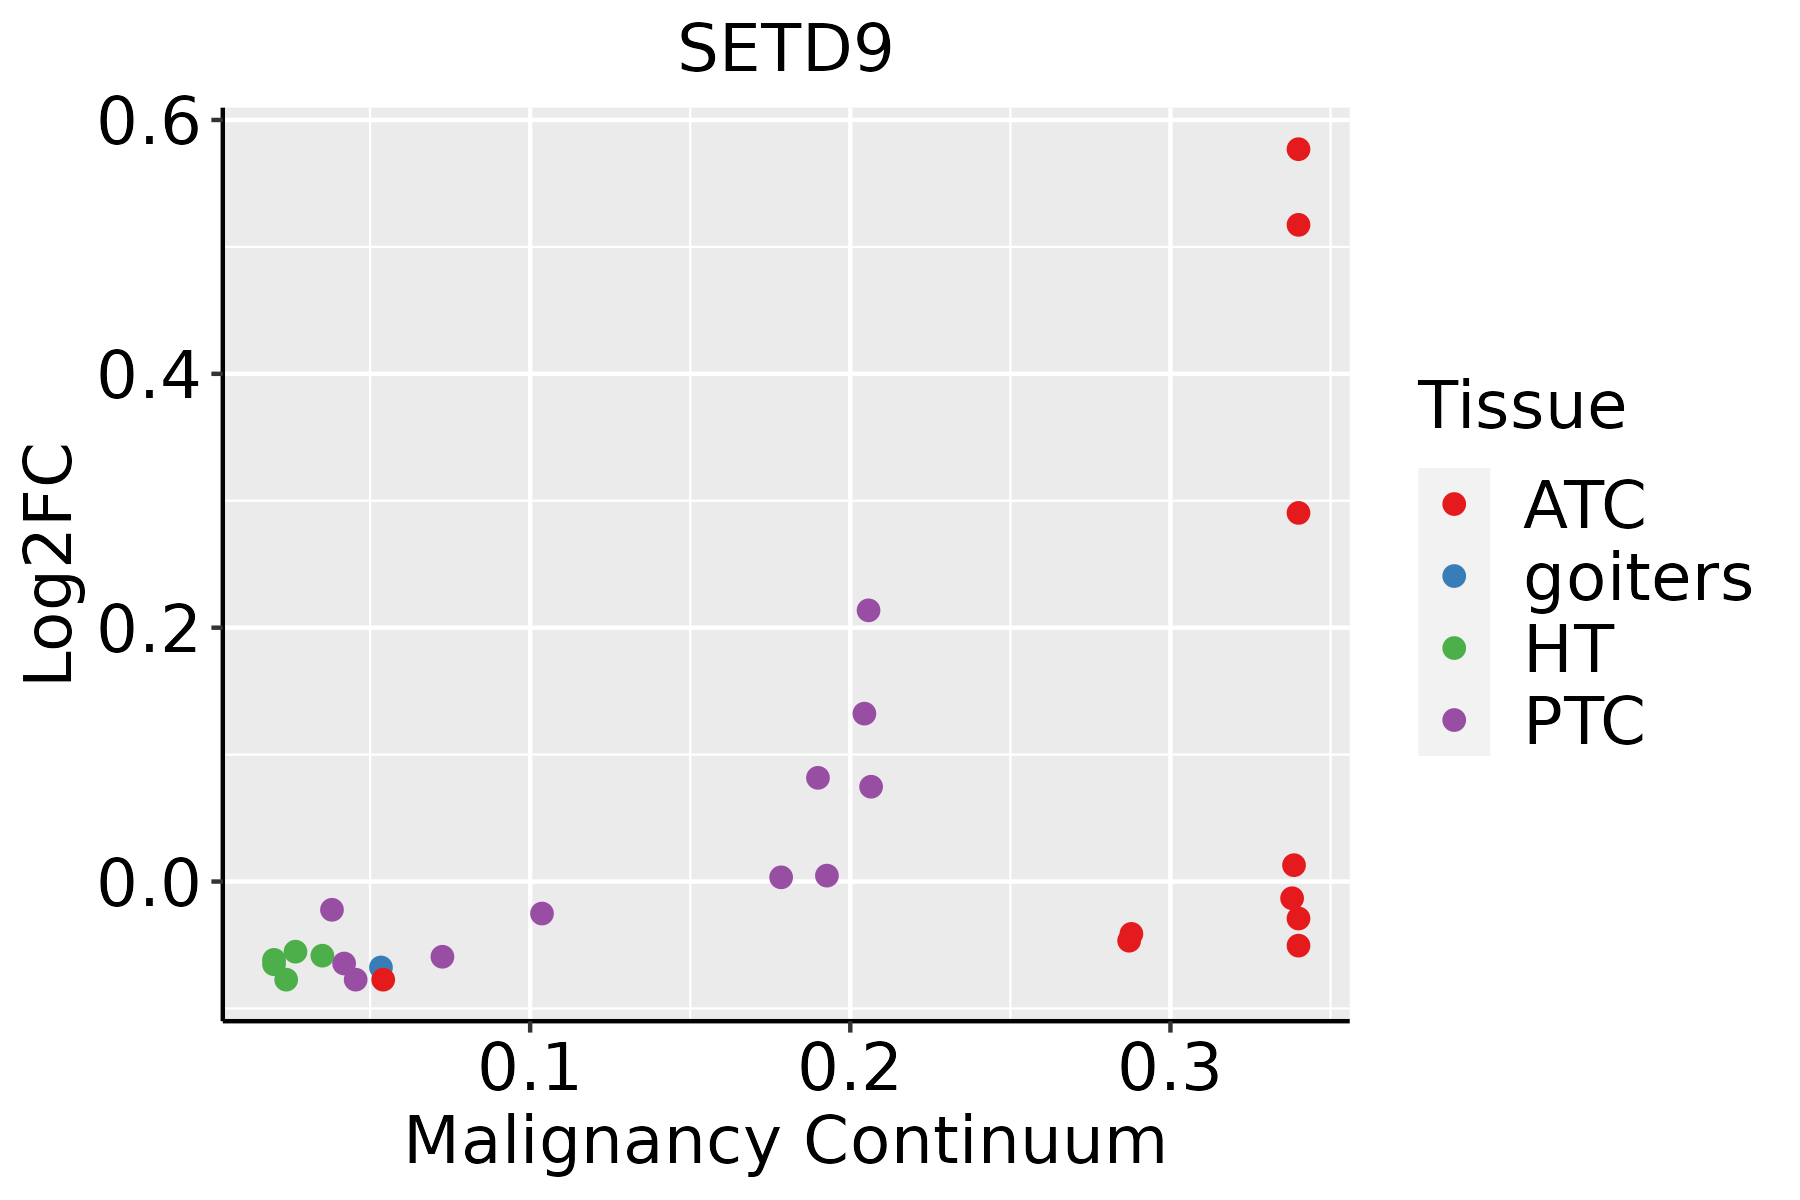 | ATC: Anaplastic thyroid cancer |
| HT: Hashimoto's thyroiditis | ||
| PTC: Papillary thyroid cancer |
| ∗log2FC in expression of this searched gene in stem-like cells from each diseased tissue sample relative to stem-like cells in normal samples in each tissue plotted against the malignancy continuum. Samples are colored based on if they are from different disease stage. |
Top |
Malignant transformation related pathway analysis |
| Find out the enriched GO biological processes and KEGG pathways involved in transition from healthy to precancer to cancer |
| Tissue | Disease Stage | Enriched GO biological Processes |
| Colorectum | AD |  |
| Colorectum | SER |  |
| Colorectum | MSS |  |
| Colorectum | MSI-H |  |
| Colorectum | FAP |  |
| ∗Top 15 enriched GO BP terms are showed in the bar plot of each disease state in each tissue. Each row represents a significant GO biological process which is colored according to the -log10(p.adjust). |
| Page: 1 2 3 4 5 6 7 8 9 |
| GO ID | Tissue | Disease Stage | Description | Gene Ratio | Bg Ratio | pvalue | p.adjust | Count |
| GO:0072331111 | Esophagus | ESCC | signal transduction by p53 class mediator | 121/8552 | 163/18723 | 9.61e-14 | 4.69e-12 | 121 |
| GO:00322592 | Esophagus | ESCC | methylation | 222/8552 | 364/18723 | 2.26e-09 | 5.09e-08 | 222 |
| GO:1901796111 | Esophagus | ESCC | regulation of signal transduction by p53 class mediator | 70/8552 | 93/18723 | 5.69e-09 | 1.18e-07 | 70 |
| GO:0072331113 | Thyroid | PTC | signal transduction by p53 class mediator | 92/5968 | 163/18723 | 7.29e-11 | 2.54e-09 | 92 |
| GO:1901796113 | Thyroid | PTC | regulation of signal transduction by p53 class mediator | 58/5968 | 93/18723 | 1.38e-09 | 3.95e-08 | 58 |
| GO:00322594 | Thyroid | PTC | methylation | 146/5968 | 364/18723 | 4.99e-04 | 3.26e-03 | 146 |
| GO:007233135 | Thyroid | ATC | signal transduction by p53 class mediator | 102/6293 | 163/18723 | 3.16e-14 | 1.75e-12 | 102 |
| GO:190179635 | Thyroid | ATC | regulation of signal transduction by p53 class mediator | 66/6293 | 93/18723 | 1.86e-13 | 9.20e-12 | 66 |
| GO:003225911 | Thyroid | ATC | methylation | 148/6293 | 364/18723 | 2.69e-03 | 1.23e-02 | 148 |
| Page: 1 |
| Pathway ID | Tissue | Disease Stage | Description | Gene Ratio | Bg Ratio | pvalue | p.adjust | qvalue | Count |
| Page: 1 |
Top |
Cell-cell communication analysis |
| Identification of potential cell-cell interactions between two cell types and their ligand-receptor pairs for different disease states |
| Ligand | Receptor | LRpair | Pathway | Tissue | Disease Stage |
| Page: 1 |
Top |
Single-cell gene regulatory network inference analysis |
| Find out the significant the regulons (TFs) and the target genes of each regulon across cell types for different disease states |
| TF | Cell Type | Tissue | Disease Stage | Target Gene | RSS | Regulon Activity |
| ∗The dot plots of a searched regulon are shown for all cell subpopulations in each disease state of each tissue based on the regulon specific score inferred using pySCENIC and by calculating the average expression. |
| Page: 1 |
Top |
Somatic mutation of malignant transformation related genes |
| Annotation of somatic variants for genes involved in malignant transformation |
| Hugo Symbol | Variant Class | Variant Classification | dbSNP RS | HGVSc | HGVSp | HGVSp Short | SWISSPROT | BIOTYPE | SIFT | PolyPhen | Tumor Sample Barcode | Tissue | Histology | Sex | Age | Stage | Therapy Types | Drugs | Outcome |
| SETD9 | insertion | Frame_Shift_Ins | novel | c.403_404insAAGTCGGGCTGCTCTGGGGCCACGGAGAGAAGGGGAGA | p.Gly135GlufsTer87 | p.G135Efs*87 | Q8NE22 | protein_coding | TCGA-BH-A0DP-01 | Breast | breast invasive carcinoma | Female | <65 | I/II | Hormone Therapy | arimidex | SD | ||
| SETD9 | deletion | Frame_Shift_Del | novel | c.405delN | p.Gly137ValfsTer72 | p.G137Vfs*72 | Q8NE22 | protein_coding | TCGA-D8-A27V-01 | Breast | breast invasive carcinoma | Female | <65 | I/II | Hormone Therapy | tamoxiphen | SD | ||
| SETD9 | SNV | Missense_Mutation | c.185N>T | p.Ala62Val | p.A62V | Q8NE22 | protein_coding | tolerated(0.09) | benign(0.175) | TCGA-Q1-A73Q-01 | Cervix | cervical & endocervical cancer | Female | <65 | I/II | Chemotherapy | cisplatin | SD | |
| SETD9 | SNV | Missense_Mutation | novel | c.174N>C | p.Lys58Asn | p.K58N | Q8NE22 | protein_coding | tolerated(0.1) | benign(0.033) | TCGA-AZ-4315-01 | Colorectum | colon adenocarcinoma | Male | <65 | I/II | Unknown | Unknown | SD |
| SETD9 | SNV | Missense_Mutation | novel | c.346C>A | p.Leu116Ile | p.L116I | Q8NE22 | protein_coding | deleterious(0.01) | possibly_damaging(0.643) | TCGA-AG-A002-01 | Colorectum | rectum adenocarcinoma | Male | <65 | I/II | Unknown | Unknown | SD |
| SETD9 | insertion | Nonsense_Mutation | novel | c.577_578insCATGAA | p.Ser192_Lys193insThrTer | p.S192_K193insT* | Q8NE22 | protein_coding | TCGA-AM-5820-01 | Colorectum | colon adenocarcinoma | Female | <65 | I/II | Unknown | Unknown | SD | ||
| SETD9 | SNV | Missense_Mutation | novel | c.638N>T | p.Ser213Ile | p.S213I | Q8NE22 | protein_coding | tolerated(0.36) | benign(0.001) | TCGA-A5-A0G1-01 | Endometrium | uterine corpus endometrioid carcinoma | Female | >=65 | I/II | Unknown | Unknown | SD |
| SETD9 | SNV | Missense_Mutation | novel | c.688N>A | p.Val230Ile | p.V230I | Q8NE22 | protein_coding | tolerated(0.06) | probably_damaging(0.915) | TCGA-AP-A05O-01 | Endometrium | uterine corpus endometrioid carcinoma | Female | >=65 | I/II | Chemotherapy | carboplatin | PD |
| SETD9 | SNV | Missense_Mutation | novel | c.145N>T | p.Asp49Tyr | p.D49Y | Q8NE22 | protein_coding | deleterious(0) | probably_damaging(0.98) | TCGA-AP-A1DV-01 | Endometrium | uterine corpus endometrioid carcinoma | Female | <65 | I/II | Unknown | Unknown | SD |
| SETD9 | SNV | Missense_Mutation | c.354N>T | p.Lys118Asn | p.K118N | Q8NE22 | protein_coding | tolerated(0.81) | benign(0) | TCGA-AX-A05Z-01 | Endometrium | uterine corpus endometrioid carcinoma | Female | <65 | III/IV | Chemotherapy | adriamycin | SD |
| Page: 1 2 |
Top |
Related drugs of malignant transformation related genes |
| Identification of chemicals and drugs interact with genes involved in malignant transfromation |
| (DGIdb 4.0) |
| Entrez ID | Symbol | Category | Interaction Types | Drug Claim Name | Drug Name | PMIDs |
| Page: 1 |

Copyright 2023-Present -The University of Texas Health Science Center at Houston |