
|
|||||
|
 | |
| |
| |
| |
| |
| |
|
Gene: SETD7 |
Gene summary for SETD7 |
| Gene information | Species | Human | Gene symbol | SETD7 | Gene ID | 80854 |
| Gene name | SET domain containing 7, histone lysine methyltransferase | |
| Gene Alias | KMT7 | |
| Cytomap | 4q31.1 | |
| Gene Type | protein-coding | GO ID | GO:0006139 | UniProtAcc | D6RJA0 |
Top |
Malignant transformation analysis |
| Identification of the aberrant gene expression in precancerous and cancerous lesions by comparing the gene expression of stem-like cells in diseased tissues with normal stem cells |
| Entrez ID | Symbol | Replicates | Species | Organ | Tissue | Adj P-value | Log2FC | Malignancy |
| 80854 | SETD7 | LZE4T | Human | Esophagus | ESCC | 9.81e-06 | 6.97e-02 | 0.0811 |
| 80854 | SETD7 | LZE7T | Human | Esophagus | ESCC | 7.37e-03 | 1.51e-01 | 0.0667 |
| 80854 | SETD7 | LZE22T | Human | Esophagus | ESCC | 1.23e-02 | 1.75e-01 | 0.068 |
| 80854 | SETD7 | LZE24T | Human | Esophagus | ESCC | 2.66e-10 | 1.78e-01 | 0.0596 |
| 80854 | SETD7 | P1T-E | Human | Esophagus | ESCC | 2.80e-02 | 8.95e-02 | 0.0875 |
| 80854 | SETD7 | P2T-E | Human | Esophagus | ESCC | 6.37e-09 | 1.26e-01 | 0.1177 |
| 80854 | SETD7 | P4T-E | Human | Esophagus | ESCC | 8.29e-10 | 2.19e-01 | 0.1323 |
| 80854 | SETD7 | P5T-E | Human | Esophagus | ESCC | 2.28e-11 | 1.66e-02 | 0.1327 |
| 80854 | SETD7 | P8T-E | Human | Esophagus | ESCC | 9.66e-13 | 1.16e-01 | 0.0889 |
| 80854 | SETD7 | P9T-E | Human | Esophagus | ESCC | 2.22e-07 | 1.76e-01 | 0.1131 |
| 80854 | SETD7 | P10T-E | Human | Esophagus | ESCC | 7.17e-07 | -8.03e-03 | 0.116 |
| 80854 | SETD7 | P11T-E | Human | Esophagus | ESCC | 1.29e-04 | 2.43e-01 | 0.1426 |
| 80854 | SETD7 | P12T-E | Human | Esophagus | ESCC | 1.78e-11 | 2.06e-01 | 0.1122 |
| 80854 | SETD7 | P15T-E | Human | Esophagus | ESCC | 8.35e-07 | 4.77e-02 | 0.1149 |
| 80854 | SETD7 | P16T-E | Human | Esophagus | ESCC | 4.49e-04 | 6.19e-02 | 0.1153 |
| 80854 | SETD7 | P17T-E | Human | Esophagus | ESCC | 6.32e-04 | 1.52e-01 | 0.1278 |
| 80854 | SETD7 | P20T-E | Human | Esophagus | ESCC | 8.92e-08 | 5.10e-02 | 0.1124 |
| 80854 | SETD7 | P21T-E | Human | Esophagus | ESCC | 5.06e-03 | -3.98e-02 | 0.1617 |
| 80854 | SETD7 | P22T-E | Human | Esophagus | ESCC | 7.32e-13 | 2.03e-01 | 0.1236 |
| 80854 | SETD7 | P23T-E | Human | Esophagus | ESCC | 1.26e-10 | 1.23e-01 | 0.108 |
| Page: 1 2 3 4 |
| Tissue | Expression Dynamics | Abbreviation |
| Esophagus | 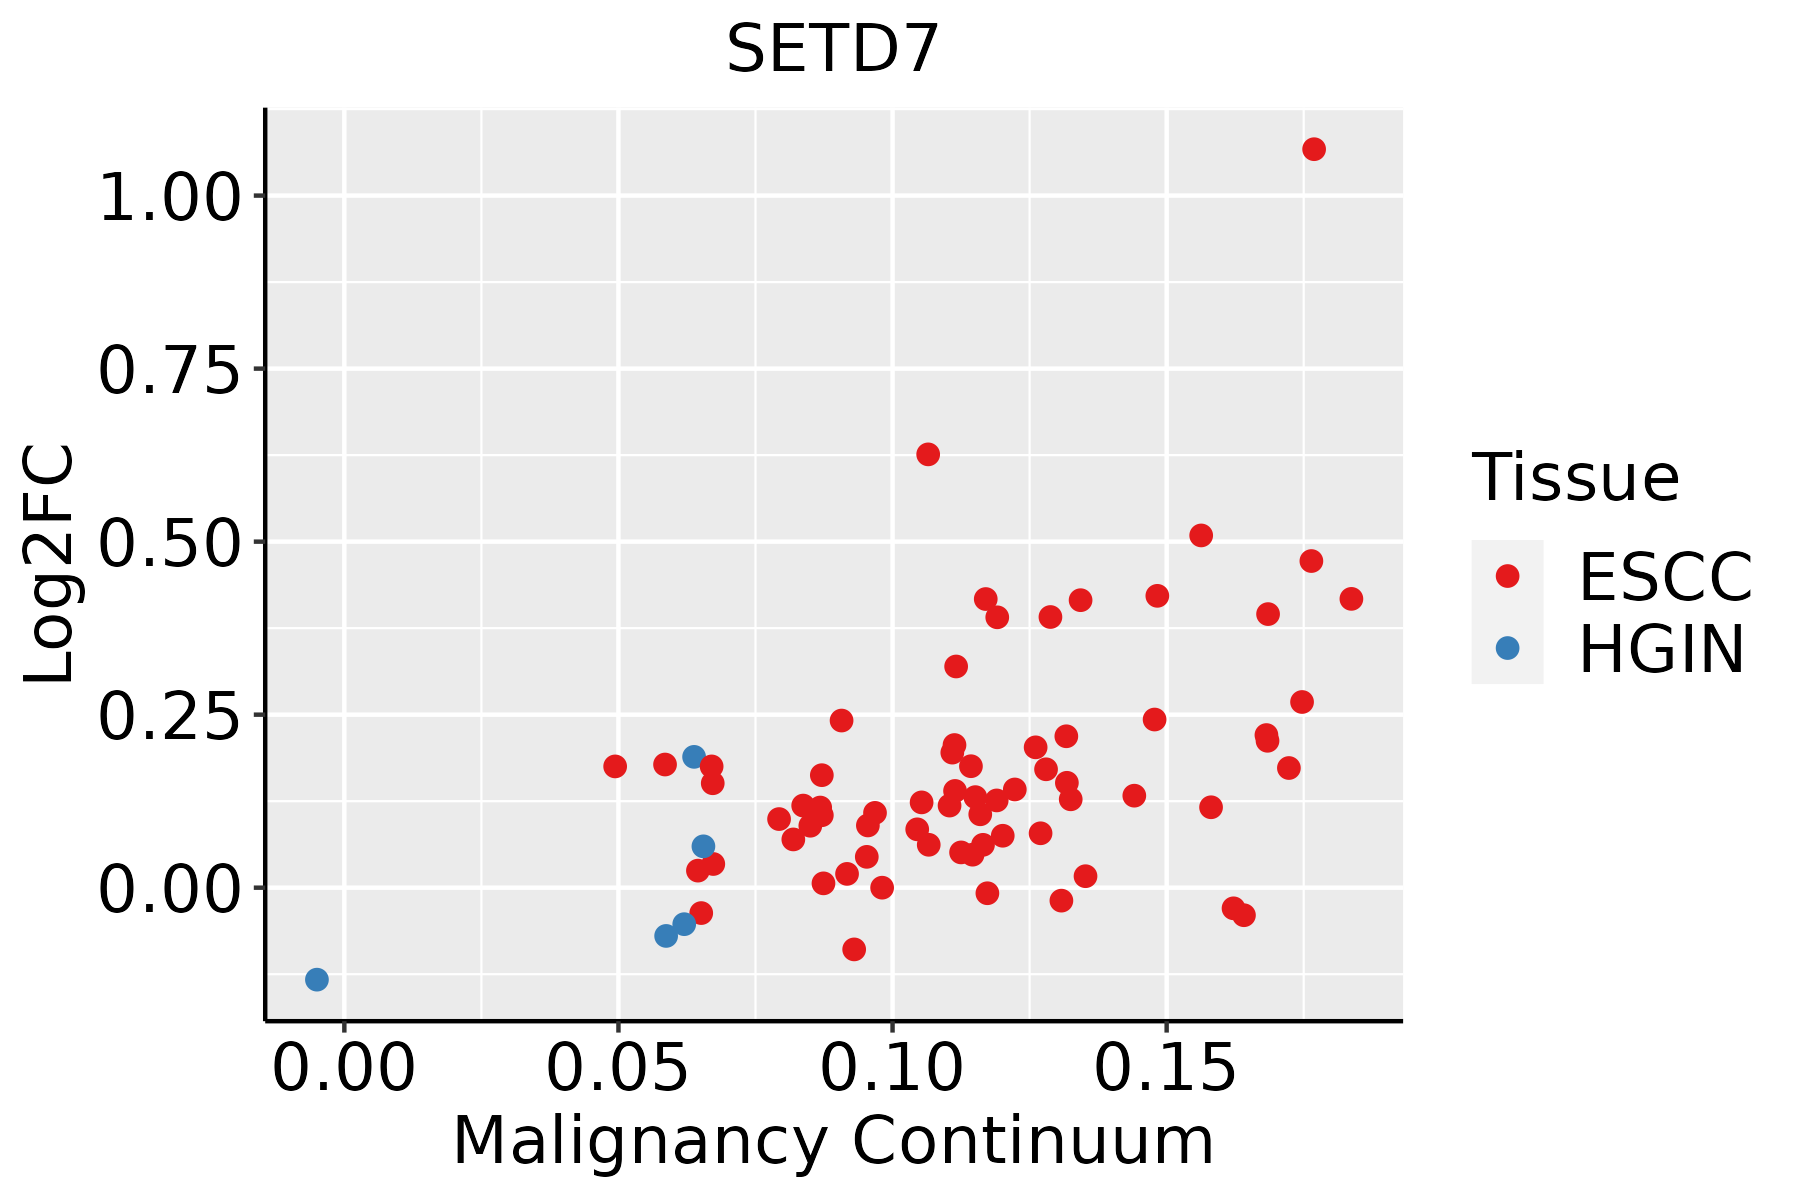 | ESCC: Esophageal squamous cell carcinoma |
| HGIN: High-grade intraepithelial neoplasias | ||
| LGIN: Low-grade intraepithelial neoplasias | ||
| Liver | 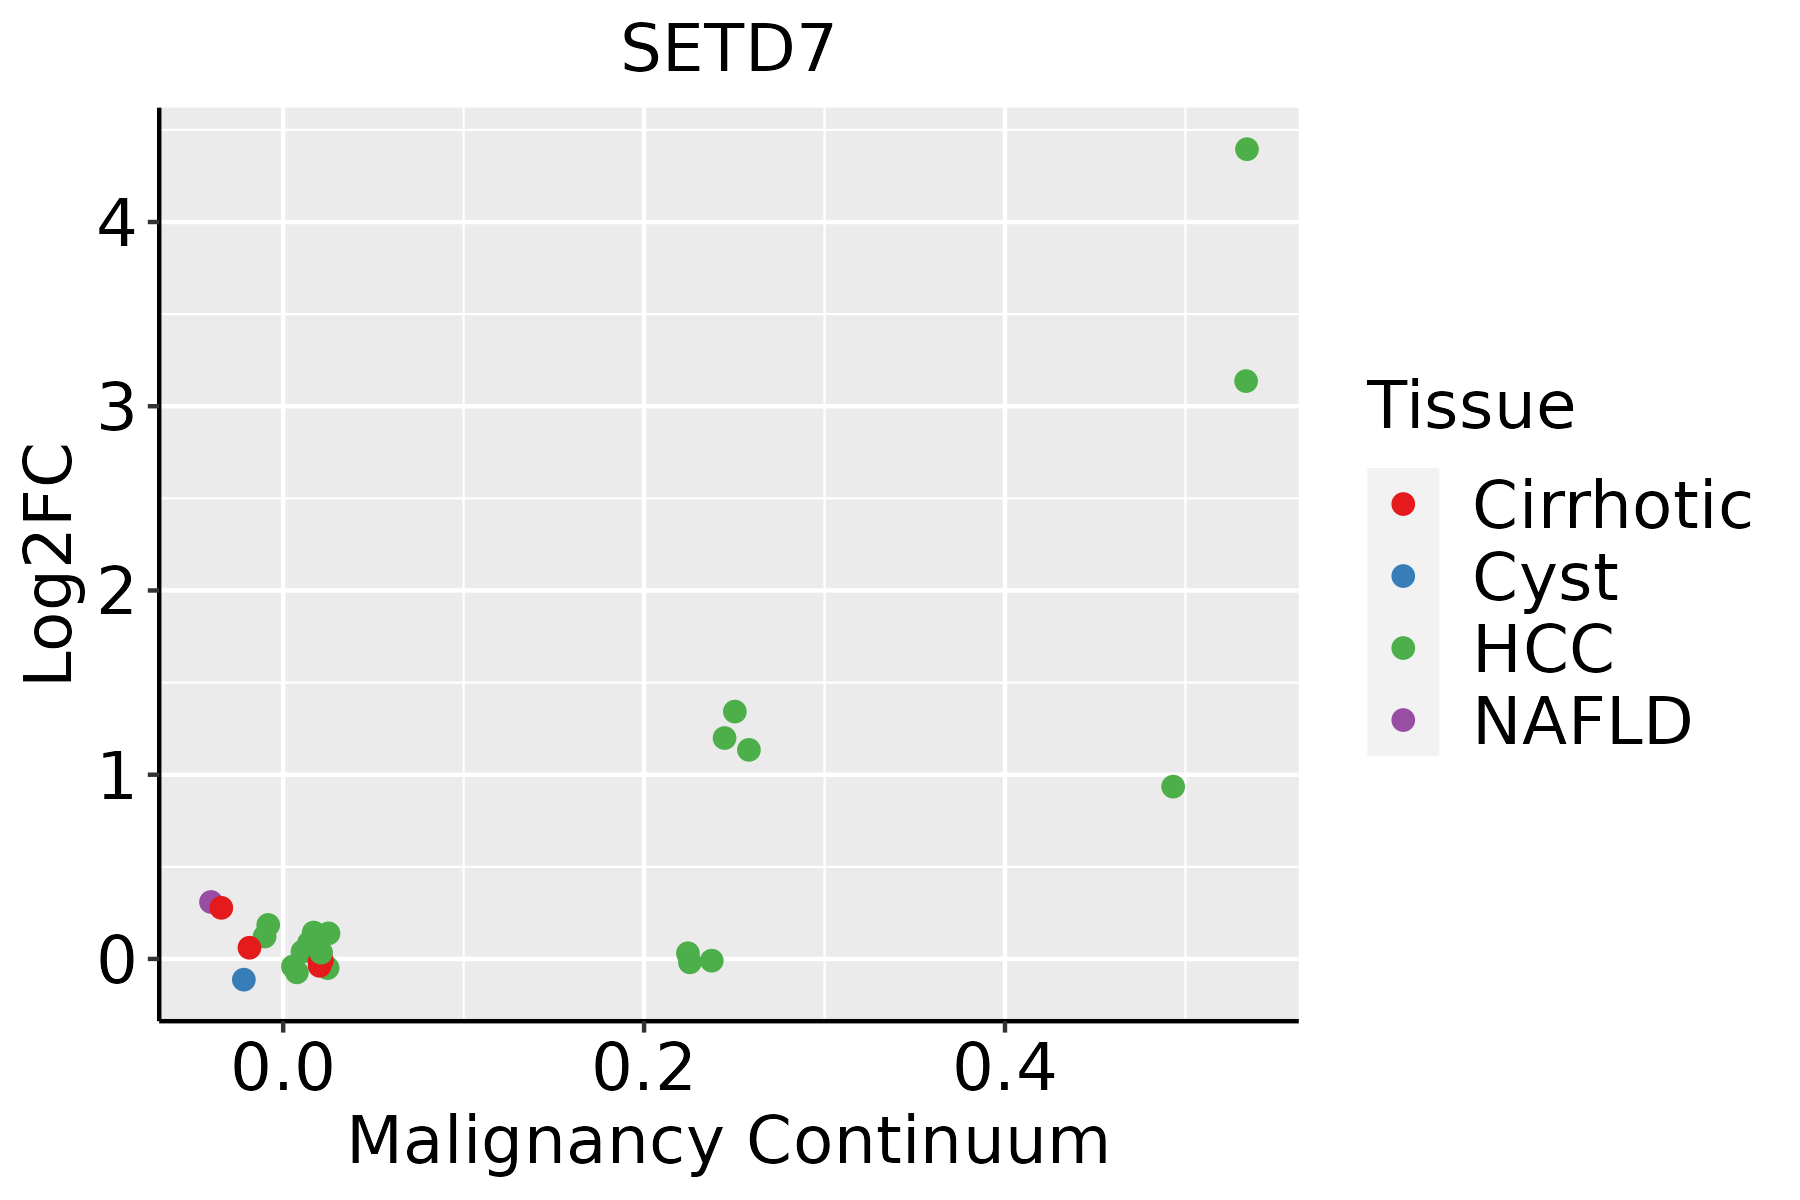 | HCC: Hepatocellular carcinoma |
| NAFLD: Non-alcoholic fatty liver disease | ||
| Prostate | 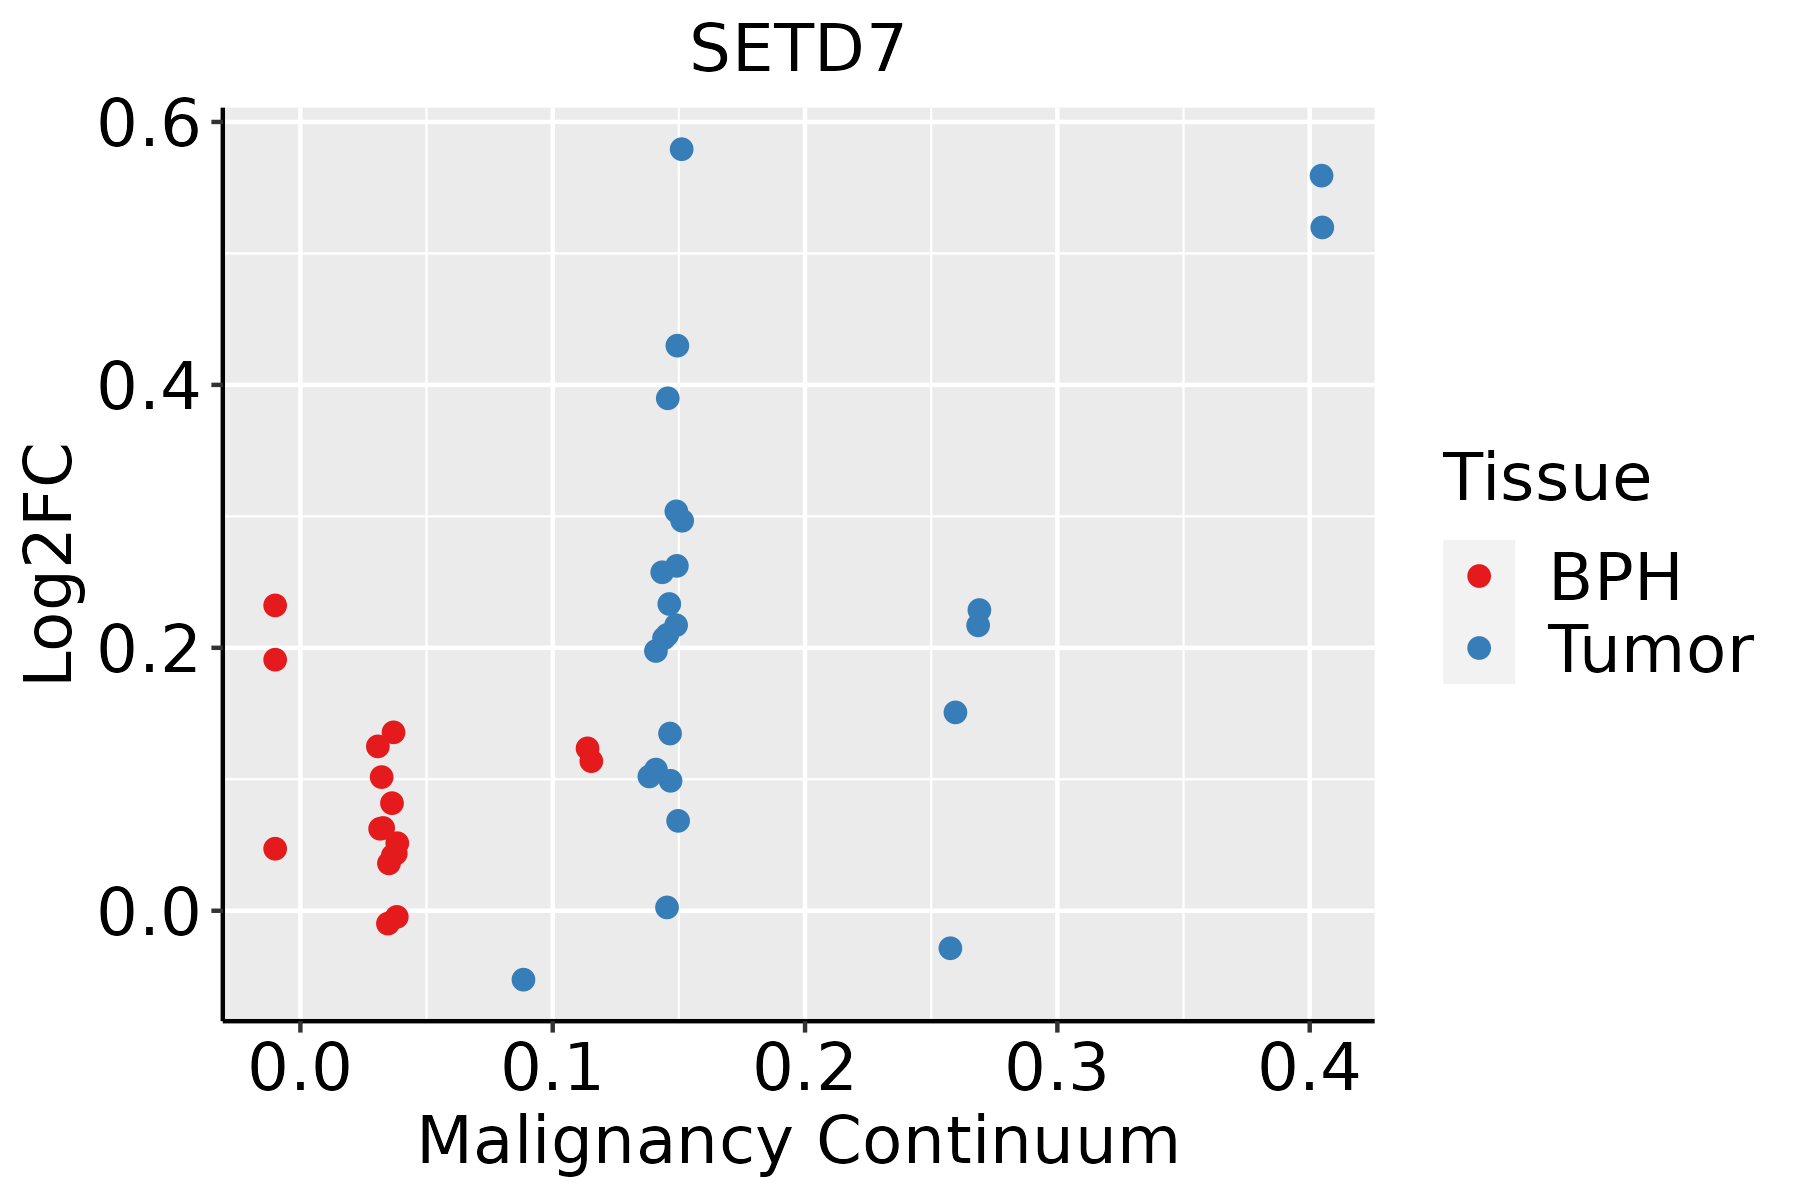 | BPH: Benign Prostatic Hyperplasia |
| ∗log2FC in expression of this searched gene in stem-like cells from each diseased tissue sample relative to stem-like cells in normal samples in each tissue plotted against the malignancy continuum. Samples are colored based on if they are from different disease stage. |
Top |
Malignant transformation related pathway analysis |
| Find out the enriched GO biological processes and KEGG pathways involved in transition from healthy to precancer to cancer |
| Tissue | Disease Stage | Enriched GO biological Processes |
| Colorectum | AD |  |
| Colorectum | SER |  |
| Colorectum | MSS |  |
| Colorectum | MSI-H |  |
| Colorectum | FAP |  |
| ∗Top 15 enriched GO BP terms are showed in the bar plot of each disease state in each tissue. Each row represents a significant GO biological process which is colored according to the -log10(p.adjust). |
| Page: 1 2 3 4 5 6 7 8 9 |
| GO ID | Tissue | Disease Stage | Description | Gene Ratio | Bg Ratio | pvalue | p.adjust | Count |
| GO:001657015 | Esophagus | ESCC | histone modification | 323/8552 | 463/18723 | 2.61e-26 | 7.88e-24 | 323 |
| GO:001820514 | Esophagus | ESCC | peptidyl-lysine modification | 259/8552 | 376/18723 | 3.90e-20 | 5.26e-18 | 259 |
| GO:00434143 | Esophagus | ESCC | macromolecule methylation | 199/8552 | 316/18723 | 3.44e-10 | 9.57e-09 | 199 |
| GO:003105614 | Esophagus | ESCC | regulation of histone modification | 106/8552 | 152/18723 | 1.52e-09 | 3.55e-08 | 106 |
| GO:00322592 | Esophagus | ESCC | methylation | 222/8552 | 364/18723 | 2.26e-09 | 5.09e-08 | 222 |
| GO:000632517 | Esophagus | ESCC | chromatin organization | 240/8552 | 409/18723 | 6.52e-08 | 1.14e-06 | 240 |
| GO:000647914 | Esophagus | ESCC | protein methylation | 115/8552 | 181/18723 | 9.07e-07 | 1.16e-05 | 115 |
| GO:000821314 | Esophagus | ESCC | protein alkylation | 115/8552 | 181/18723 | 9.07e-07 | 1.16e-05 | 115 |
| GO:00165718 | Esophagus | ESCC | histone methylation | 89/8552 | 141/18723 | 2.17e-05 | 1.87e-04 | 89 |
| GO:003496814 | Esophagus | ESCC | histone lysine methylation | 72/8552 | 115/18723 | 1.85e-04 | 1.18e-03 | 72 |
| GO:003106013 | Esophagus | ESCC | regulation of histone methylation | 46/8552 | 69/18723 | 3.46e-04 | 2.03e-03 | 46 |
| GO:001802214 | Esophagus | ESCC | peptidyl-lysine methylation | 79/8552 | 131/18723 | 5.17e-04 | 2.86e-03 | 79 |
| GO:00708281 | Esophagus | ESCC | heterochromatin organization | 31/8552 | 46/18723 | 2.42e-03 | 1.06e-02 | 31 |
| GO:0097305111 | Esophagus | ESCC | response to alcohol | 138/8552 | 253/18723 | 2.70e-03 | 1.14e-02 | 138 |
| GO:001657021 | Liver | HCC | histone modification | 283/7958 | 463/18723 | 2.68e-16 | 2.33e-14 | 283 |
| GO:00182052 | Liver | HCC | peptidyl-lysine modification | 230/7958 | 376/18723 | 1.51e-13 | 8.32e-12 | 230 |
| GO:003105621 | Liver | HCC | regulation of histone modification | 99/7958 | 152/18723 | 1.40e-08 | 3.40e-07 | 99 |
| GO:00434141 | Liver | HCC | macromolecule methylation | 183/7958 | 316/18723 | 2.00e-08 | 4.72e-07 | 183 |
| GO:0032259 | Liver | HCC | methylation | 206/7958 | 364/18723 | 3.35e-08 | 7.53e-07 | 206 |
| GO:00064792 | Liver | HCC | protein methylation | 111/7958 | 181/18723 | 2.36e-07 | 4.18e-06 | 111 |
| Page: 1 2 3 |
| Pathway ID | Tissue | Disease Stage | Description | Gene Ratio | Bg Ratio | pvalue | p.adjust | qvalue | Count |
| hsa040689 | Esophagus | ESCC | FoxO signaling pathway | 89/4205 | 131/8465 | 1.56e-05 | 7.98e-05 | 4.09e-05 | 89 |
| hsa0031010 | Esophagus | ESCC | Lysine degradation | 41/4205 | 63/8465 | 9.63e-03 | 2.27e-02 | 1.16e-02 | 41 |
| hsa0406814 | Esophagus | ESCC | FoxO signaling pathway | 89/4205 | 131/8465 | 1.56e-05 | 7.98e-05 | 4.09e-05 | 89 |
| hsa0031013 | Esophagus | ESCC | Lysine degradation | 41/4205 | 63/8465 | 9.63e-03 | 2.27e-02 | 1.16e-02 | 41 |
| hsa0031041 | Liver | HCC | Lysine degradation | 47/4020 | 63/8465 | 1.02e-05 | 7.58e-05 | 4.22e-05 | 47 |
| hsa040684 | Liver | HCC | FoxO signaling pathway | 85/4020 | 131/8465 | 3.99e-05 | 2.16e-04 | 1.20e-04 | 85 |
| hsa0031051 | Liver | HCC | Lysine degradation | 47/4020 | 63/8465 | 1.02e-05 | 7.58e-05 | 4.22e-05 | 47 |
| hsa040685 | Liver | HCC | FoxO signaling pathway | 85/4020 | 131/8465 | 3.99e-05 | 2.16e-04 | 1.20e-04 | 85 |
| hsa040687 | Prostate | BPH | FoxO signaling pathway | 54/1718 | 131/8465 | 3.05e-08 | 3.59e-07 | 2.22e-07 | 54 |
| hsa0406812 | Prostate | BPH | FoxO signaling pathway | 54/1718 | 131/8465 | 3.05e-08 | 3.59e-07 | 2.22e-07 | 54 |
| hsa0406822 | Prostate | Tumor | FoxO signaling pathway | 54/1791 | 131/8465 | 1.32e-07 | 1.51e-06 | 9.36e-07 | 54 |
| hsa0406832 | Prostate | Tumor | FoxO signaling pathway | 54/1791 | 131/8465 | 1.32e-07 | 1.51e-06 | 9.36e-07 | 54 |
| Page: 1 |
Top |
Cell-cell communication analysis |
| Identification of potential cell-cell interactions between two cell types and their ligand-receptor pairs for different disease states |
| Ligand | Receptor | LRpair | Pathway | Tissue | Disease Stage |
| Page: 1 |
Top |
Single-cell gene regulatory network inference analysis |
| Find out the significant the regulons (TFs) and the target genes of each regulon across cell types for different disease states |
| TF | Cell Type | Tissue | Disease Stage | Target Gene | RSS | Regulon Activity |
| ∗The dot plots of a searched regulon are shown for all cell subpopulations in each disease state of each tissue based on the regulon specific score inferred using pySCENIC and by calculating the average expression. |
| Page: 1 |
Top |
Somatic mutation of malignant transformation related genes |
| Annotation of somatic variants for genes involved in malignant transformation |
| Hugo Symbol | Variant Class | Variant Classification | dbSNP RS | HGVSc | HGVSp | HGVSp Short | SWISSPROT | BIOTYPE | SIFT | PolyPhen | Tumor Sample Barcode | Tissue | Histology | Sex | Age | Stage | Therapy Types | Drugs | Outcome |
| SETD7 | SNV | Missense_Mutation | c.16N>A | p.Glu6Lys | p.E6K | Q8WTS6 | protein_coding | tolerated(0.11) | benign(0.001) | TCGA-AC-A23H-01 | Breast | breast invasive carcinoma | Female | >=65 | I/II | Unknown | Unknown | PD | |
| SETD7 | SNV | Missense_Mutation | rs747992989 | c.52G>A | p.Asp18Asn | p.D18N | Q8WTS6 | protein_coding | deleterious(0.01) | benign(0.333) | TCGA-AN-A046-01 | Breast | breast invasive carcinoma | Female | >=65 | I/II | Unknown | Unknown | SD |
| SETD7 | SNV | Missense_Mutation | c.373N>A | p.Asp125Asn | p.D125N | Q8WTS6 | protein_coding | deleterious(0) | probably_damaging(0.99) | TCGA-AO-A03L-01 | Breast | breast invasive carcinoma | Female | <65 | III/IV | Chemotherapy | cyclophosphamide | SD | |
| SETD7 | SNV | Missense_Mutation | c.127N>A | p.Gly43Arg | p.G43R | Q8WTS6 | protein_coding | tolerated(0.05) | probably_damaging(0.988) | TCGA-AO-A128-01 | Breast | breast invasive carcinoma | Female | <65 | I/II | Chemotherapy | doxorubicin | SD | |
| SETD7 | SNV | Missense_Mutation | c.223N>T | p.Thr75Ser | p.T75S | Q8WTS6 | protein_coding | tolerated(0.06) | benign(0.255) | TCGA-D8-A1XG-01 | Breast | breast invasive carcinoma | Female | >=65 | III/IV | Unknown | Unknown | SD | |
| SETD7 | SNV | Missense_Mutation | novel | c.593C>T | p.Ser198Leu | p.S198L | Q8WTS6 | protein_coding | deleterious(0.02) | benign(0.072) | TCGA-PE-A5DE-01 | Breast | breast invasive carcinoma | Female | <65 | I/II | Chemotherapy | taxotere | CR |
| SETD7 | insertion | In_Frame_Ins | novel | c.905_906insTATGTTAATTTACTT | p.Asn302_Cys303insMetLeuIleTyrPhe | p.N302_C303insMLIYF | Q8WTS6 | protein_coding | TCGA-A8-A07G-01 | Breast | breast invasive carcinoma | Female | >=65 | I/II | Chemotherapy | 5-fluorouracil | CR | ||
| SETD7 | SNV | Missense_Mutation | rs750730311 | c.344N>A | p.Arg115His | p.R115H | Q8WTS6 | protein_coding | deleterious(0) | probably_damaging(0.998) | TCGA-AA-3877-01 | Colorectum | colon adenocarcinoma | Female | >=65 | I/II | Unknown | Unknown | SD |
| SETD7 | SNV | Missense_Mutation | novel | c.477N>G | p.Phe159Leu | p.F159L | Q8WTS6 | protein_coding | deleterious(0.01) | probably_damaging(0.986) | TCGA-AZ-4315-01 | Colorectum | colon adenocarcinoma | Male | <65 | I/II | Unknown | Unknown | SD |
| SETD7 | SNV | Missense_Mutation | novel | c.244N>A | p.Leu82Ile | p.L82I | Q8WTS6 | protein_coding | tolerated(0.21) | possibly_damaging(0.57) | TCGA-AG-A002-01 | Colorectum | rectum adenocarcinoma | Male | <65 | I/II | Unknown | Unknown | SD |
| Page: 1 2 3 4 5 |
Top |
Related drugs of malignant transformation related genes |
| Identification of chemicals and drugs interact with genes involved in malignant transfromation |
| (DGIdb 4.0) |
| Entrez ID | Symbol | Category | Interaction Types | Drug Claim Name | Drug Name | PMIDs |
| 80854 | SETD7 | ENZYME, METHYL TRANSFERASE | inhibitor | 249565915 | ||
| 80854 | SETD7 | ENZYME, METHYL TRANSFERASE | SINEFUNGIN | SINEFUNGIN | 23981144 | |
| 80854 | SETD7 | ENZYME, METHYL TRANSFERASE | EOSIN | EOSIN | 18348515 |
| Page: 1 |

Copyright 2023-Present -The University of Texas Health Science Center at Houston |