
|
|||||
|
 | |
| |
| |
| |
| |
| |
|
Gene: SETD6 |
Gene summary for SETD6 |
| Gene information | Species | Human | Gene symbol | SETD6 | Gene ID | 79918 |
| Gene name | SET domain containing 6, protein lysine methyltransferase | |
| Gene Alias | SETD6 | |
| Cytomap | 16q21 | |
| Gene Type | protein-coding | GO ID | GO:0006139 | UniProtAcc | Q8TBK2 |
Top |
Malignant transformation analysis |
| Identification of the aberrant gene expression in precancerous and cancerous lesions by comparing the gene expression of stem-like cells in diseased tissues with normal stem cells |
| Entrez ID | Symbol | Replicates | Species | Organ | Tissue | Adj P-value | Log2FC | Malignancy |
| 79918 | SETD6 | LZE4T | Human | Esophagus | ESCC | 1.49e-02 | 1.04e-01 | 0.0811 |
| 79918 | SETD6 | LZE24T | Human | Esophagus | ESCC | 3.08e-07 | 2.63e-01 | 0.0596 |
| 79918 | SETD6 | P1T-E | Human | Esophagus | ESCC | 1.85e-02 | 1.36e-01 | 0.0875 |
| 79918 | SETD6 | P2T-E | Human | Esophagus | ESCC | 4.73e-14 | 1.05e-01 | 0.1177 |
| 79918 | SETD6 | P4T-E | Human | Esophagus | ESCC | 4.45e-15 | 4.17e-01 | 0.1323 |
| 79918 | SETD6 | P5T-E | Human | Esophagus | ESCC | 4.78e-13 | 1.86e-01 | 0.1327 |
| 79918 | SETD6 | P8T-E | Human | Esophagus | ESCC | 3.26e-06 | 8.72e-02 | 0.0889 |
| 79918 | SETD6 | P9T-E | Human | Esophagus | ESCC | 1.94e-03 | 1.08e-01 | 0.1131 |
| 79918 | SETD6 | P10T-E | Human | Esophagus | ESCC | 2.17e-10 | 1.34e-01 | 0.116 |
| 79918 | SETD6 | P11T-E | Human | Esophagus | ESCC | 1.44e-06 | 2.46e-01 | 0.1426 |
| 79918 | SETD6 | P12T-E | Human | Esophagus | ESCC | 8.95e-08 | 1.50e-01 | 0.1122 |
| 79918 | SETD6 | P15T-E | Human | Esophagus | ESCC | 2.20e-17 | 1.72e-01 | 0.1149 |
| 79918 | SETD6 | P16T-E | Human | Esophagus | ESCC | 4.15e-15 | 2.10e-01 | 0.1153 |
| 79918 | SETD6 | P17T-E | Human | Esophagus | ESCC | 1.30e-03 | 1.42e-01 | 0.1278 |
| 79918 | SETD6 | P20T-E | Human | Esophagus | ESCC | 1.74e-11 | 3.10e-01 | 0.1124 |
| 79918 | SETD6 | P21T-E | Human | Esophagus | ESCC | 3.24e-11 | 2.38e-01 | 0.1617 |
| 79918 | SETD6 | P22T-E | Human | Esophagus | ESCC | 1.71e-23 | 3.24e-01 | 0.1236 |
| 79918 | SETD6 | P24T-E | Human | Esophagus | ESCC | 3.60e-13 | 2.06e-01 | 0.1287 |
| 79918 | SETD6 | P26T-E | Human | Esophagus | ESCC | 6.53e-10 | 1.75e-01 | 0.1276 |
| 79918 | SETD6 | P27T-E | Human | Esophagus | ESCC | 7.80e-06 | 1.10e-01 | 0.1055 |
| Page: 1 2 3 |
| Tissue | Expression Dynamics | Abbreviation |
| Esophagus | 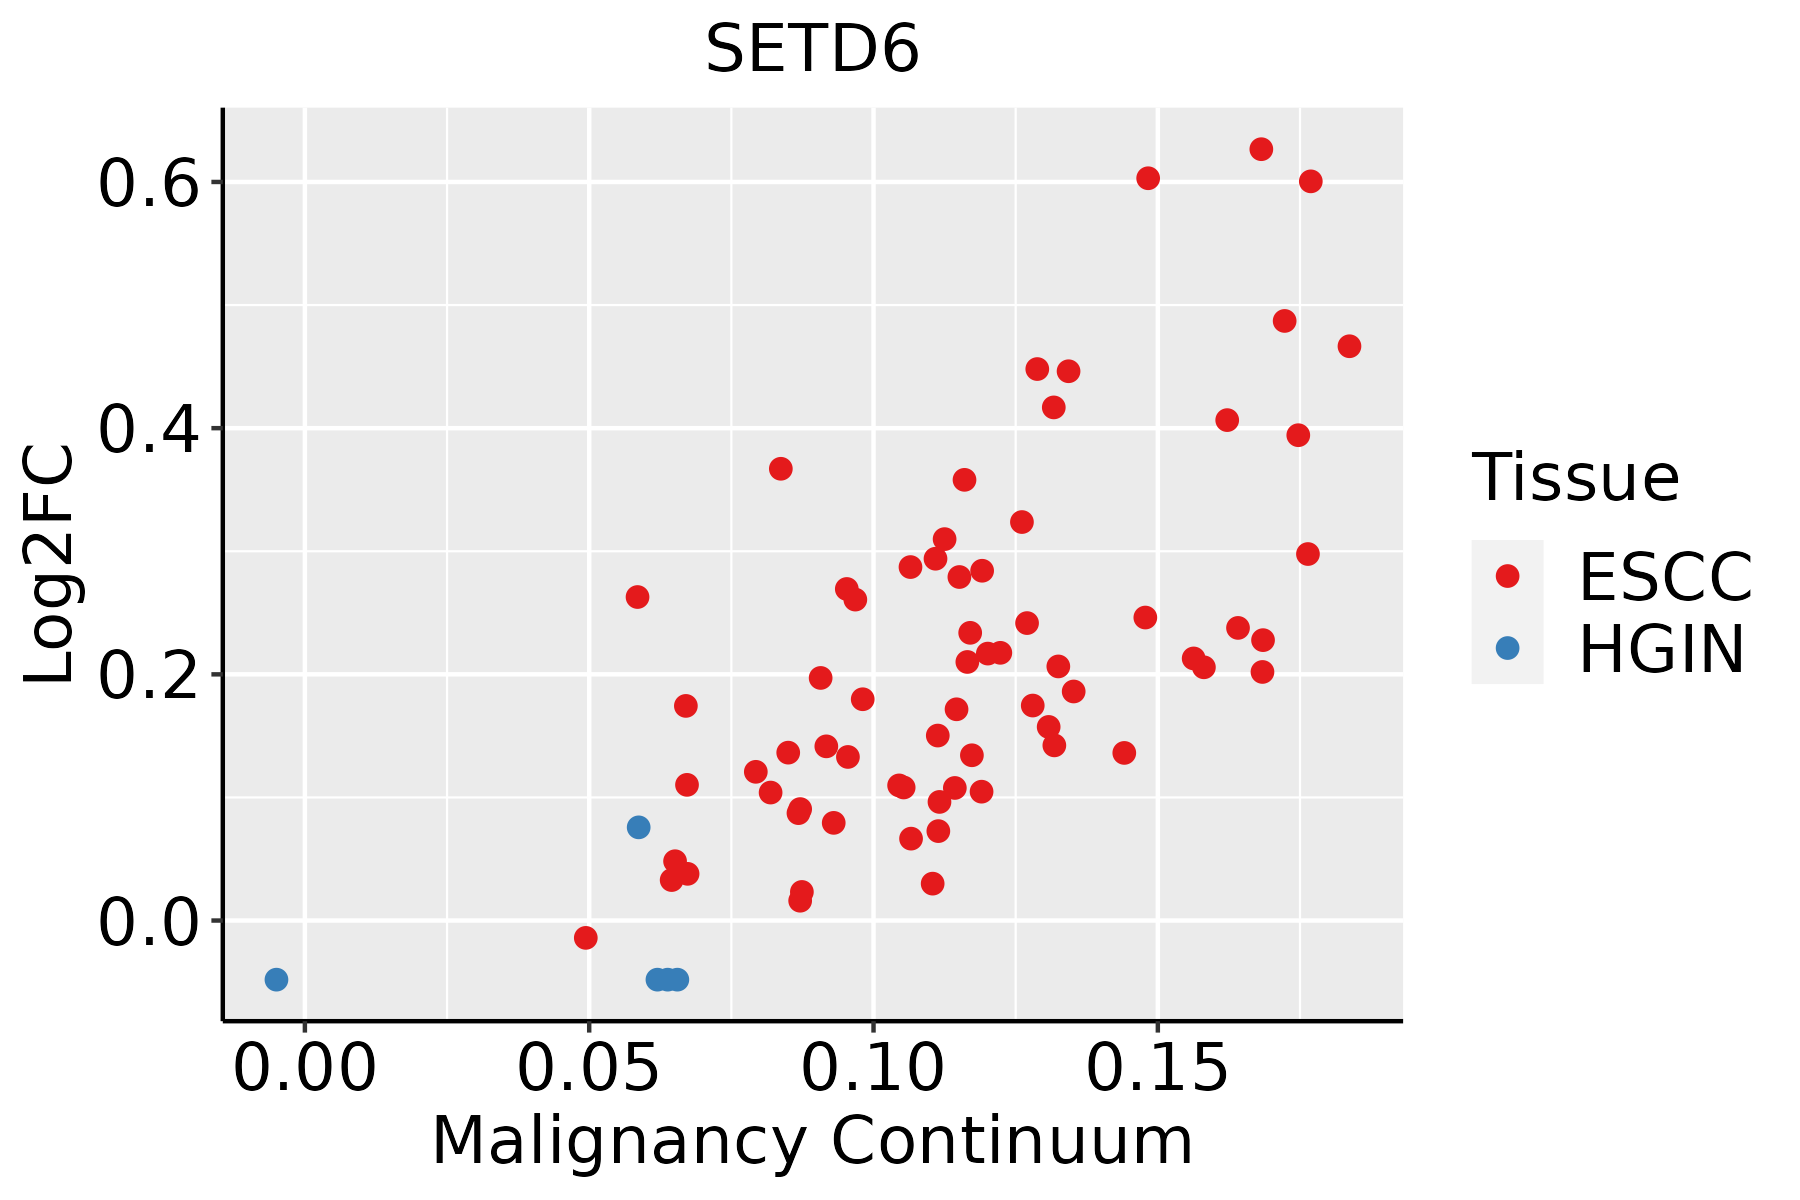 | ESCC: Esophageal squamous cell carcinoma |
| HGIN: High-grade intraepithelial neoplasias | ||
| LGIN: Low-grade intraepithelial neoplasias | ||
| Oral Cavity | 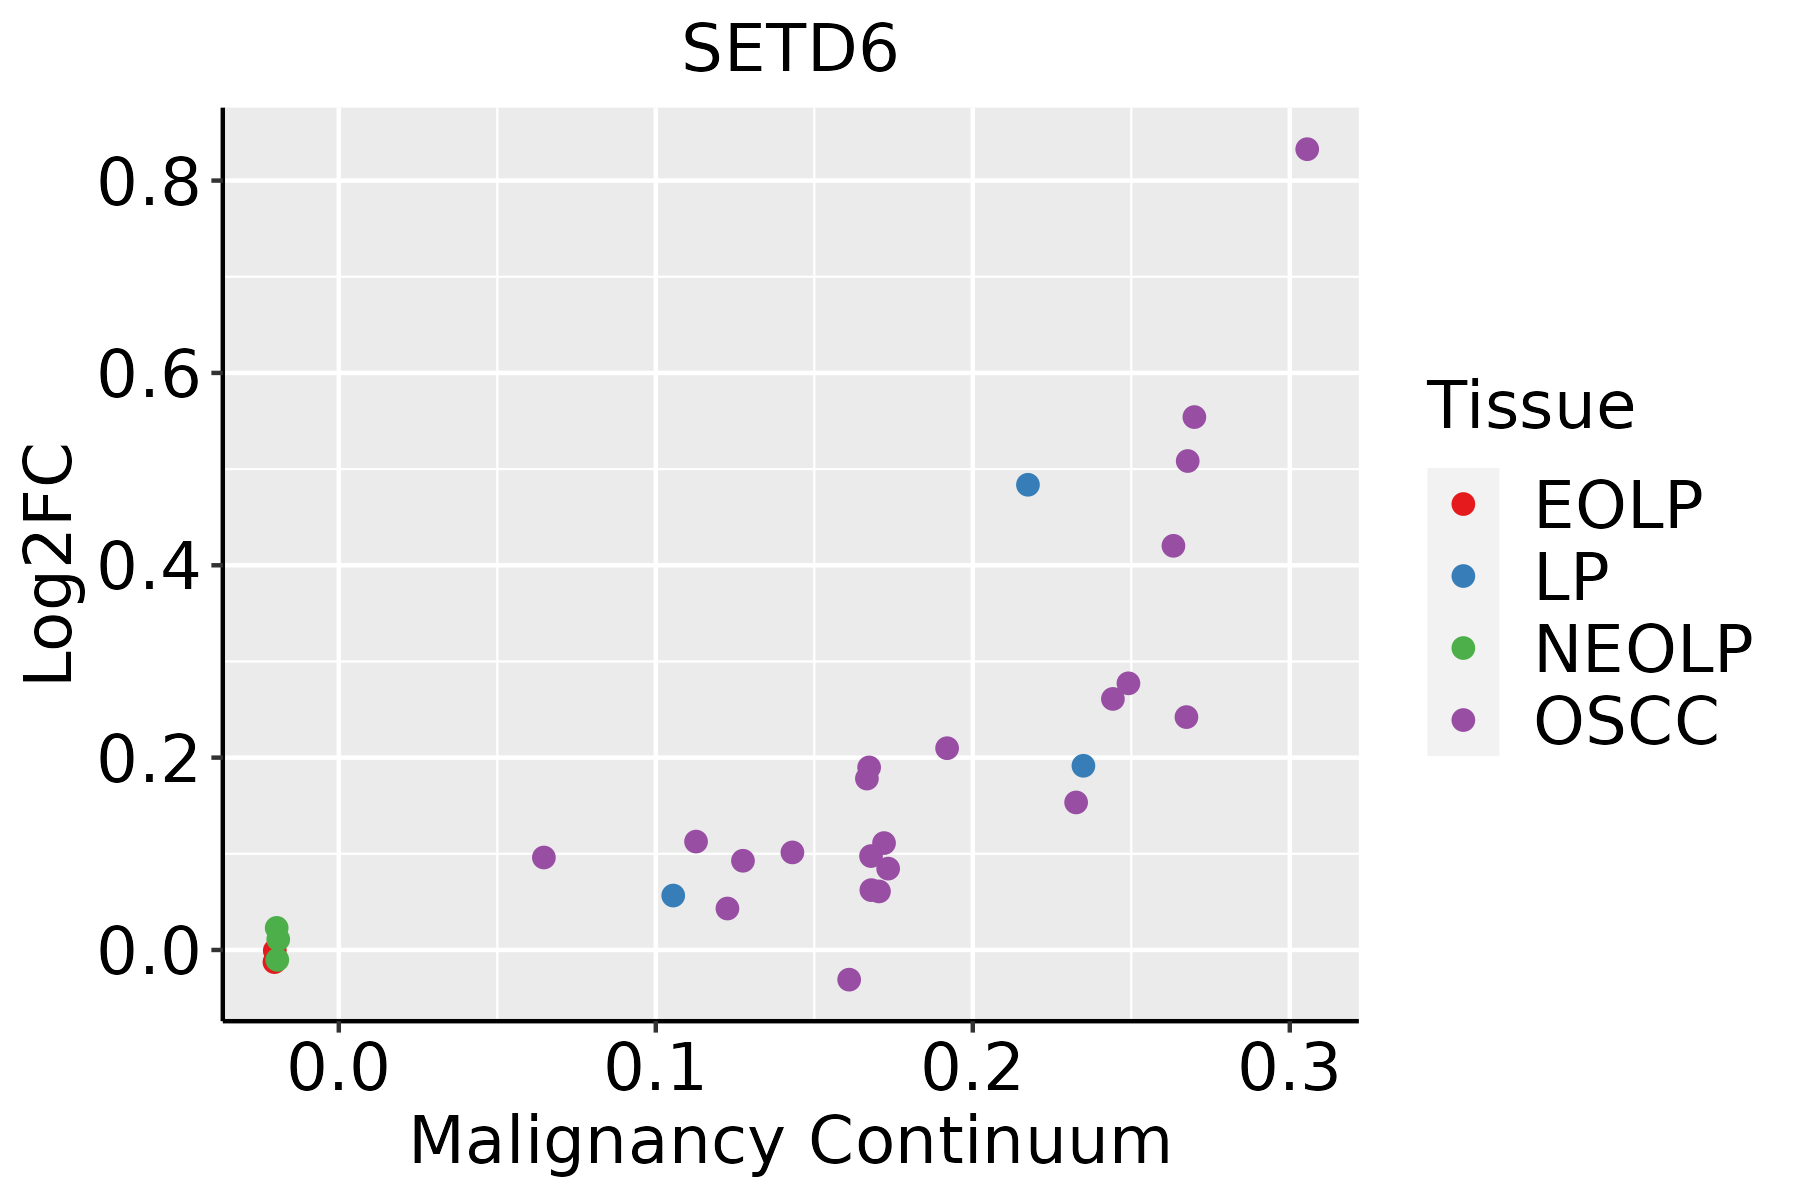 | EOLP: Erosive Oral lichen planus |
| LP: leukoplakia | ||
| NEOLP: Non-erosive oral lichen planus | ||
| OSCC: Oral squamous cell carcinoma |
| ∗log2FC in expression of this searched gene in stem-like cells from each diseased tissue sample relative to stem-like cells in normal samples in each tissue plotted against the malignancy continuum. Samples are colored based on if they are from different disease stage. |
Top |
Malignant transformation related pathway analysis |
| Find out the enriched GO biological processes and KEGG pathways involved in transition from healthy to precancer to cancer |
| Tissue | Disease Stage | Enriched GO biological Processes |
| Colorectum | AD |  |
| Colorectum | SER |  |
| Colorectum | MSS |  |
| Colorectum | MSI-H |  |
| Colorectum | FAP |  |
| ∗Top 15 enriched GO BP terms are showed in the bar plot of each disease state in each tissue. Each row represents a significant GO biological process which is colored according to the -log10(p.adjust). |
| Page: 1 2 3 4 5 6 7 8 9 |
| GO ID | Tissue | Disease Stage | Description | Gene Ratio | Bg Ratio | pvalue | p.adjust | Count |
| GO:001657015 | Esophagus | ESCC | histone modification | 323/8552 | 463/18723 | 2.61e-26 | 7.88e-24 | 323 |
| GO:001820514 | Esophagus | ESCC | peptidyl-lysine modification | 259/8552 | 376/18723 | 3.90e-20 | 5.26e-18 | 259 |
| GO:00434143 | Esophagus | ESCC | macromolecule methylation | 199/8552 | 316/18723 | 3.44e-10 | 9.57e-09 | 199 |
| GO:00322592 | Esophagus | ESCC | methylation | 222/8552 | 364/18723 | 2.26e-09 | 5.09e-08 | 222 |
| GO:009872714 | Esophagus | ESCC | maintenance of cell number | 90/8552 | 134/18723 | 3.94e-07 | 5.43e-06 | 90 |
| GO:00510908 | Esophagus | ESCC | regulation of DNA-binding transcription factor activity | 252/8552 | 440/18723 | 5.22e-07 | 6.97e-06 | 252 |
| GO:001982714 | Esophagus | ESCC | stem cell population maintenance | 88/8552 | 131/18723 | 5.23e-07 | 6.97e-06 | 88 |
| GO:000647914 | Esophagus | ESCC | protein methylation | 115/8552 | 181/18723 | 9.07e-07 | 1.16e-05 | 115 |
| GO:000821314 | Esophagus | ESCC | protein alkylation | 115/8552 | 181/18723 | 9.07e-07 | 1.16e-05 | 115 |
| GO:00165718 | Esophagus | ESCC | histone methylation | 89/8552 | 141/18723 | 2.17e-05 | 1.87e-04 | 89 |
| GO:00488638 | Esophagus | ESCC | stem cell differentiation | 122/8552 | 206/18723 | 5.95e-05 | 4.59e-04 | 122 |
| GO:003496814 | Esophagus | ESCC | histone lysine methylation | 72/8552 | 115/18723 | 1.85e-04 | 1.18e-03 | 72 |
| GO:001802214 | Esophagus | ESCC | peptidyl-lysine methylation | 79/8552 | 131/18723 | 5.17e-04 | 2.86e-03 | 79 |
| GO:00434332 | Esophagus | ESCC | negative regulation of DNA-binding transcription factor activity | 103/8552 | 185/18723 | 3.86e-03 | 1.57e-02 | 103 |
| GO:00320882 | Esophagus | ESCC | negative regulation of NF-kappaB transcription factor activity | 54/8552 | 93/18723 | 1.08e-02 | 3.67e-02 | 54 |
| GO:00165707 | Oral cavity | OSCC | histone modification | 270/7305 | 463/18723 | 1.59e-17 | 1.50e-15 | 270 |
| GO:00182056 | Oral cavity | OSCC | peptidyl-lysine modification | 216/7305 | 376/18723 | 2.32e-13 | 1.16e-11 | 216 |
| GO:00987277 | Oral cavity | OSCC | maintenance of cell number | 81/7305 | 134/18723 | 3.96e-07 | 5.90e-06 | 81 |
| GO:00198276 | Oral cavity | OSCC | stem cell population maintenance | 79/7305 | 131/18723 | 6.28e-07 | 8.96e-06 | 79 |
| GO:00510907 | Oral cavity | OSCC | regulation of DNA-binding transcription factor activity | 221/7305 | 440/18723 | 9.06e-07 | 1.23e-05 | 221 |
| Page: 1 2 |
| Pathway ID | Tissue | Disease Stage | Description | Gene Ratio | Bg Ratio | pvalue | p.adjust | qvalue | Count |
| Page: 1 |
Top |
Cell-cell communication analysis |
| Identification of potential cell-cell interactions between two cell types and their ligand-receptor pairs for different disease states |
| Ligand | Receptor | LRpair | Pathway | Tissue | Disease Stage |
| Page: 1 |
Top |
Single-cell gene regulatory network inference analysis |
| Find out the significant the regulons (TFs) and the target genes of each regulon across cell types for different disease states |
| TF | Cell Type | Tissue | Disease Stage | Target Gene | RSS | Regulon Activity |
| ∗The dot plots of a searched regulon are shown for all cell subpopulations in each disease state of each tissue based on the regulon specific score inferred using pySCENIC and by calculating the average expression. |
| Page: 1 |
Top |
Somatic mutation of malignant transformation related genes |
| Annotation of somatic variants for genes involved in malignant transformation |
| Hugo Symbol | Variant Class | Variant Classification | dbSNP RS | HGVSc | HGVSp | HGVSp Short | SWISSPROT | BIOTYPE | SIFT | PolyPhen | Tumor Sample Barcode | Tissue | Histology | Sex | Age | Stage | Therapy Types | Drugs | Outcome |
| SETD6 | SNV | Missense_Mutation | c.652N>C | p.Ala218Pro | p.A218P | Q8TBK2 | protein_coding | deleterious(0) | probably_damaging(0.997) | TCGA-D8-A142-01 | Breast | breast invasive carcinoma | Female | >=65 | I/II | Chemotherapy | cyclophosphamid | SD | |
| SETD6 | SNV | Missense_Mutation | rs767058417 | c.955C>T | p.Arg319Cys | p.R319C | Q8TBK2 | protein_coding | tolerated(0.19) | benign(0.031) | TCGA-AA-3510-01 | Colorectum | colon adenocarcinoma | Male | >=65 | I/II | Unknown | Unknown | SD |
| SETD6 | SNV | Missense_Mutation | novel | c.1019N>G | p.Asp340Gly | p.D340G | Q8TBK2 | protein_coding | tolerated(0.08) | possibly_damaging(0.626) | TCGA-AA-A01I-01 | Colorectum | colon adenocarcinoma | Male | >=65 | I/II | Unknown | Unknown | SD |
| SETD6 | SNV | Missense_Mutation | c.1013N>A | p.Arg338His | p.R338H | Q8TBK2 | protein_coding | deleterious(0) | probably_damaging(0.918) | TCGA-A5-A0GP-01 | Endometrium | uterine corpus endometrioid carcinoma | Female | <65 | I/II | Unknown | Unknown | SD | |
| SETD6 | SNV | Missense_Mutation | c.623N>A | p.Arg208His | p.R208H | Q8TBK2 | protein_coding | tolerated(1) | benign(0) | TCGA-AJ-A3BH-01 | Endometrium | uterine corpus endometrioid carcinoma | Female | Unknown | I/II | Unknown | Unknown | SD | |
| SETD6 | SNV | Missense_Mutation | rs150559584 | c.1012N>T | p.Arg338Cys | p.R338C | Q8TBK2 | protein_coding | deleterious(0) | probably_damaging(0.918) | TCGA-AJ-A3EK-01 | Endometrium | uterine corpus endometrioid carcinoma | Female | <65 | I/II | Chemotherapy | carboplatin | CR |
| SETD6 | SNV | Missense_Mutation | c.563A>G | p.Tyr188Cys | p.Y188C | Q8TBK2 | protein_coding | deleterious(0) | probably_damaging(0.998) | TCGA-AP-A051-01 | Endometrium | uterine corpus endometrioid carcinoma | Female | >=65 | I/II | Unknown | Unknown | SD | |
| SETD6 | SNV | Missense_Mutation | rs372232329 | c.802N>T | p.Arg268Trp | p.R268W | Q8TBK2 | protein_coding | deleterious(0) | probably_damaging(0.983) | TCGA-AP-A056-01 | Endometrium | uterine corpus endometrioid carcinoma | Female | <65 | I/II | Unknown | Unknown | SD |
| SETD6 | SNV | Missense_Mutation | novel | c.740C>T | p.Ala247Val | p.A247V | Q8TBK2 | protein_coding | deleterious(0) | probably_damaging(0.993) | TCGA-AP-A1DH-01 | Endometrium | uterine corpus endometrioid carcinoma | Female | <65 | I/II | Unknown | Unknown | SD |
| SETD6 | SNV | Missense_Mutation | rs372232329 | c.802C>T | p.Arg268Trp | p.R268W | Q8TBK2 | protein_coding | deleterious(0) | probably_damaging(0.983) | TCGA-AP-A1E0-01 | Endometrium | uterine corpus endometrioid carcinoma | Female | <65 | III/IV | Chemotherapy | paclitaxel | SD |
| Page: 1 2 3 |
Top |
Related drugs of malignant transformation related genes |
| Identification of chemicals and drugs interact with genes involved in malignant transfromation |
| (DGIdb 4.0) |
| Entrez ID | Symbol | Category | Interaction Types | Drug Claim Name | Drug Name | PMIDs |
| Page: 1 |

Copyright 2023-Present -The University of Texas Health Science Center at Houston |