Schematic overview of the cellular and molecular mechanisms involved in the cancer progression, including the proposed cellular and molecular mechanisms in cancer cells trajectory. AT1: alveolar type 1 cells; AT2: alveolar type 2 cells; AAH: atypical adenomatous hyperplasia; AIS: adenocarcinoma in situ; MIA: minimally invasive adenocarcinoma; IA: invasive adenocarcinoma; EMT: epithelial-mesenchymal transition

Home

Download

Statistics

Help

Contact

Center for Computational Systems Medicine
leaf

Gene summary

leaf

Malignant transformation analysis

leaf

Malignant transformation related pathway analysis

leaf

Cell-cell communication analysis

leaf

Single-cell gene regulatory network inference analysis

leaf

Somatic mutation of malignant transformation related genes

leaf

Related drugs of malignant transformation related genes

Gene: SETD5

Gene summary for SETD5

check button Gene summary.

Gene informationSpeciesHuman
Gene symbol

SETD5

Gene ID

55209

Gene nameSET domain containing 5
Gene AliasSETD5
Cytomap3p25.3
Gene Typeprotein-coding
GO ID

GO:0003008

UniProtAcc

Q9C0A6


Top

Malignant transformation analysis

check button Identification of the aberrant gene expression in precancerous and cancerous lesions by comparing the gene expression of stem-like cells in diseased tissues with normal stem cells
check button Malignant transformation involving gene list.
Entrez IDSymbolReplicatesSpeciesOrganTissueAdj P-valueLog2FCMalignancy
55209SETD5CCI_1HumanCervixCC8.54e-046.40e-010.528
55209SETD5CCI_2HumanCervixCC2.17e-099.68e-010.5249
55209SETD5CCI_3HumanCervixCC3.27e-129.17e-010.516
55209SETD5HTA11_1938_2000001011HumanColorectumAD5.08e-055.03e-01-0.0811
55209SETD5HTA11_347_2000001011HumanColorectumAD6.56e-095.77e-01-0.1954
55209SETD5HTA11_1391_2000001011HumanColorectumAD7.40e-076.34e-01-0.059
55209SETD5HTA11_5212_2000001011HumanColorectumAD2.71e-02-3.97e-01-0.2061
55209SETD5HTA11_7663_2000001011HumanColorectumSER1.01e-036.33e-010.0131
55209SETD5HTA11_6818_2000001021HumanColorectumAD2.59e-086.23e-010.0588
55209SETD5HTA11_99999970781_79442HumanColorectumMSS1.45e-096.49e-010.294
55209SETD5HTA11_99999965062_69753HumanColorectumMSI-H8.62e-161.23e+000.3487
55209SETD5HTA11_99999965104_69814HumanColorectumMSS7.75e-147.88e-010.281
55209SETD5HTA11_99999971662_82457HumanColorectumMSS1.88e-099.20e-010.3859
55209SETD5F007HumanColorectumFAP1.19e-02-2.00e-010.1176
55209SETD5A001-C-207HumanColorectumFAP5.94e-03-1.66e-010.1278
55209SETD5A015-C-203HumanColorectumFAP2.92e-36-4.04e-01-0.1294
55209SETD5A015-C-204HumanColorectumFAP2.17e-05-1.91e-01-0.0228
55209SETD5A014-C-040HumanColorectumFAP2.12e-05-1.59e-01-0.1184
55209SETD5A002-C-201HumanColorectumFAP9.70e-14-2.93e-010.0324
55209SETD5A001-C-119HumanColorectumFAP3.03e-06-3.38e-01-0.1557
Page: 1 2 3 4 5 6 7 8 9 10 11 

check button Transcriptomic changes along malignancy continuum.
TissueExpression DynamicsAbbreviation
CervixThe image shows the transcriptomic changes along malignancy continuum.log2FC in expression of this searched gene in stem-like cells from each diseased tissue sample relative to stem-like cells in normal samples in each tissue plotted against the malignancy continuum. Samples are colored based on if they are from different disease stage.CC: Cervix cancer
HSIL_HPV: HPV-infected high-grade squamous intraepithelial lesions
N_HPV: HPV-infected normal cervix
Colorectum (GSE201348)The image shows the transcriptomic changes along malignancy continuum.log2FC in expression of this searched gene in stem-like cells from each diseased tissue sample relative to stem-like cells in normal samples in each tissue plotted against the malignancy continuum. Samples are colored based on if they are from different disease stage.FAP: Familial adenomatous polyposis
CRC: Colorectal cancer
Colorectum (HTA11)The image shows the transcriptomic changes along malignancy continuum.log2FC in expression of this searched gene in stem-like cells from each diseased tissue sample relative to stem-like cells in normal samples in each tissue plotted against the malignancy continuum. Samples are colored based on if they are from different disease stage.AD: Adenomas
SER: Sessile serrated lesions
MSI-H: Microsatellite-high colorectal cancer
MSS: Microsatellite stable colorectal cancer
EsophagusThe image shows the transcriptomic changes along malignancy continuum.log2FC in expression of this searched gene in stem-like cells from each diseased tissue sample relative to stem-like cells in normal samples in each tissue plotted against the malignancy continuum. Samples are colored based on if they are from different disease stage.
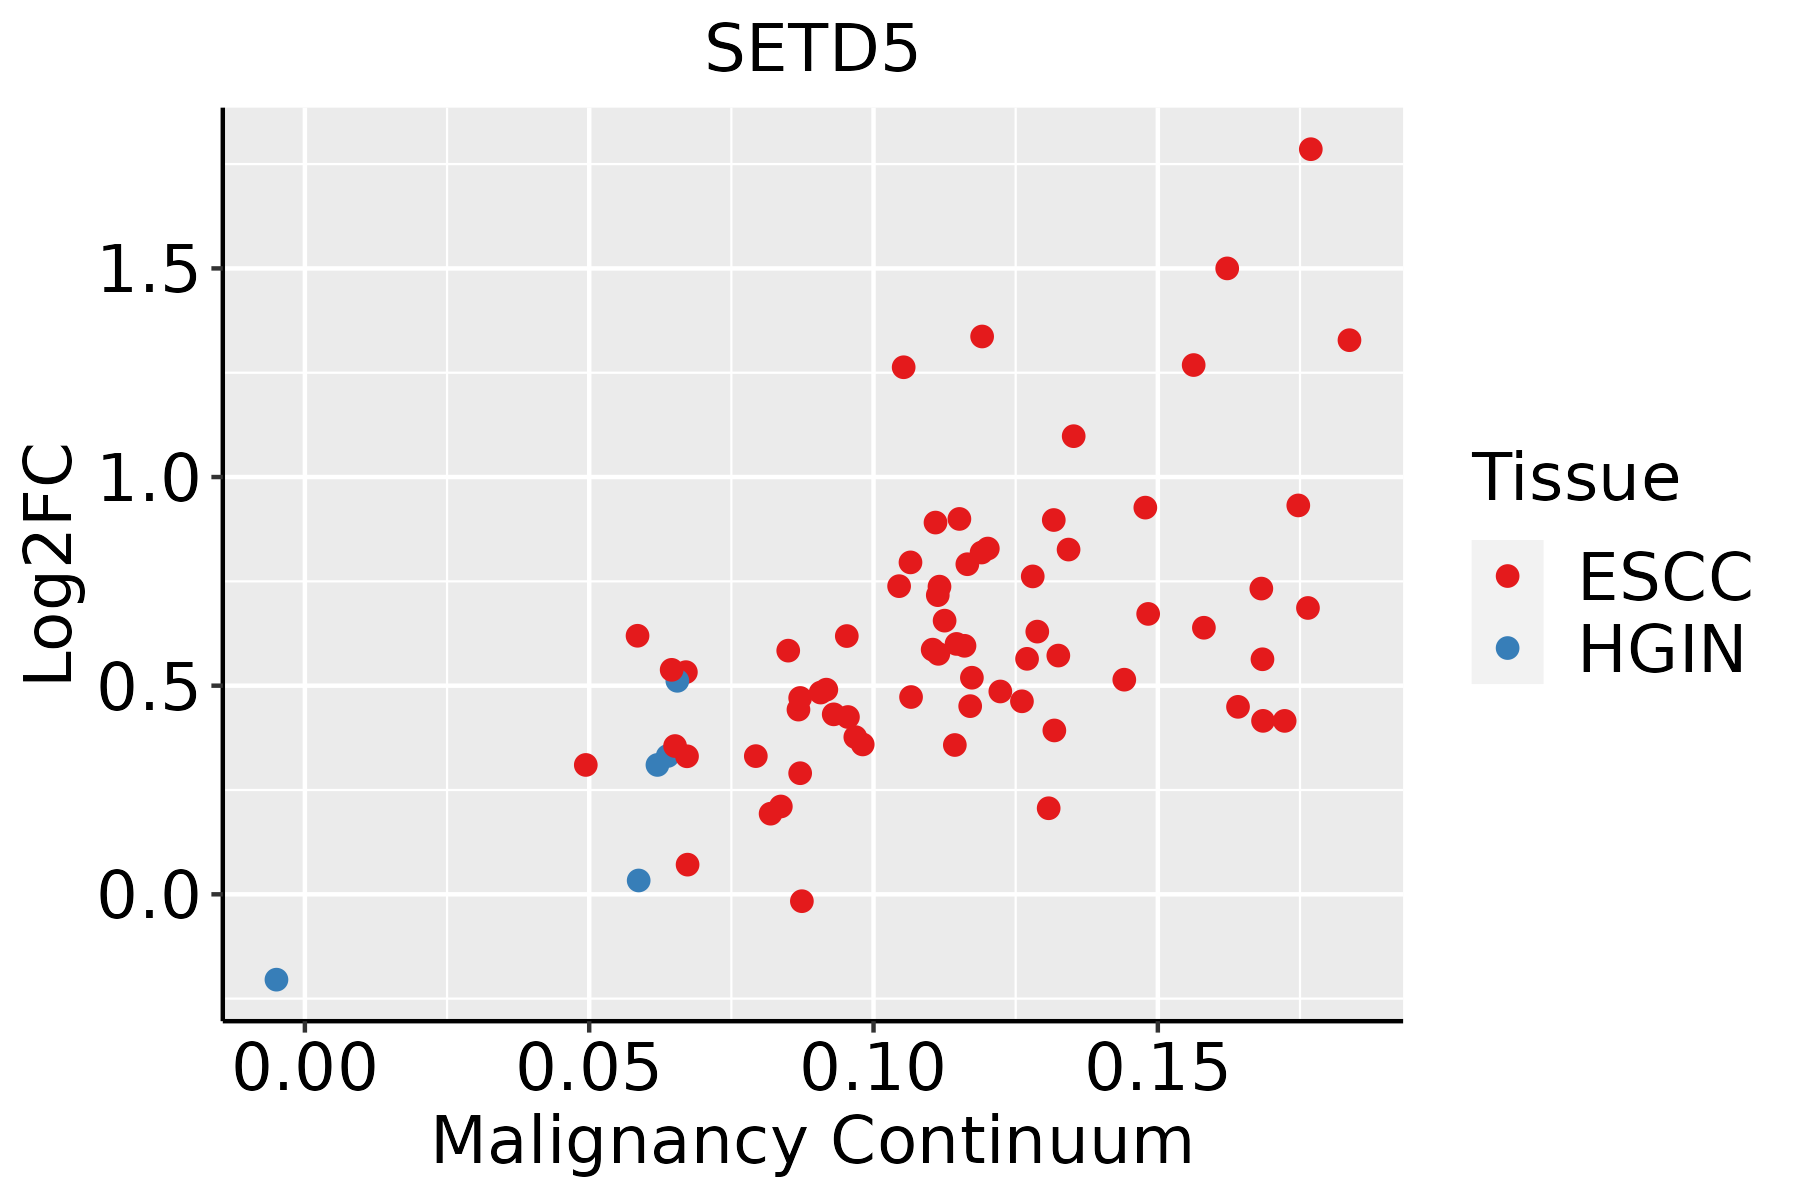
ESCC: Esophageal squamous cell carcinoma
HGIN: High-grade intraepithelial neoplasias
LGIN: Low-grade intraepithelial neoplasias
LiverThe image shows the transcriptomic changes along malignancy continuum.log2FC in expression of this searched gene in stem-like cells from each diseased tissue sample relative to stem-like cells in normal samples in each tissue plotted against the malignancy continuum. Samples are colored based on if they are from different disease stage.
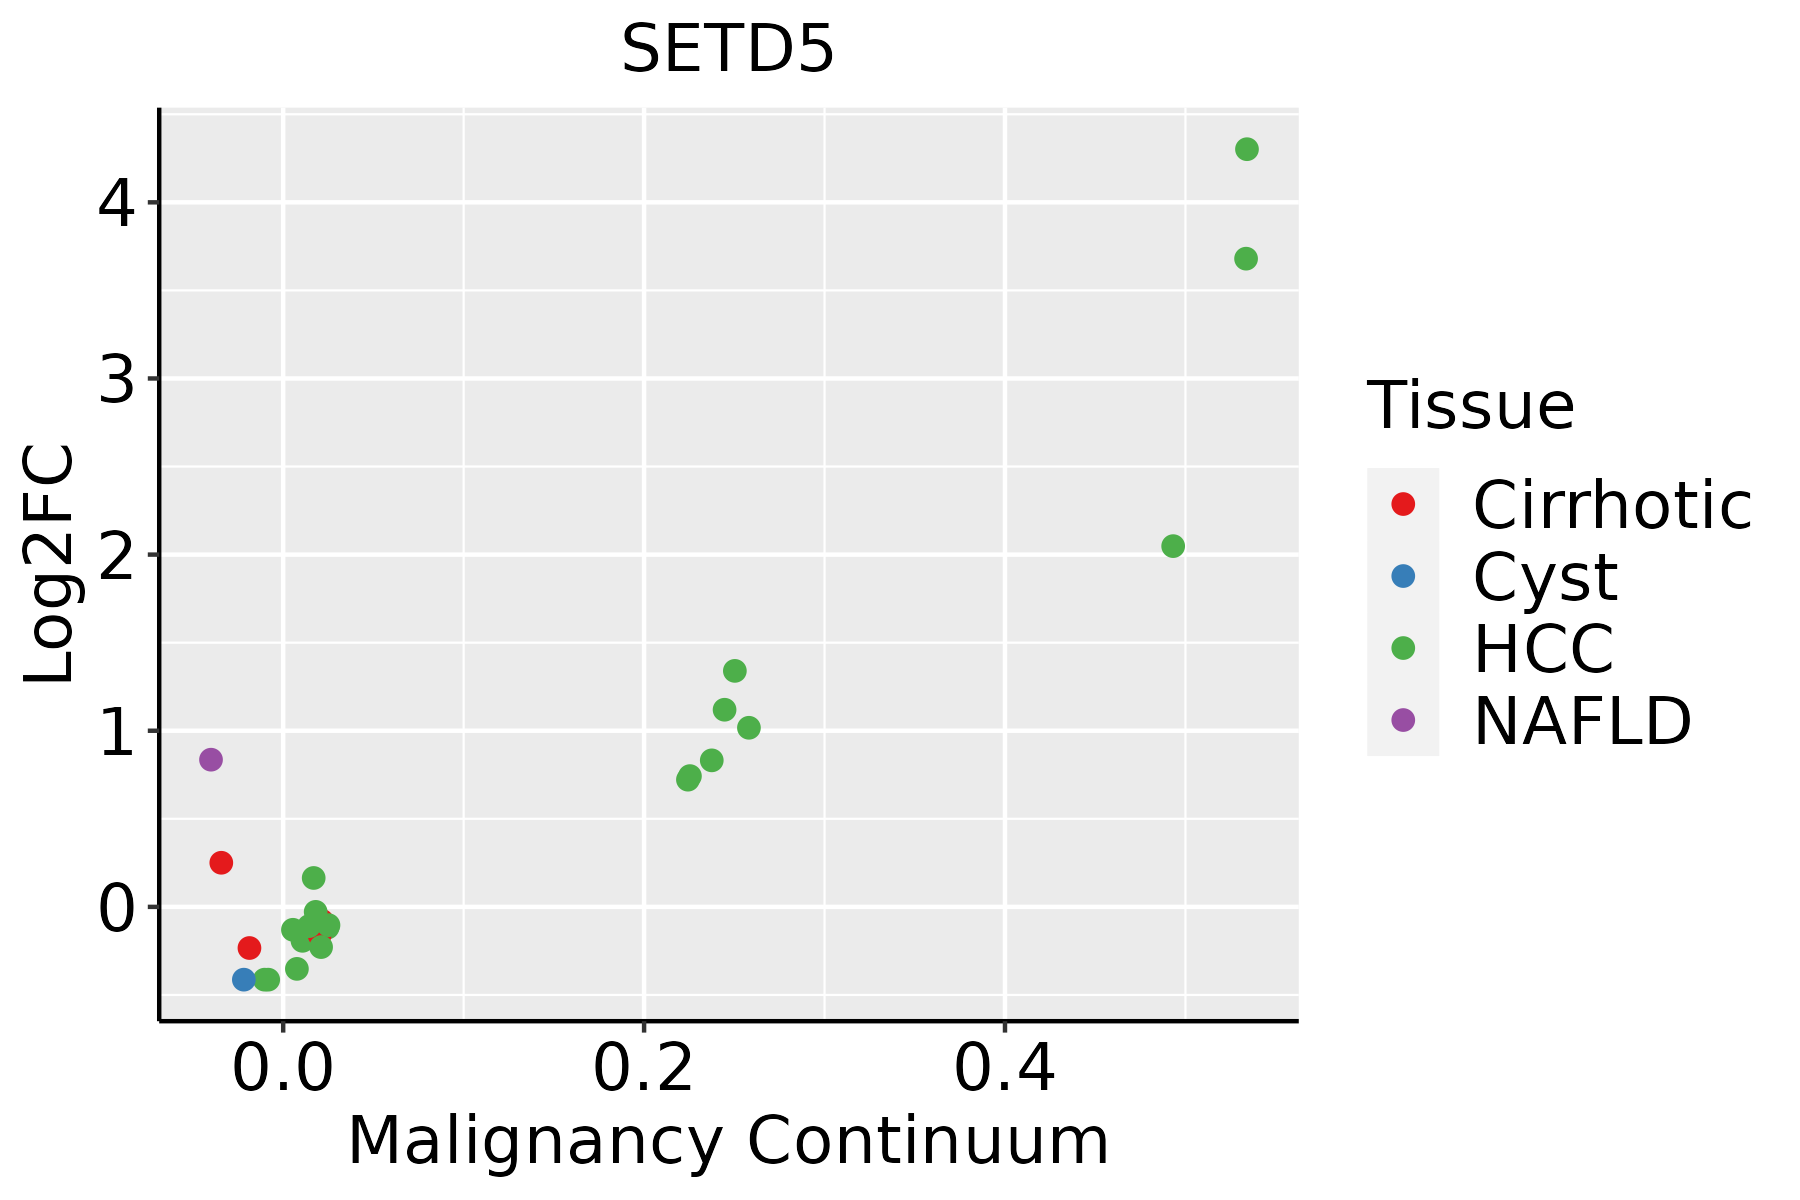
HCC: Hepatocellular carcinoma
NAFLD: Non-alcoholic fatty liver disease
LungThe image shows the transcriptomic changes along malignancy continuum.log2FC in expression of this searched gene in stem-like cells from each diseased tissue sample relative to stem-like cells in normal samples in each tissue plotted against the malignancy continuum. Samples are colored based on if they are from different disease stage.
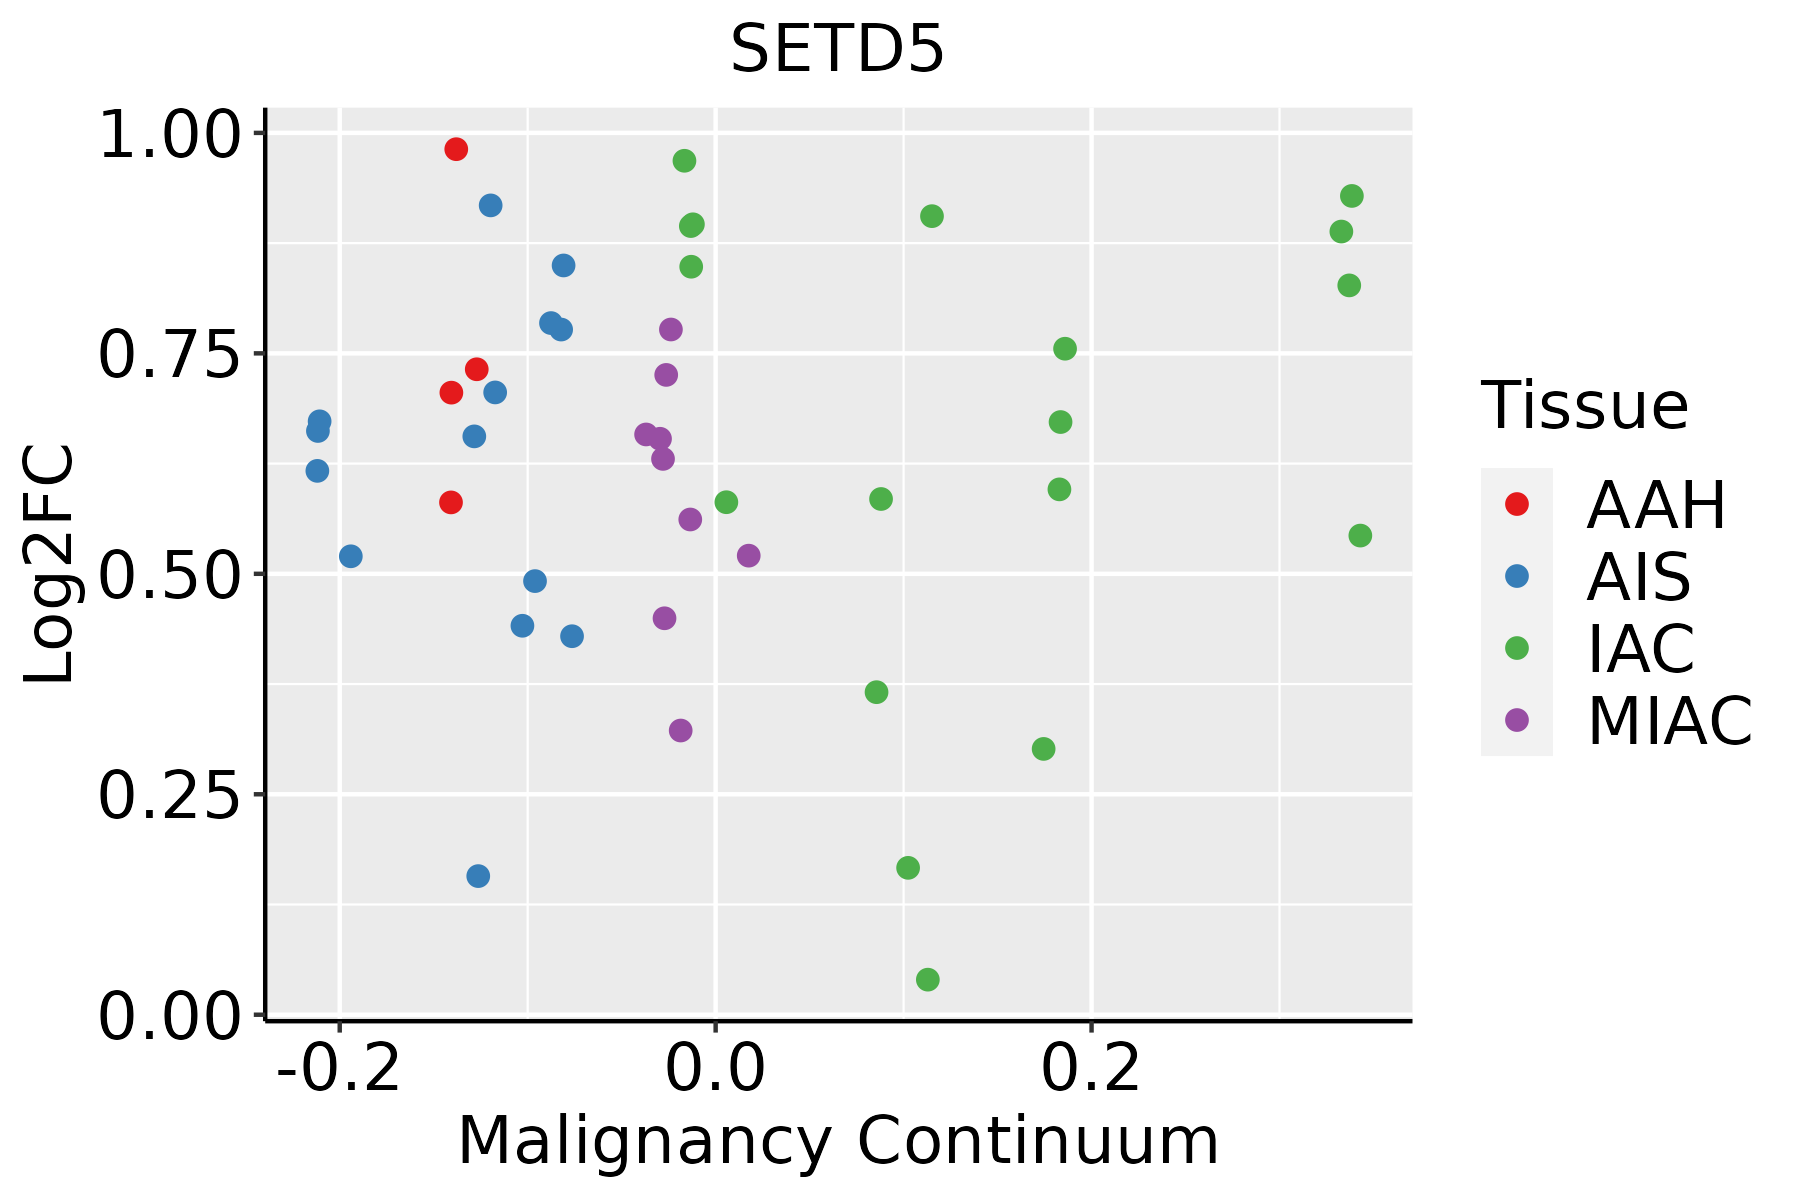
AAH: Atypical adenomatous hyperplasia
AIS: Adenocarcinoma in situ
IAC: Invasive lung adenocarcinoma
MIA: Minimally invasive adenocarcinoma
Oral CavityThe image shows the transcriptomic changes along malignancy continuum.log2FC in expression of this searched gene in stem-like cells from each diseased tissue sample relative to stem-like cells in normal samples in each tissue plotted against the malignancy continuum. Samples are colored based on if they are from different disease stage.
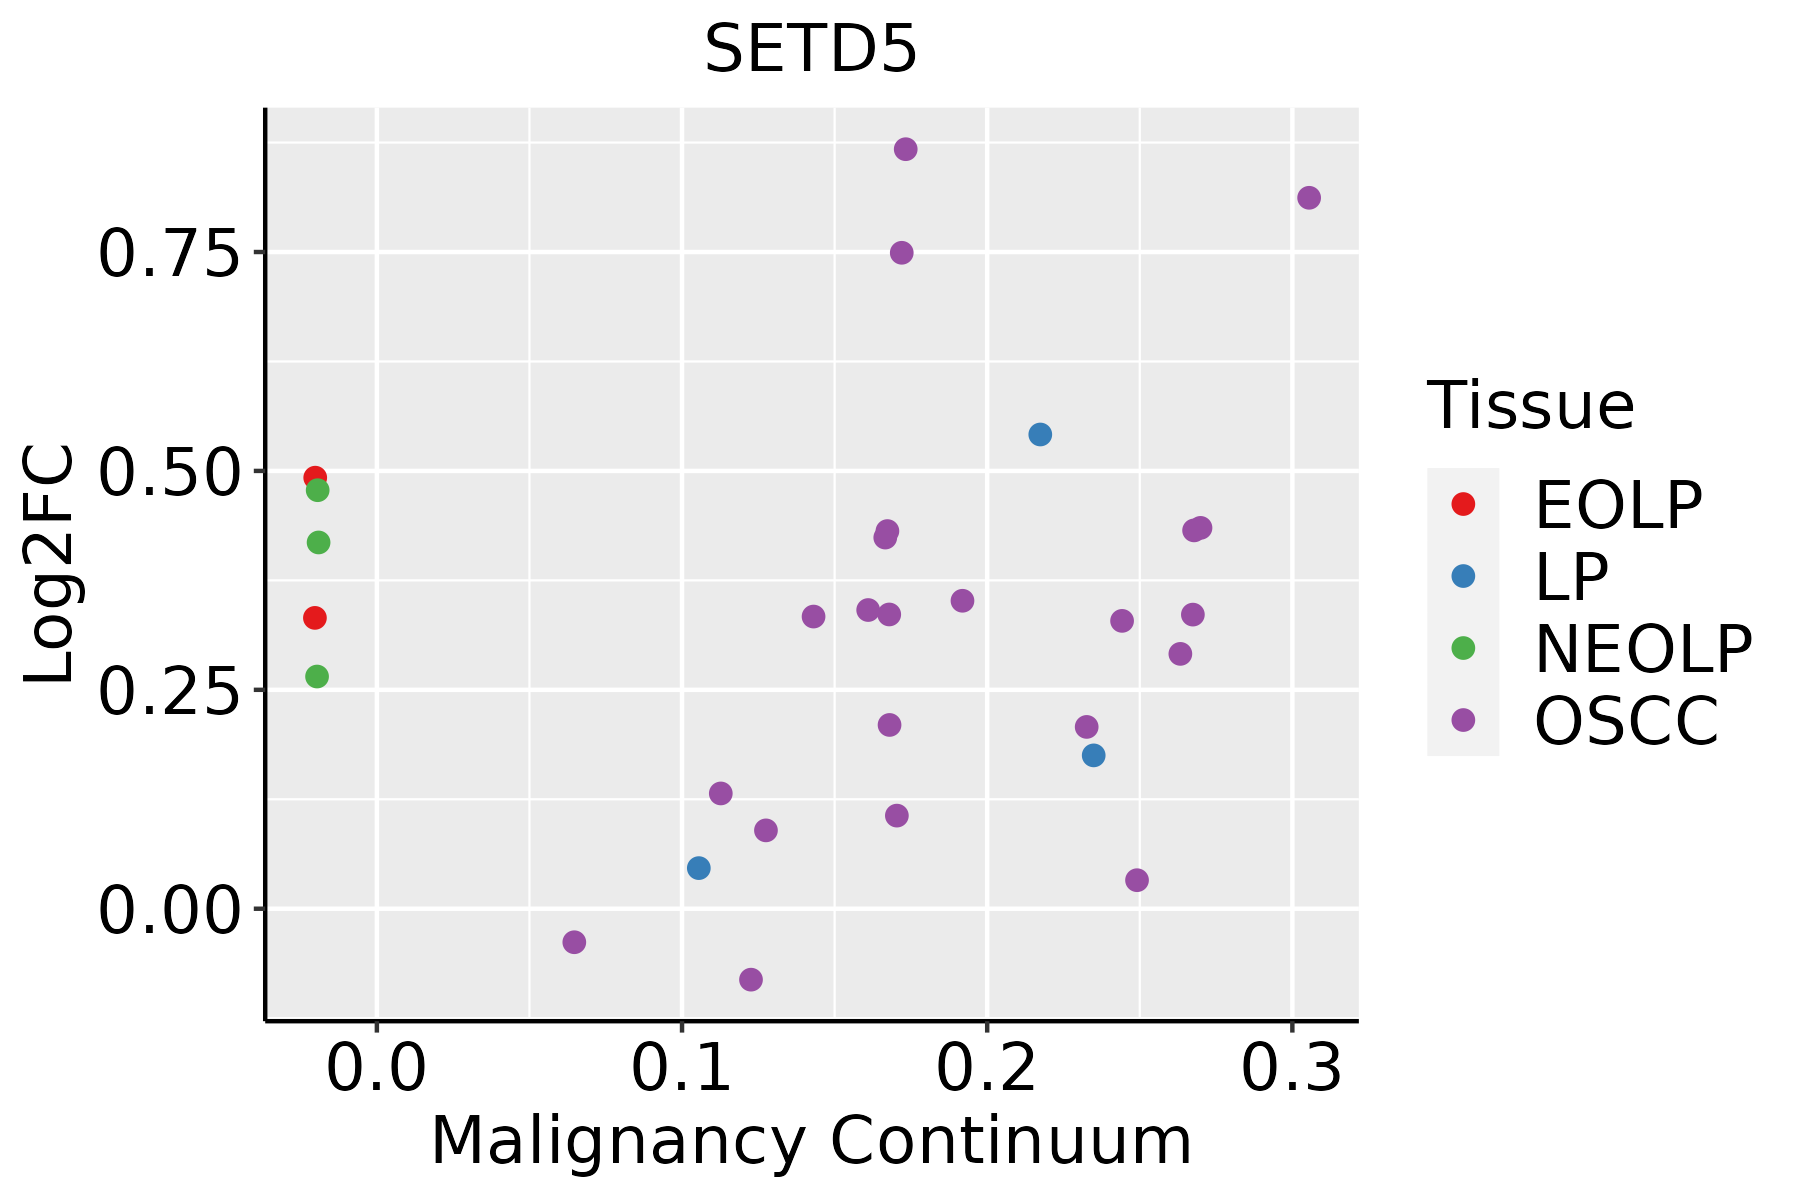
EOLP: Erosive Oral lichen planus
LP: leukoplakia
NEOLP: Non-erosive oral lichen planus
OSCC: Oral squamous cell carcinoma
ProstateThe image shows the transcriptomic changes along malignancy continuum.log2FC in expression of this searched gene in stem-like cells from each diseased tissue sample relative to stem-like cells in normal samples in each tissue plotted against the malignancy continuum. Samples are colored based on if they are from different disease stage.BPH: Benign Prostatic Hyperplasia
SkinThe image shows the transcriptomic changes along malignancy continuum.log2FC in expression of this searched gene in stem-like cells from each diseased tissue sample relative to stem-like cells in normal samples in each tissue plotted against the malignancy continuum. Samples are colored based on if they are from different disease stage.AK: Actinic keratosis
cSCC: Cutaneous squamous cell carcinoma
SCCIS:squamous cell carcinoma in situ
ThyroidThe image shows the transcriptomic changes along malignancy continuum.log2FC in expression of this searched gene in stem-like cells from each diseased tissue sample relative to stem-like cells in normal samples in each tissue plotted against the malignancy continuum. Samples are colored based on if they are from different disease stage.ATC: Anaplastic thyroid cancer
HT: Hashimoto's thyroiditis
PTC: Papillary thyroid cancer
∗log2FC in expression of this searched gene in stem-like cells from each diseased tissue sample relative to stem-like cells in normal samples in each tissue plotted against the malignancy continuum. Samples are colored based on if they are from different disease stage.

Top

Malignant transformation related pathway analysis

check buttonFind out the enriched GO biological processes and KEGG pathways involved in transition from healthy to precancer to cancer
check button Figure of enriched GO biological processes.
TissueDisease StageEnriched GO biological Processes
ColorectumADGO analysis - Figure of enriched GO biological processes: Top 15 enriched GO BP terms are showed in the bar plot of each disease state in each tissue. Each row represents a significant GO biological process which is colored according to the -log10(p.adjust).
ColorectumSERGO analysis - Figure of enriched GO biological processes: Top 15 enriched GO BP terms are showed in the bar plot of each disease state in each tissue. Each row represents a significant GO biological process which is colored according to the -log10(p.adjust).
ColorectumMSSGO analysis - Figure of enriched GO biological processes: Top 15 enriched GO BP terms are showed in the bar plot of each disease state in each tissue. Each row represents a significant GO biological process which is colored according to the -log10(p.adjust).
ColorectumMSI-HGO analysis - Figure of enriched GO biological processes: Top 15 enriched GO BP terms are showed in the bar plot of each disease state in each tissue. Each row represents a significant GO biological process which is colored according to the -log10(p.adjust).
ColorectumFAPGO analysis - Figure of enriched GO biological processes: Top 15 enriched GO BP terms are showed in the bar plot of each disease state in each tissue. Each row represents a significant GO biological process which is colored according to the -log10(p.adjust).
∗Top 15 enriched GO BP terms are showed in the bar plot of each disease state in each tissue. Each row represents a significant GO biological process which is colored according to the -log10(p.adjust).
Page: 1 2 3 4 5 6 7 8 9 

check button Enriched GO biological processes.
GO IDTissueDisease StageDescriptionGene RatioBg Ratiopvaluep.adjustCount
GO:00343298CervixCCcell junction assembly88/2311420/187233.42e-071.38e-0588
GO:00063257CervixCCchromatin organization78/2311409/187235.40e-058.02e-0478
GO:00104525CervixCChistone H3-K36 methylation8/231115/187231.53e-041.85e-038
GO:00165705CervixCChistone modification84/2311463/187231.70e-042.01e-0384
GO:19018886CervixCCregulation of cell junction assembly42/2311204/187235.50e-045.29e-0342
GO:00349685CervixCChistone lysine methylation27/2311115/187236.61e-046.09e-0327
GO:00310565CervixCCregulation of histone modification33/2311152/187237.97e-047.00e-0333
GO:00165715CervixCChistone methylation30/2311141/187231.88e-031.39e-0230
GO:00180224CervixCCpeptidyl-lysine methylation28/2311131/187232.43e-031.71e-0228
GO:00064795CervixCCprotein methylation36/2311181/187232.46e-031.71e-0236
GO:00082135CervixCCprotein alkylation36/2311181/187232.46e-031.71e-0236
GO:00063545CervixCCDNA-templated transcription, elongation20/231191/187236.88e-033.74e-0220
GO:00182054CervixCCpeptidyl-lysine modification62/2311376/187231.04e-024.97e-0262
GO:0034329ColorectumADcell junction assembly136/3918420/187232.02e-081.15e-06136
GO:0006325ColorectumADchromatin organization119/3918409/187234.85e-058.33e-04119
GO:1901888ColorectumADregulation of cell junction assembly61/3918204/187231.50e-031.27e-0261
GO:0006354ColorectumADDNA-templated transcription, elongation31/391891/187232.46e-031.90e-0231
GO:0050808ColorectumADsynapse organization112/3918426/187234.25e-032.92e-02112
GO:0010452ColorectumADhistone H3-K36 methylation8/391815/187235.67e-033.64e-028
GO:0050807ColorectumADregulation of synapse organization60/3918211/187235.67e-033.64e-0260
Page: 1 2 3 4 5 6 7 8 9 10 11 12 13 14 15 16 17 18 19 20 

check button Enriched KEGG pathways.
Pathway IDTissueDisease StageDescriptionGene RatioBg Ratiopvaluep.adjustqvalueCount
Page: 1 

Top

Cell-cell communication analysis

check buttonIdentification of potential cell-cell interactions between two cell types and their ligand-receptor pairs for different disease states
LigandReceptorLRpairPathwayTissueDisease Stage
Page: 1 

Top

Single-cell gene regulatory network inference analysis

check buttonFind out the significant the regulons (TFs) and the target genes of each regulon across cell types for different disease states
TFCell TypeTissueDisease StageTarget GeneRSSRegulon Activity
∗The dot plots of a searched regulon are shown for all cell subpopulations in each disease state of each tissue based on the regulon specific score inferred using pySCENIC and by calculating the average expression.
Page: 1 

Top

Somatic mutation of malignant transformation related genes

check buttonAnnotation of somatic variants for genes involved in malignant transformation
Hugo SymbolVariant ClassVariant ClassificationdbSNP RSHGVScHGVSpHGVSp ShortSWISSPROTBIOTYPESIFTPolyPhenTumor Sample BarcodeTissueHistologySexAgeStageTherapy TypesDrugsOutcome
SETD5SNVMissense_Mutationnovelc.572N>Gp.Ser191Cysp.S191CQ9C0A6protein_codingdeleterious(0)probably_damaging(0.993)TCGA-A2-A4S1-01Breastbreast invasive carcinomaFemale>=65I/IIUnknownUnknownSD
SETD5SNVMissense_Mutationc.1130N>Tp.Ser377Phep.S377FQ9C0A6protein_codingdeleterious(0.01)possibly_damaging(0.596)TCGA-AN-A041-01Breastbreast invasive carcinomaFemale<65I/IIUnknownUnknownSD
SETD5SNVMissense_Mutationc.1853N>Ap.Arg618Glnp.R618QQ9C0A6protein_codingtolerated(0.07)probably_damaging(0.988)TCGA-AN-A046-01Breastbreast invasive carcinomaFemale>=65I/IIUnknownUnknownSD
SETD5SNVMissense_Mutationnovelc.2798N>Tp.Arg933Ilep.R933IQ9C0A6protein_codingtolerated(0.05)benign(0.202)TCGA-AN-A046-01Breastbreast invasive carcinomaFemale>=65I/IIUnknownUnknownSD
SETD5SNVMissense_Mutationc.2936N>Tp.Thr979Ilep.T979IQ9C0A6protein_codingdeleterious(0)probably_damaging(0.99)TCGA-AN-A0AK-01Breastbreast invasive carcinomaFemale>=65I/IIUnknownUnknownSD
SETD5SNVMissense_Mutationc.1079N>Ap.Val360Glup.V360EQ9C0A6protein_codingdeleterious(0)probably_damaging(0.998)TCGA-AO-A0J5-01Breastbreast invasive carcinomaFemale<65III/IVOther, specify in notesBisphosphonatezoledronicPD
SETD5SNVMissense_Mutationnovelc.4180N>Cp.Ala1394Prop.A1394PQ9C0A6protein_codingtolerated(0.49)benign(0.001)TCGA-AO-A0JM-01Breastbreast invasive carcinomaFemale<65I/IIChemotherapydoxorubicinSD
SETD5SNVMissense_Mutationc.2198C>Ap.Ala733Glup.A733EQ9C0A6protein_codingdeleterious(0)probably_damaging(0.996)TCGA-AR-A1AV-01Breastbreast invasive carcinomaMale>=65I/IIChemotherapycytoxanSD
SETD5SNVMissense_Mutationc.3980C>Gp.Ser1327Cysp.S1327CQ9C0A6protein_codingdeleterious(0)benign(0.001)TCGA-BH-A0W7-01Breastbreast invasive carcinomaFemale<65I/IIChemotherapytaxotereCR
SETD5SNVMissense_Mutationc.2377N>Gp.Met793Valp.M793VQ9C0A6protein_codingtolerated(0.23)benign(0.16)TCGA-BH-A1FL-01Breastbreast invasive carcinomaFemale>=65I/IIUnknownUnknownPD
Page: 1 2 3 4 5 6 7 8 9 10 11 12 13 14 15 16 

Top

Related drugs of malignant transformation related genes

check buttonIdentification of chemicals and drugs interact with genes involved in malignant transfromation
(DGIdb 4.0)
Entrez IDSymbolCategoryInteraction TypesDrug Claim NameDrug NamePMIDs
Page: 1