
|
|||||
|
 | |
| |
| |
| |
| |
| |
|
Gene: SETD4 |
Gene summary for SETD4 |
| Gene information | Species | Human | Gene symbol | SETD4 | Gene ID | 54093 |
| Gene name | SET domain containing 4 | |
| Gene Alias | C21orf18 | |
| Cytomap | 21q22.12 | |
| Gene Type | protein-coding | GO ID | GO:0001816 | UniProtAcc | Q9NVD3 |
Top |
Malignant transformation analysis |
| Identification of the aberrant gene expression in precancerous and cancerous lesions by comparing the gene expression of stem-like cells in diseased tissues with normal stem cells |
| Entrez ID | Symbol | Replicates | Species | Organ | Tissue | Adj P-value | Log2FC | Malignancy |
| 54093 | SETD4 | LZE4T | Human | Esophagus | ESCC | 6.85e-08 | 1.78e-01 | 0.0811 |
| 54093 | SETD4 | LZE7T | Human | Esophagus | ESCC | 2.33e-10 | 3.78e-01 | 0.0667 |
| 54093 | SETD4 | LZE8T | Human | Esophagus | ESCC | 6.46e-04 | 2.62e-02 | 0.067 |
| 54093 | SETD4 | LZE24T | Human | Esophagus | ESCC | 3.78e-06 | 8.04e-04 | 0.0596 |
| 54093 | SETD4 | P1T-E | Human | Esophagus | ESCC | 3.15e-03 | 1.58e-01 | 0.0875 |
| 54093 | SETD4 | P2T-E | Human | Esophagus | ESCC | 3.48e-07 | 1.77e-01 | 0.1177 |
| 54093 | SETD4 | P4T-E | Human | Esophagus | ESCC | 2.61e-26 | 3.98e-01 | 0.1323 |
| 54093 | SETD4 | P5T-E | Human | Esophagus | ESCC | 5.28e-07 | 1.35e-01 | 0.1327 |
| 54093 | SETD4 | P8T-E | Human | Esophagus | ESCC | 5.38e-06 | 7.18e-02 | 0.0889 |
| 54093 | SETD4 | P9T-E | Human | Esophagus | ESCC | 1.95e-09 | 1.25e-01 | 0.1131 |
| 54093 | SETD4 | P10T-E | Human | Esophagus | ESCC | 1.79e-28 | 4.67e-01 | 0.116 |
| 54093 | SETD4 | P11T-E | Human | Esophagus | ESCC | 1.95e-14 | 2.66e-01 | 0.1426 |
| 54093 | SETD4 | P12T-E | Human | Esophagus | ESCC | 6.07e-13 | 2.44e-01 | 0.1122 |
| 54093 | SETD4 | P15T-E | Human | Esophagus | ESCC | 6.68e-15 | 1.20e-01 | 0.1149 |
| 54093 | SETD4 | P16T-E | Human | Esophagus | ESCC | 1.37e-10 | 2.10e-01 | 0.1153 |
| 54093 | SETD4 | P17T-E | Human | Esophagus | ESCC | 7.43e-04 | 9.06e-02 | 0.1278 |
| 54093 | SETD4 | P19T-E | Human | Esophagus | ESCC | 1.84e-02 | 1.67e-01 | 0.1662 |
| 54093 | SETD4 | P20T-E | Human | Esophagus | ESCC | 1.30e-16 | 2.24e-01 | 0.1124 |
| 54093 | SETD4 | P21T-E | Human | Esophagus | ESCC | 8.57e-15 | 1.16e-01 | 0.1617 |
| 54093 | SETD4 | P22T-E | Human | Esophagus | ESCC | 8.56e-19 | 1.66e-01 | 0.1236 |
| Page: 1 2 3 |
| Tissue | Expression Dynamics | Abbreviation |
| Esophagus | 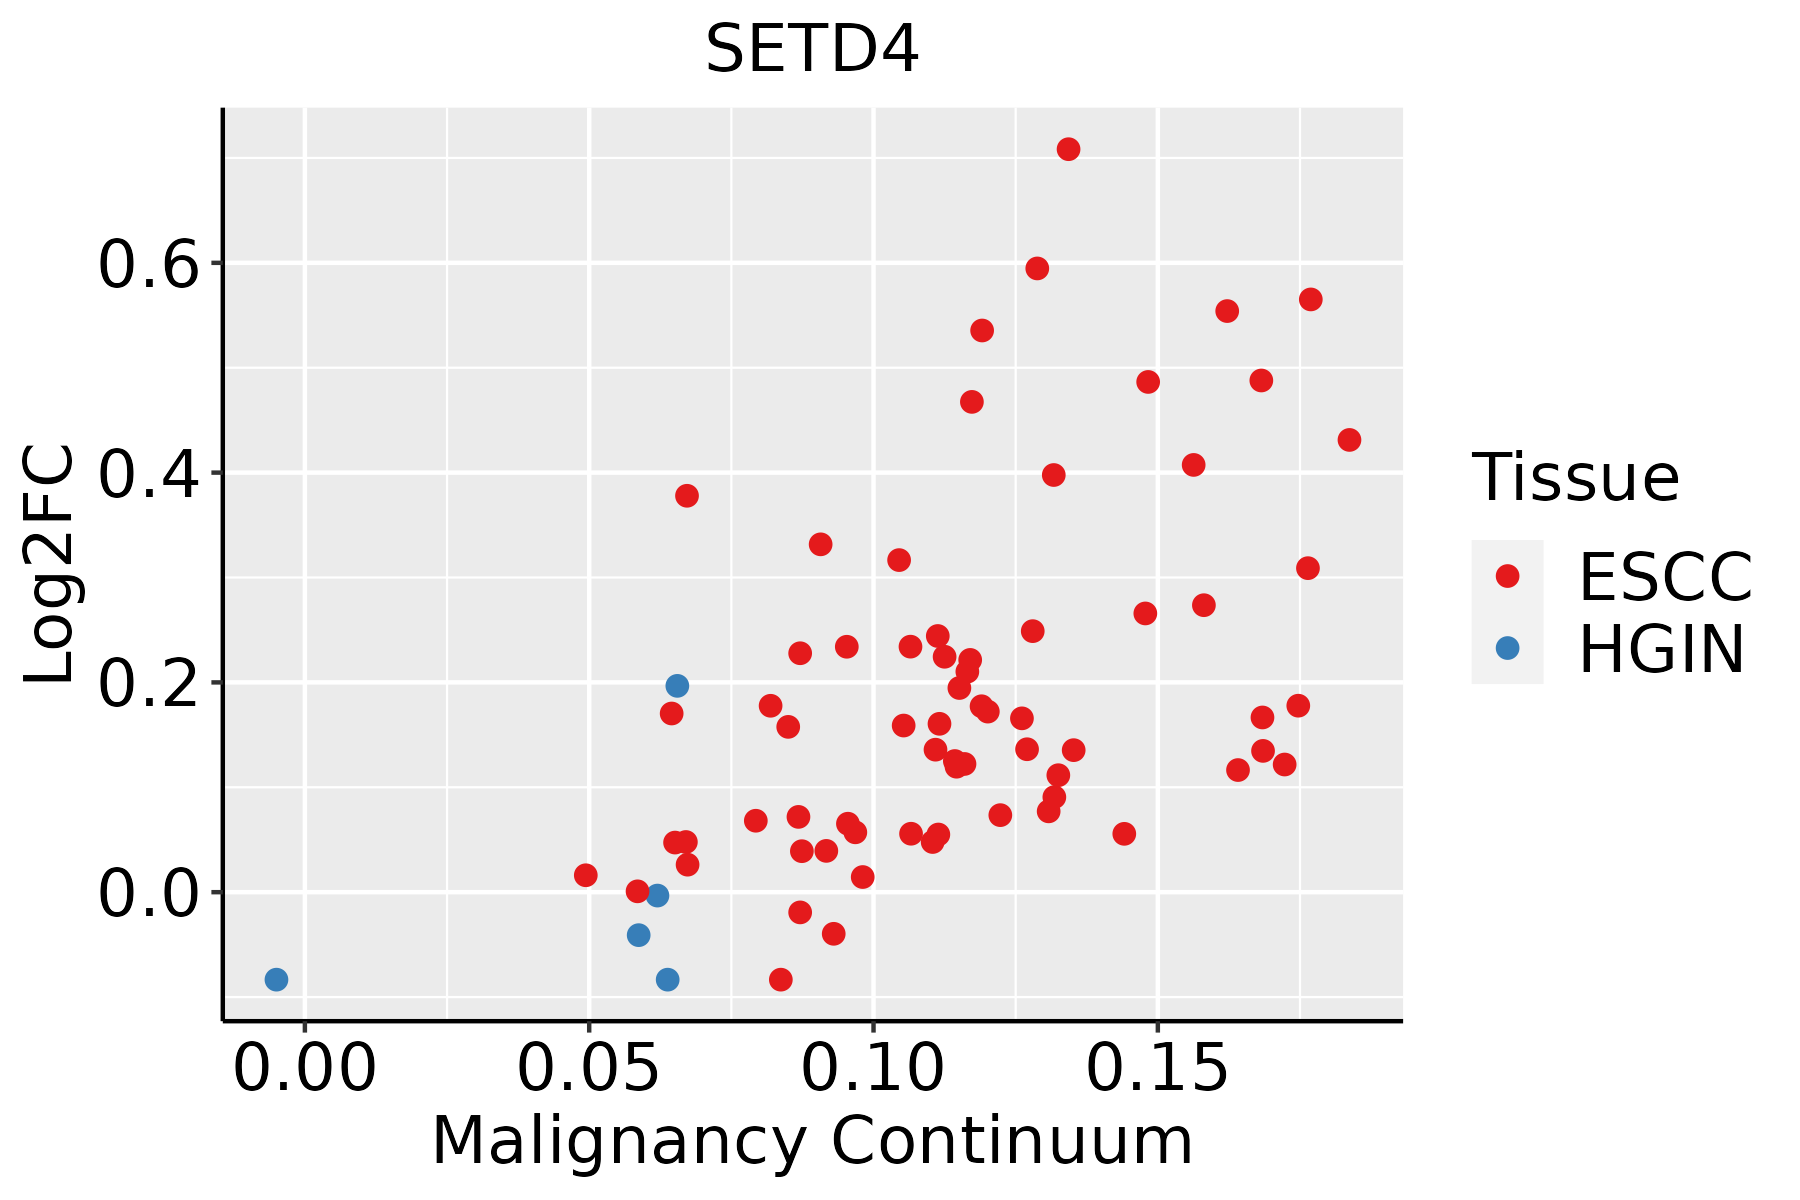 | ESCC: Esophageal squamous cell carcinoma |
| HGIN: High-grade intraepithelial neoplasias | ||
| LGIN: Low-grade intraepithelial neoplasias |
| ∗log2FC in expression of this searched gene in stem-like cells from each diseased tissue sample relative to stem-like cells in normal samples in each tissue plotted against the malignancy continuum. Samples are colored based on if they are from different disease stage. |
Top |
Malignant transformation related pathway analysis |
| Find out the enriched GO biological processes and KEGG pathways involved in transition from healthy to precancer to cancer |
| Tissue | Disease Stage | Enriched GO biological Processes |
| Colorectum | AD |  |
| Colorectum | SER |  |
| Colorectum | MSS |  |
| Colorectum | MSI-H |  |
| Colorectum | FAP |  |
| ∗Top 15 enriched GO BP terms are showed in the bar plot of each disease state in each tissue. Each row represents a significant GO biological process which is colored according to the -log10(p.adjust). |
| Page: 1 2 3 4 5 6 7 8 9 |
| GO ID | Tissue | Disease Stage | Description | Gene Ratio | Bg Ratio | pvalue | p.adjust | Count |
| GO:001657015 | Esophagus | ESCC | histone modification | 323/8552 | 463/18723 | 2.61e-26 | 7.88e-24 | 323 |
| GO:001820514 | Esophagus | ESCC | peptidyl-lysine modification | 259/8552 | 376/18723 | 3.90e-20 | 5.26e-18 | 259 |
| GO:00434143 | Esophagus | ESCC | macromolecule methylation | 199/8552 | 316/18723 | 3.44e-10 | 9.57e-09 | 199 |
| GO:00322592 | Esophagus | ESCC | methylation | 222/8552 | 364/18723 | 2.26e-09 | 5.09e-08 | 222 |
| GO:000647914 | Esophagus | ESCC | protein methylation | 115/8552 | 181/18723 | 9.07e-07 | 1.16e-05 | 115 |
| GO:000821314 | Esophagus | ESCC | protein alkylation | 115/8552 | 181/18723 | 9.07e-07 | 1.16e-05 | 115 |
| GO:00165718 | Esophagus | ESCC | histone methylation | 89/8552 | 141/18723 | 2.17e-05 | 1.87e-04 | 89 |
| GO:003496814 | Esophagus | ESCC | histone lysine methylation | 72/8552 | 115/18723 | 1.85e-04 | 1.18e-03 | 72 |
| GO:001802214 | Esophagus | ESCC | peptidyl-lysine methylation | 79/8552 | 131/18723 | 5.17e-04 | 2.86e-03 | 79 |
| GO:000181916 | Esophagus | ESCC | positive regulation of cytokine production | 244/8552 | 467/18723 | 2.29e-03 | 1.01e-02 | 244 |
| GO:00180231 | Esophagus | ESCC | peptidyl-lysine trimethylation | 31/8552 | 50/18723 | 1.48e-02 | 4.79e-02 | 31 |
| Page: 1 |
| Pathway ID | Tissue | Disease Stage | Description | Gene Ratio | Bg Ratio | pvalue | p.adjust | qvalue | Count |
| Page: 1 |
Top |
Cell-cell communication analysis |
| Identification of potential cell-cell interactions between two cell types and their ligand-receptor pairs for different disease states |
| Ligand | Receptor | LRpair | Pathway | Tissue | Disease Stage |
| Page: 1 |
Top |
Single-cell gene regulatory network inference analysis |
| Find out the significant the regulons (TFs) and the target genes of each regulon across cell types for different disease states |
| TF | Cell Type | Tissue | Disease Stage | Target Gene | RSS | Regulon Activity |
| ∗The dot plots of a searched regulon are shown for all cell subpopulations in each disease state of each tissue based on the regulon specific score inferred using pySCENIC and by calculating the average expression. |
| Page: 1 |
Top |
Somatic mutation of malignant transformation related genes |
| Annotation of somatic variants for genes involved in malignant transformation |
| Hugo Symbol | Variant Class | Variant Classification | dbSNP RS | HGVSc | HGVSp | HGVSp Short | SWISSPROT | BIOTYPE | SIFT | PolyPhen | Tumor Sample Barcode | Tissue | Histology | Sex | Age | Stage | Therapy Types | Drugs | Outcome |
| SETD4 | SNV | Missense_Mutation | novel | c.533C>G | p.Ser178Cys | p.S178C | Q9NVD3 | protein_coding | tolerated(0.13) | probably_damaging(0.962) | TCGA-A1-A0SI-01 | Breast | breast invasive carcinoma | Female | <65 | I/II | Unknown | Unknown | SD |
| SETD4 | SNV | Missense_Mutation | c.451N>T | p.Leu151Phe | p.L151F | Q9NVD3 | protein_coding | tolerated(0.1) | benign(0.283) | TCGA-A2-A0YK-01 | Breast | breast invasive carcinoma | Female | <65 | I/II | Chemotherapy | cytoxan | SD | |
| SETD4 | SNV | Missense_Mutation | novel | c.319N>G | p.Leu107Val | p.L107V | Q9NVD3 | protein_coding | tolerated(0.07) | possibly_damaging(0.85) | TCGA-A7-A0CG-01 | Breast | breast invasive carcinoma | Female | >=65 | I/II | Unknown | Unknown | SD |
| SETD4 | insertion | Nonsense_Mutation | novel | c.595_596insAGGTGTTCAGTAAATGTTTATTGAATGGATGGGTATTTGTG | p.Trp199Ter | p.W199* | Q9NVD3 | protein_coding | TCGA-A8-A08H-01 | Breast | breast invasive carcinoma | Female | >=65 | I/II | Unknown | Unknown | SD | ||
| SETD4 | insertion | In_Frame_Ins | novel | c.1265_1266insCAGCGCCCCACAACAGGACAGCGA | p.Leu422_Lys423insSerAlaProGlnGlnAspSerGlu | p.L422_K423insSAPQQDSE | Q9NVD3 | protein_coding | TCGA-BH-A0B4-01 | Breast | breast invasive carcinoma | Male | >=65 | III/IV | Hormone Therapy | tamoxiphen | SD | ||
| SETD4 | insertion | Frame_Shift_Ins | novel | c.1264_1265insGACCCCCACACACA | p.Leu422ArgfsTer6 | p.L422Rfs*6 | Q9NVD3 | protein_coding | TCGA-BH-A0B4-01 | Breast | breast invasive carcinoma | Male | >=65 | III/IV | Hormone Therapy | tamoxiphen | SD | ||
| SETD4 | deletion | Frame_Shift_Del | novel | c.821delN | p.Pro274LeufsTer48 | p.P274Lfs*48 | Q9NVD3 | protein_coding | TCGA-D8-A27V-01 | Breast | breast invasive carcinoma | Female | <65 | I/II | Hormone Therapy | tamoxiphen | SD | ||
| SETD4 | SNV | Missense_Mutation | rs774123745 | c.817N>A | p.Gly273Ser | p.G273S | Q9NVD3 | protein_coding | deleterious(0) | probably_damaging(0.999) | TCGA-2W-A8YY-01 | Cervix | cervical & endocervical cancer | Female | <65 | I/II | Chemotherapy | cisplatin | CR |
| SETD4 | SNV | Missense_Mutation | c.451N>T | p.Leu151Phe | p.L151F | Q9NVD3 | protein_coding | tolerated(0.1) | benign(0.283) | TCGA-VS-A8QM-01 | Cervix | cervical & endocervical cancer | Female | <65 | I/II | Chemotherapy | cisplatin | PD | |
| SETD4 | SNV | Missense_Mutation | rs751127123 | c.610N>A | p.Val204Ile | p.V204I | Q9NVD3 | protein_coding | tolerated(0.36) | benign(0.213) | TCGA-A6-6780-01 | Colorectum | colon adenocarcinoma | Male | >=65 | I/II | Unknown | Unknown | SD |
| Page: 1 2 3 4 5 |
Top |
Related drugs of malignant transformation related genes |
| Identification of chemicals and drugs interact with genes involved in malignant transfromation |
| (DGIdb 4.0) |
| Entrez ID | Symbol | Category | Interaction Types | Drug Claim Name | Drug Name | PMIDs |
| 54093 | SETD4 | METHYL TRANSFERASE | daunorubicin | DAUNORUBICIN | 19204081 | |
| 54093 | SETD4 | METHYL TRANSFERASE | doxorubicin | DOXORUBICIN | 19204081 |
| Page: 1 |

Copyright 2023-Present -The University of Texas Health Science Center at Houston |