
|
|||||
|
 | |
| |
| |
| |
| |
| |
|
Gene: SETD3 |
Gene summary for SETD3 |
| Gene information | Species | Human | Gene symbol | SETD3 | Gene ID | 84193 |
| Gene name | SET domain containing 3, actin histidine methyltransferase | |
| Gene Alias | C14orf154 | |
| Cytomap | 14q32.2 | |
| Gene Type | protein-coding | GO ID | GO:0003008 | UniProtAcc | A0A024R6K3 |
Top |
Malignant transformation analysis |
| Identification of the aberrant gene expression in precancerous and cancerous lesions by comparing the gene expression of stem-like cells in diseased tissues with normal stem cells |
| Entrez ID | Symbol | Replicates | Species | Organ | Tissue | Adj P-value | Log2FC | Malignancy |
| 84193 | SETD3 | HTA11_3410_2000001011 | Human | Colorectum | AD | 3.45e-06 | -2.37e-01 | 0.0155 |
| 84193 | SETD3 | HTA11_99999971662_82457 | Human | Colorectum | MSS | 1.75e-02 | -2.32e-01 | 0.3859 |
| 84193 | SETD3 | A001-C-207 | Human | Colorectum | FAP | 2.98e-02 | -1.99e-01 | 0.1278 |
| 84193 | SETD3 | A015-C-203 | Human | Colorectum | FAP | 1.15e-21 | -3.95e-01 | -0.1294 |
| 84193 | SETD3 | A015-C-204 | Human | Colorectum | FAP | 3.41e-03 | -2.34e-01 | -0.0228 |
| 84193 | SETD3 | A002-C-201 | Human | Colorectum | FAP | 1.02e-06 | -2.47e-01 | 0.0324 |
| 84193 | SETD3 | A001-C-119 | Human | Colorectum | FAP | 7.70e-08 | -4.66e-01 | -0.1557 |
| 84193 | SETD3 | A001-C-108 | Human | Colorectum | FAP | 7.45e-13 | -2.99e-01 | -0.0272 |
| 84193 | SETD3 | A002-C-205 | Human | Colorectum | FAP | 5.21e-18 | -4.32e-01 | -0.1236 |
| 84193 | SETD3 | A015-C-006 | Human | Colorectum | FAP | 1.71e-13 | -4.55e-01 | -0.0994 |
| 84193 | SETD3 | A015-C-106 | Human | Colorectum | FAP | 5.16e-09 | -2.40e-01 | -0.0511 |
| 84193 | SETD3 | A002-C-114 | Human | Colorectum | FAP | 5.94e-13 | -3.75e-01 | -0.1561 |
| 84193 | SETD3 | A015-C-104 | Human | Colorectum | FAP | 1.79e-20 | -3.58e-01 | -0.1899 |
| 84193 | SETD3 | A001-C-014 | Human | Colorectum | FAP | 1.68e-08 | -2.39e-01 | 0.0135 |
| 84193 | SETD3 | A002-C-016 | Human | Colorectum | FAP | 2.77e-11 | -2.22e-01 | 0.0521 |
| 84193 | SETD3 | A015-C-002 | Human | Colorectum | FAP | 2.72e-09 | -4.17e-01 | -0.0763 |
| 84193 | SETD3 | A001-C-203 | Human | Colorectum | FAP | 1.46e-04 | -2.20e-01 | -0.0481 |
| 84193 | SETD3 | A002-C-116 | Human | Colorectum | FAP | 2.98e-19 | -3.72e-01 | -0.0452 |
| 84193 | SETD3 | A014-C-008 | Human | Colorectum | FAP | 7.81e-11 | -4.09e-01 | -0.191 |
| 84193 | SETD3 | A018-E-020 | Human | Colorectum | FAP | 3.73e-16 | -4.09e-01 | -0.2034 |
| Page: 1 2 3 4 5 6 7 |
| Tissue | Expression Dynamics | Abbreviation |
| Colorectum (GSE201348) |  | FAP: Familial adenomatous polyposis |
| CRC: Colorectal cancer | ||
| Colorectum (HTA11) |  | AD: Adenomas |
| SER: Sessile serrated lesions | ||
| MSI-H: Microsatellite-high colorectal cancer | ||
| MSS: Microsatellite stable colorectal cancer | ||
| Esophagus |  | ESCC: Esophageal squamous cell carcinoma |
| HGIN: High-grade intraepithelial neoplasias | ||
| LGIN: Low-grade intraepithelial neoplasias | ||
| Liver | 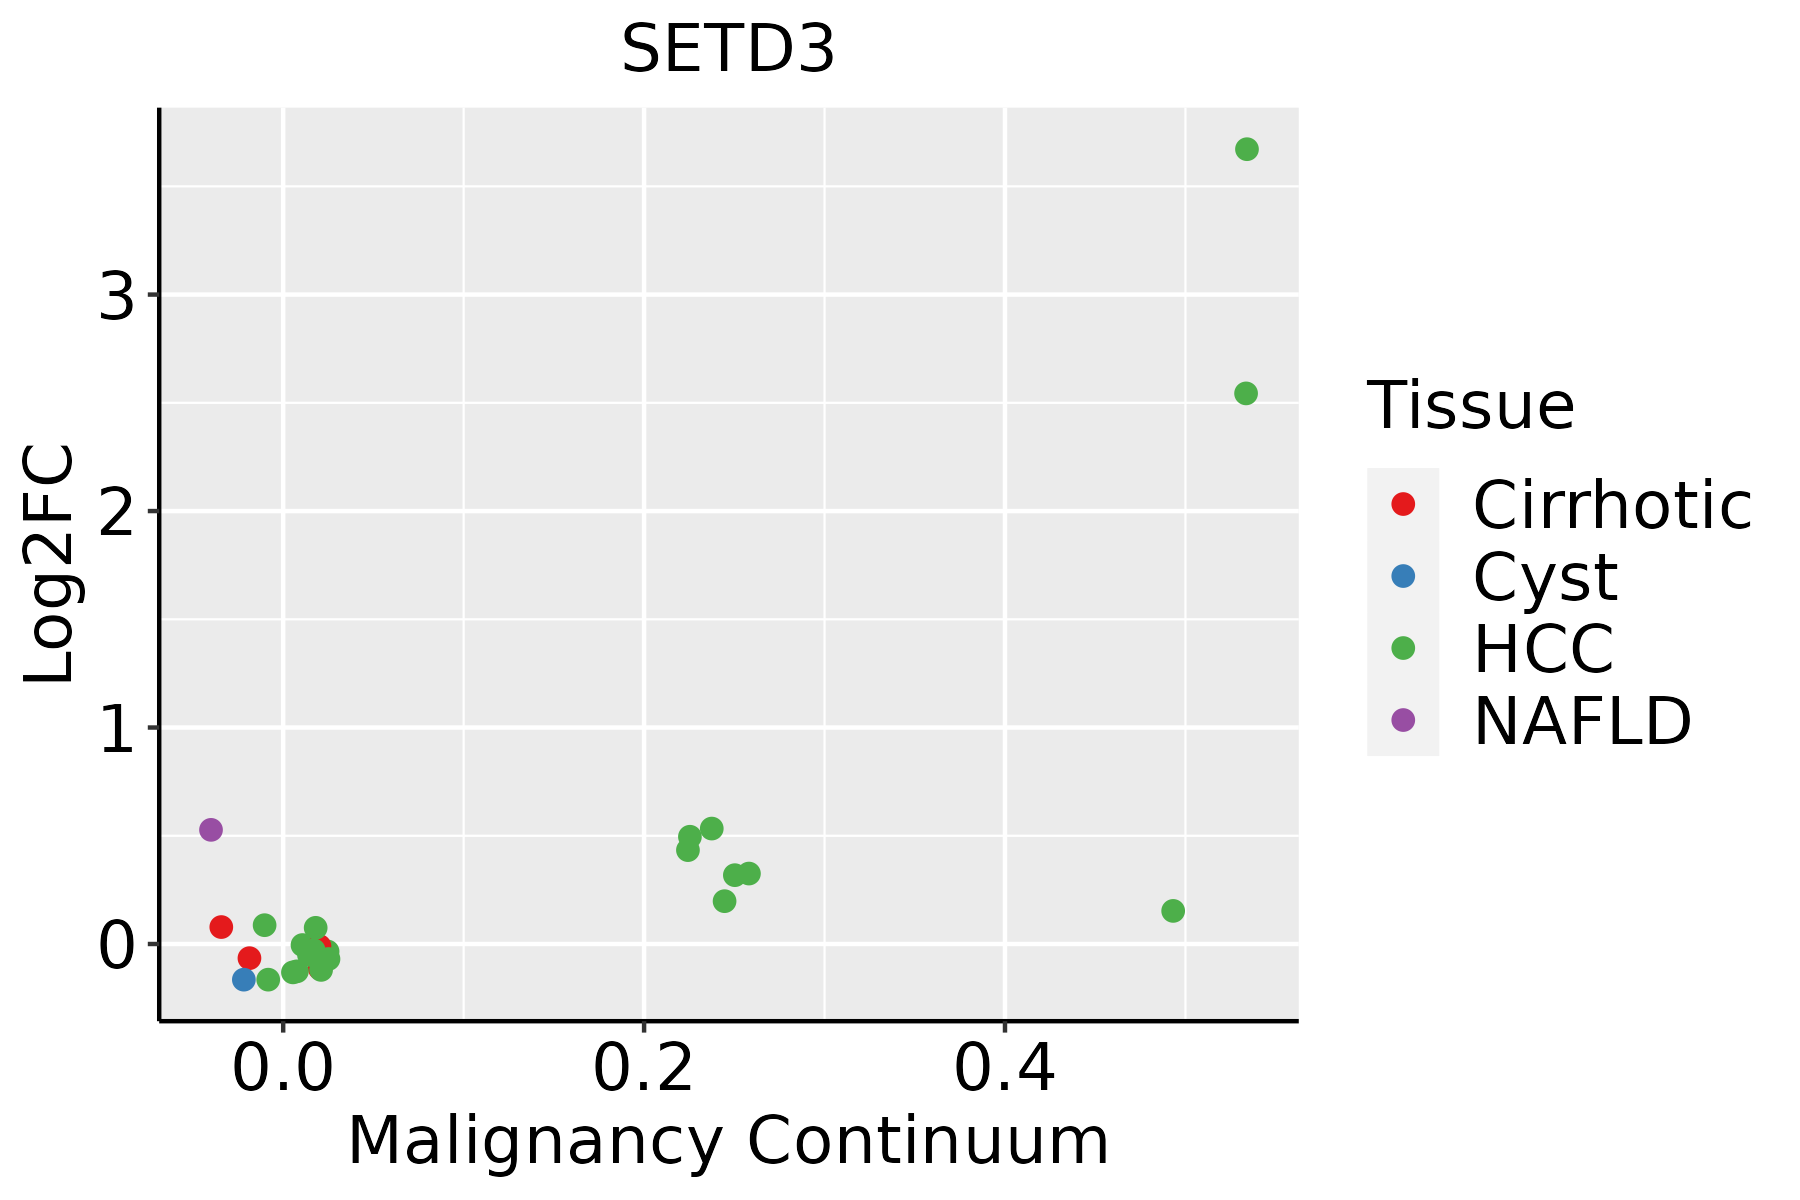 | HCC: Hepatocellular carcinoma |
| NAFLD: Non-alcoholic fatty liver disease | ||
| Oral Cavity |  | EOLP: Erosive Oral lichen planus |
| LP: leukoplakia | ||
| NEOLP: Non-erosive oral lichen planus | ||
| OSCC: Oral squamous cell carcinoma | ||
| Skin | 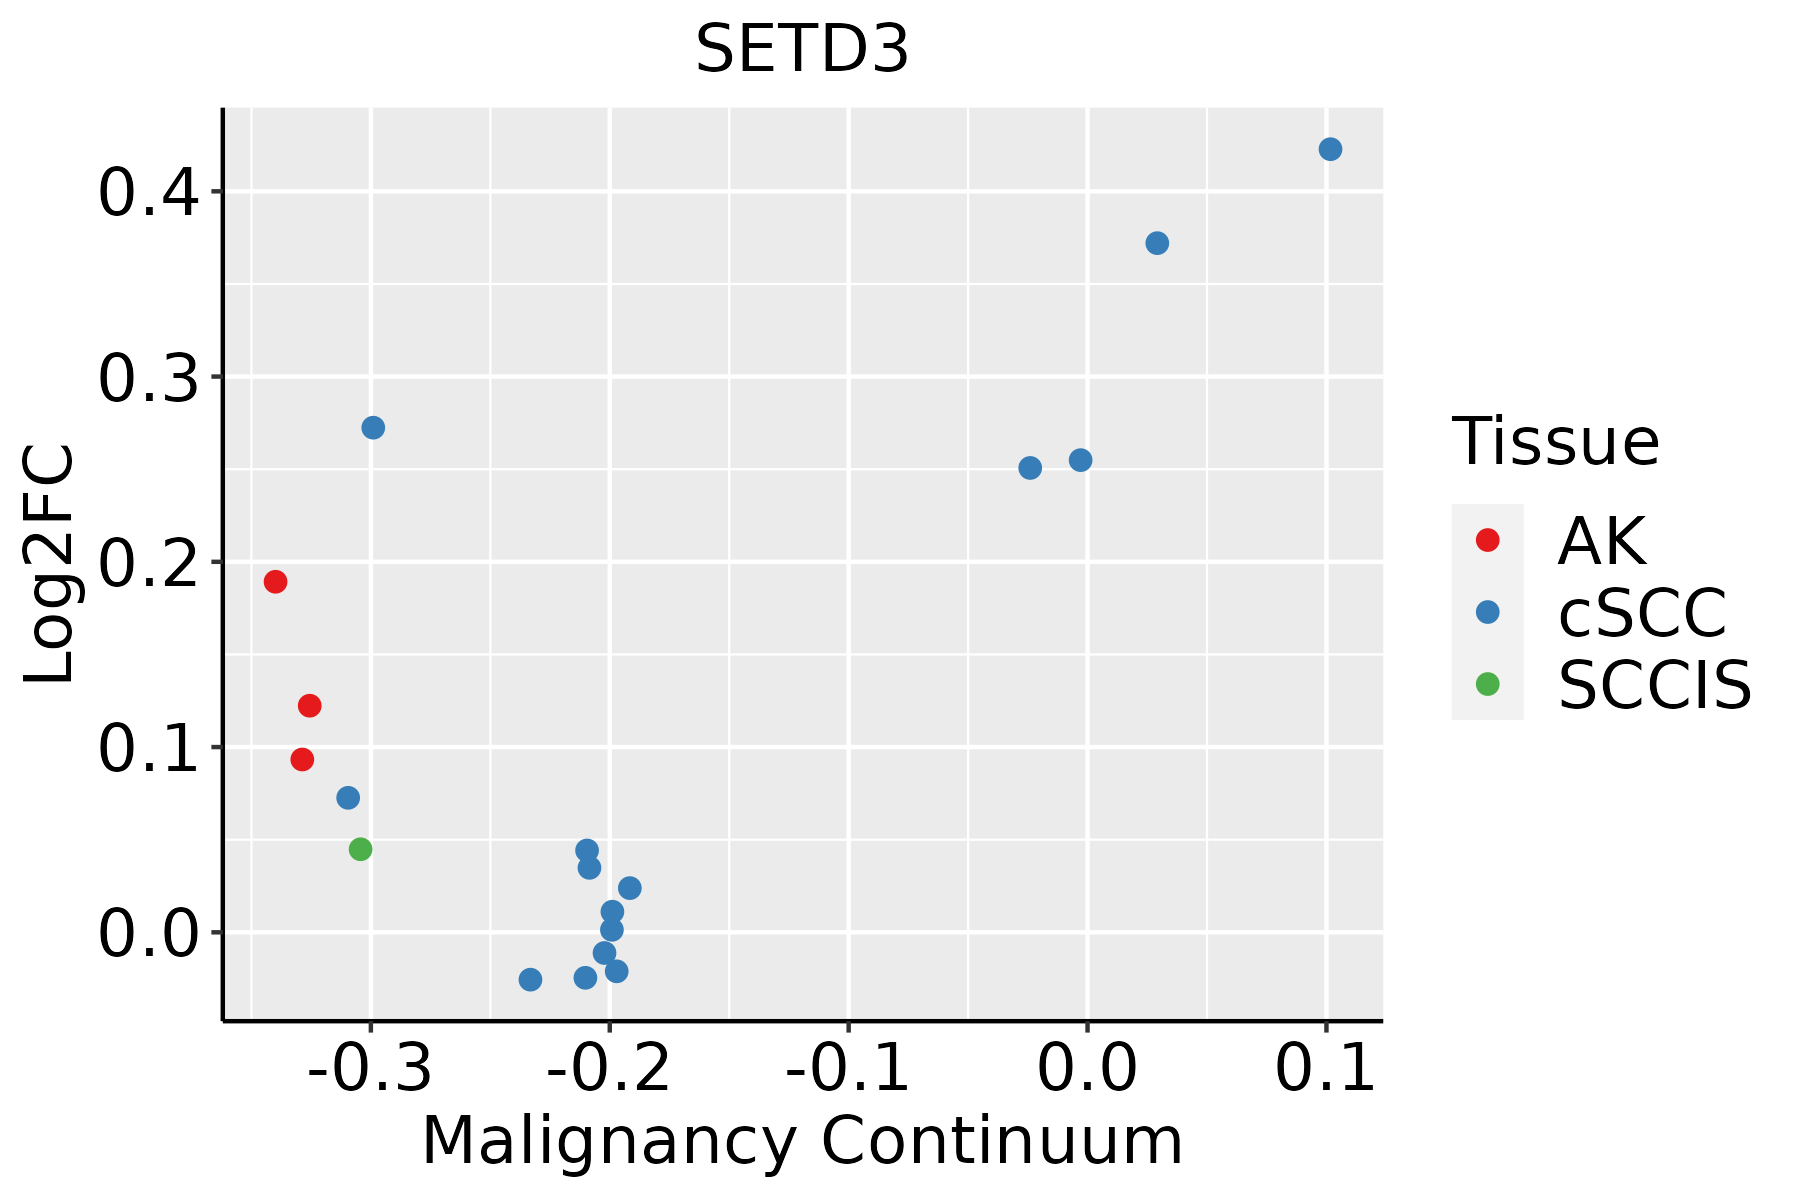 | AK: Actinic keratosis |
| cSCC: Cutaneous squamous cell carcinoma | ||
| SCCIS:squamous cell carcinoma in situ | ||
| Thyroid |  | ATC: Anaplastic thyroid cancer |
| HT: Hashimoto's thyroiditis | ||
| PTC: Papillary thyroid cancer |
| ∗log2FC in expression of this searched gene in stem-like cells from each diseased tissue sample relative to stem-like cells in normal samples in each tissue plotted against the malignancy continuum. Samples are colored based on if they are from different disease stage. |
Top |
Malignant transformation related pathway analysis |
| Find out the enriched GO biological processes and KEGG pathways involved in transition from healthy to precancer to cancer |
| Tissue | Disease Stage | Enriched GO biological Processes |
| Colorectum | AD |  |
| Colorectum | SER |  |
| Colorectum | MSS |  |
| Colorectum | MSI-H |  |
| Colorectum | FAP |  |
| ∗Top 15 enriched GO BP terms are showed in the bar plot of each disease state in each tissue. Each row represents a significant GO biological process which is colored according to the -log10(p.adjust). |
| Page: 1 2 3 4 5 6 7 8 9 |
| GO ID | Tissue | Disease Stage | Description | Gene Ratio | Bg Ratio | pvalue | p.adjust | Count |
| GO:0090257 | Colorectum | AD | regulation of muscle system process | 73/3918 | 252/18723 | 1.46e-03 | 1.24e-02 | 73 |
| GO:0010452 | Colorectum | AD | histone H3-K36 methylation | 8/3918 | 15/18723 | 5.67e-03 | 3.64e-02 | 8 |
| GO:0016570 | Colorectum | MSS | histone modification | 113/3467 | 463/18723 | 8.37e-04 | 8.68e-03 | 113 |
| GO:00902572 | Colorectum | MSS | regulation of muscle system process | 66/3467 | 252/18723 | 1.55e-03 | 1.41e-02 | 66 |
| GO:00030121 | Colorectum | MSS | muscle system process | 105/3467 | 452/18723 | 6.39e-03 | 4.26e-02 | 105 |
| GO:00902574 | Colorectum | FAP | regulation of muscle system process | 58/2622 | 252/18723 | 7.22e-05 | 1.33e-03 | 58 |
| GO:00165701 | Colorectum | FAP | histone modification | 94/2622 | 463/18723 | 1.06e-04 | 1.76e-03 | 94 |
| GO:00104521 | Colorectum | FAP | histone H3-K36 methylation | 8/2622 | 15/18723 | 3.75e-04 | 4.63e-03 | 8 |
| GO:00030122 | Colorectum | FAP | muscle system process | 89/2622 | 452/18723 | 4.63e-04 | 5.39e-03 | 89 |
| GO:00069371 | Colorectum | FAP | regulation of muscle contraction | 37/2622 | 169/18723 | 3.39e-03 | 2.47e-02 | 37 |
| GO:0006479 | Colorectum | FAP | protein methylation | 39/2622 | 181/18723 | 3.60e-03 | 2.58e-02 | 39 |
| GO:0008213 | Colorectum | FAP | protein alkylation | 39/2622 | 181/18723 | 3.60e-03 | 2.58e-02 | 39 |
| GO:0034968 | Colorectum | FAP | histone lysine methylation | 27/2622 | 115/18723 | 4.23e-03 | 2.90e-02 | 27 |
| GO:0016571 | Colorectum | FAP | histone methylation | 31/2622 | 141/18723 | 6.47e-03 | 4.03e-02 | 31 |
| GO:00902575 | Colorectum | CRC | regulation of muscle system process | 51/2078 | 252/18723 | 1.49e-05 | 4.63e-04 | 51 |
| GO:00030123 | Colorectum | CRC | muscle system process | 74/2078 | 452/18723 | 3.92e-04 | 5.80e-03 | 74 |
| GO:00165702 | Colorectum | CRC | histone modification | 75/2078 | 463/18723 | 4.95e-04 | 7.06e-03 | 75 |
| GO:00104522 | Colorectum | CRC | histone H3-K36 methylation | 7/2078 | 15/18723 | 5.89e-04 | 7.89e-03 | 7 |
| GO:00069372 | Colorectum | CRC | regulation of muscle contraction | 33/2078 | 169/18723 | 8.65e-04 | 1.07e-02 | 33 |
| GO:00182057 | Esophagus | HGIN | peptidyl-lysine modification | 88/2587 | 376/18723 | 2.99e-07 | 1.39e-05 | 88 |
| Page: 1 2 3 4 5 6 |
| Pathway ID | Tissue | Disease Stage | Description | Gene Ratio | Bg Ratio | pvalue | p.adjust | qvalue | Count |
| Page: 1 |
Top |
Cell-cell communication analysis |
| Identification of potential cell-cell interactions between two cell types and their ligand-receptor pairs for different disease states |
| Ligand | Receptor | LRpair | Pathway | Tissue | Disease Stage |
| Page: 1 |
Top |
Single-cell gene regulatory network inference analysis |
| Find out the significant the regulons (TFs) and the target genes of each regulon across cell types for different disease states |
| TF | Cell Type | Tissue | Disease Stage | Target Gene | RSS | Regulon Activity |
| ∗The dot plots of a searched regulon are shown for all cell subpopulations in each disease state of each tissue based on the regulon specific score inferred using pySCENIC and by calculating the average expression. |
| Page: 1 |
Top |
Somatic mutation of malignant transformation related genes |
| Annotation of somatic variants for genes involved in malignant transformation |
| Hugo Symbol | Variant Class | Variant Classification | dbSNP RS | HGVSc | HGVSp | HGVSp Short | SWISSPROT | BIOTYPE | SIFT | PolyPhen | Tumor Sample Barcode | Tissue | Histology | Sex | Age | Stage | Therapy Types | Drugs | Outcome |
| SETD3 | SNV | Missense_Mutation | rs143398632 | c.1366N>A | p.Asp456Asn | p.D456N | Q86TU7 | protein_coding | tolerated(0.17) | benign(0.047) | TCGA-AN-A046-01 | Breast | breast invasive carcinoma | Female | >=65 | I/II | Unknown | Unknown | SD |
| SETD3 | SNV | Missense_Mutation | novel | c.24N>C | p.Lys8Asn | p.K8N | Q86TU7 | protein_coding | deleterious(0.01) | probably_damaging(0.986) | TCGA-AN-A046-01 | Breast | breast invasive carcinoma | Female | >=65 | I/II | Unknown | Unknown | SD |
| SETD3 | SNV | Missense_Mutation | rs771711935 | c.1493N>T | p.Pro498Leu | p.P498L | Q86TU7 | protein_coding | deleterious(0.02) | benign(0.007) | TCGA-B6-A0IK-01 | Breast | breast invasive carcinoma | Female | <65 | III/IV | Unknown | Unknown | PD |
| SETD3 | SNV | Missense_Mutation | c.469N>A | p.Leu157Met | p.L157M | Q86TU7 | protein_coding | tolerated(0.06) | probably_damaging(0.999) | TCGA-C8-A26Y-01 | Breast | breast invasive carcinoma | Female | >=65 | I/II | Unknown | Unknown | SD | |
| SETD3 | insertion | Frame_Shift_Ins | novel | c.1359_1360insCCTCCCTGTTTTTCATGTAAACT | p.Asn454ProfsTer24 | p.N454Pfs*24 | Q86TU7 | protein_coding | TCGA-AO-A03T-01 | Breast | breast invasive carcinoma | Female | <65 | I/II | Chemotherapy | cyclophosphamide | SD | ||
| SETD3 | SNV | Missense_Mutation | novel | c.834N>G | p.Asn278Lys | p.N278K | Q86TU7 | protein_coding | deleterious(0) | probably_damaging(1) | TCGA-VS-A8EK-01 | Cervix | cervical & endocervical cancer | Female | >=65 | I/II | Chemotherapy | cisplatin | PD |
| SETD3 | SNV | Missense_Mutation | rs763948380 | c.1378N>T | p.Arg460Cys | p.R460C | Q86TU7 | protein_coding | deleterious(0.01) | possibly_damaging(0.784) | TCGA-AA-3510-01 | Colorectum | colon adenocarcinoma | Male | >=65 | I/II | Unknown | Unknown | SD |
| SETD3 | SNV | Missense_Mutation | rs771711935 | c.1493C>T | p.Pro498Leu | p.P498L | Q86TU7 | protein_coding | deleterious(0.02) | benign(0.007) | TCGA-AA-3833-01 | Colorectum | colon adenocarcinoma | Female | <65 | I/II | Unknown | Unknown | SD |
| SETD3 | SNV | Missense_Mutation | c.1345N>G | p.Lys449Glu | p.K449E | Q86TU7 | protein_coding | tolerated(0.96) | benign(0.001) | TCGA-AA-3966-01 | Colorectum | colon adenocarcinoma | Female | >=65 | I/II | Unknown | Unknown | SD | |
| SETD3 | SNV | Missense_Mutation | c.405N>C | p.Lys135Asn | p.K135N | Q86TU7 | protein_coding | tolerated(0.09) | possibly_damaging(0.827) | TCGA-AA-A00N-01 | Colorectum | colon adenocarcinoma | Male | >=65 | I/II | Unknown | Unknown | PD |
| Page: 1 2 3 4 5 6 |
Top |
Related drugs of malignant transformation related genes |
| Identification of chemicals and drugs interact with genes involved in malignant transfromation |
| (DGIdb 4.0) |
| Entrez ID | Symbol | Category | Interaction Types | Drug Claim Name | Drug Name | PMIDs |
| Page: 1 |

Copyright 2023-Present -The University of Texas Health Science Center at Houston |