
|
|||||
|
 | |
| |
| |
| |
| |
| |
|
Gene: SETD1B |
Gene summary for SETD1B |
| Gene information | Species | Human | Gene symbol | SETD1B | Gene ID | 23067 |
| Gene name | SET domain containing 1B, histone lysine methyltransferase | |
| Gene Alias | IDDSELD | |
| Cytomap | 12q24.31 | |
| Gene Type | protein-coding | GO ID | GO:0006464 | UniProtAcc | Q9UPS6 |
Top |
Malignant transformation analysis |
| Identification of the aberrant gene expression in precancerous and cancerous lesions by comparing the gene expression of stem-like cells in diseased tissues with normal stem cells |
| Entrez ID | Symbol | Replicates | Species | Organ | Tissue | Adj P-value | Log2FC | Malignancy |
| 23067 | SETD1B | HCC1_Meng | Human | Liver | HCC | 1.43e-19 | 3.59e-03 | 0.0246 |
| 23067 | SETD1B | HCC2_Meng | Human | Liver | HCC | 8.56e-05 | 5.05e-02 | 0.0107 |
| 23067 | SETD1B | HCC1 | Human | Liver | HCC | 2.59e-04 | 2.57e+00 | 0.5336 |
| 23067 | SETD1B | HCC2 | Human | Liver | HCC | 6.72e-08 | 2.04e+00 | 0.5341 |
| 23067 | SETD1B | S014 | Human | Liver | HCC | 8.94e-08 | 3.19e-01 | 0.2254 |
| 23067 | SETD1B | S015 | Human | Liver | HCC | 4.07e-06 | 2.78e-01 | 0.2375 |
| 23067 | SETD1B | S016 | Human | Liver | HCC | 5.23e-06 | 2.85e-01 | 0.2243 |
| 23067 | SETD1B | S027 | Human | Liver | HCC | 1.57e-05 | 5.13e-01 | 0.2446 |
| 23067 | SETD1B | S028 | Human | Liver | HCC | 9.85e-15 | 5.08e-01 | 0.2503 |
| 23067 | SETD1B | S029 | Human | Liver | HCC | 4.98e-12 | 5.49e-01 | 0.2581 |
| Page: 1 |
| Tissue | Expression Dynamics | Abbreviation |
| Liver | 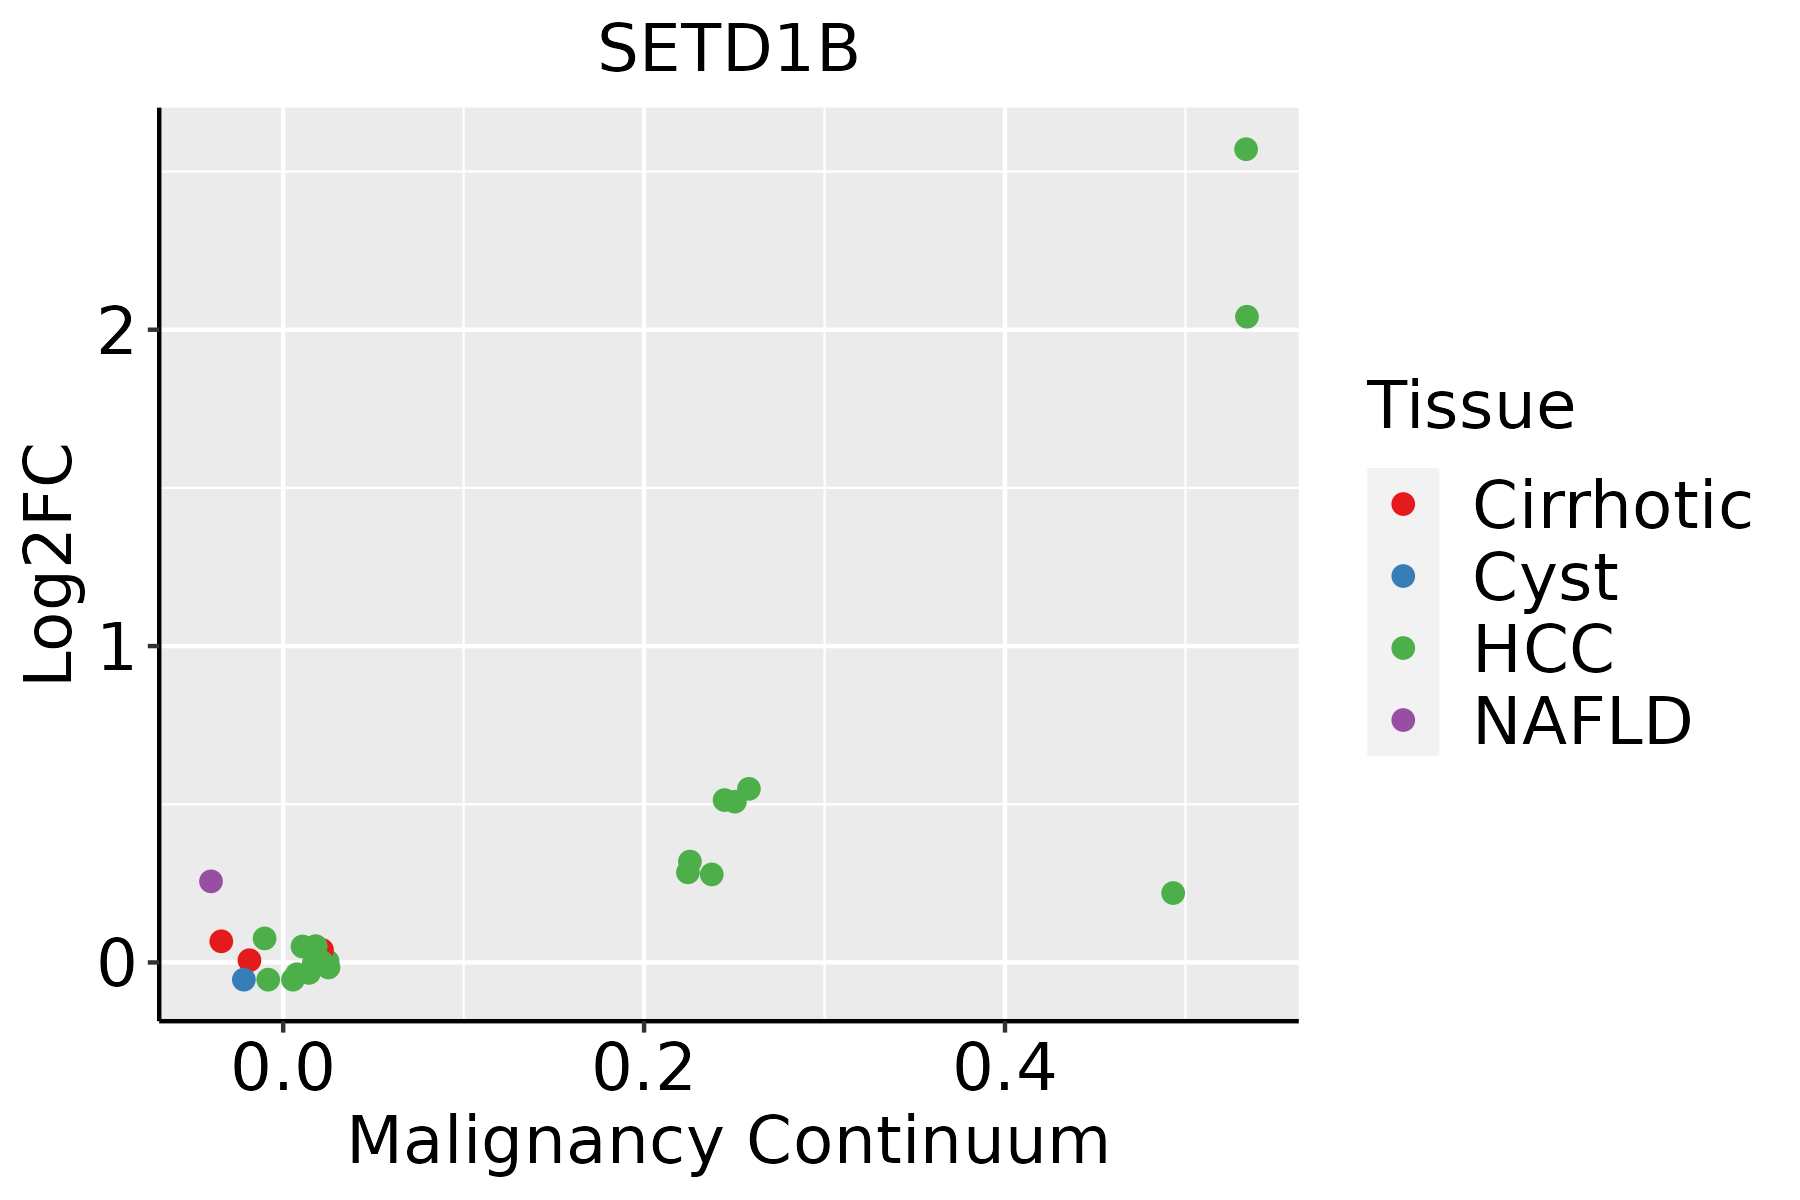 | HCC: Hepatocellular carcinoma |
| NAFLD: Non-alcoholic fatty liver disease |
| ∗log2FC in expression of this searched gene in stem-like cells from each diseased tissue sample relative to stem-like cells in normal samples in each tissue plotted against the malignancy continuum. Samples are colored based on if they are from different disease stage. |
Top |
Malignant transformation related pathway analysis |
| Find out the enriched GO biological processes and KEGG pathways involved in transition from healthy to precancer to cancer |
| Tissue | Disease Stage | Enriched GO biological Processes |
| Colorectum | AD |  |
| Colorectum | SER |  |
| Colorectum | MSS |  |
| Colorectum | MSI-H |  |
| Colorectum | FAP |  |
| ∗Top 15 enriched GO BP terms are showed in the bar plot of each disease state in each tissue. Each row represents a significant GO biological process which is colored according to the -log10(p.adjust). |
| Page: 1 2 3 4 5 6 7 8 9 |
| GO ID | Tissue | Disease Stage | Description | Gene Ratio | Bg Ratio | pvalue | p.adjust | Count |
| GO:001657021 | Liver | HCC | histone modification | 283/7958 | 463/18723 | 2.68e-16 | 2.33e-14 | 283 |
| GO:00182052 | Liver | HCC | peptidyl-lysine modification | 230/7958 | 376/18723 | 1.51e-13 | 8.32e-12 | 230 |
| GO:00434141 | Liver | HCC | macromolecule methylation | 183/7958 | 316/18723 | 2.00e-08 | 4.72e-07 | 183 |
| GO:0032259 | Liver | HCC | methylation | 206/7958 | 364/18723 | 3.35e-08 | 7.53e-07 | 206 |
| GO:00064792 | Liver | HCC | protein methylation | 111/7958 | 181/18723 | 2.36e-07 | 4.18e-06 | 111 |
| GO:00082132 | Liver | HCC | protein alkylation | 111/7958 | 181/18723 | 2.36e-07 | 4.18e-06 | 111 |
| GO:00165712 | Liver | HCC | histone methylation | 88/7958 | 141/18723 | 1.41e-06 | 2.02e-05 | 88 |
| GO:00349681 | Liver | HCC | histone lysine methylation | 70/7958 | 115/18723 | 5.32e-05 | 5.04e-04 | 70 |
| GO:00180221 | Liver | HCC | peptidyl-lysine methylation | 74/7958 | 131/18723 | 8.46e-04 | 5.06e-03 | 74 |
| GO:0051568 | Liver | HCC | histone H3-K4 methylation | 36/7958 | 59/18723 | 3.15e-03 | 1.46e-02 | 36 |
| Page: 1 |
| Pathway ID | Tissue | Disease Stage | Description | Gene Ratio | Bg Ratio | pvalue | p.adjust | qvalue | Count |
| hsa0031041 | Liver | HCC | Lysine degradation | 47/4020 | 63/8465 | 1.02e-05 | 7.58e-05 | 4.22e-05 | 47 |
| hsa0031051 | Liver | HCC | Lysine degradation | 47/4020 | 63/8465 | 1.02e-05 | 7.58e-05 | 4.22e-05 | 47 |
| Page: 1 |
Top |
Cell-cell communication analysis |
| Identification of potential cell-cell interactions between two cell types and their ligand-receptor pairs for different disease states |
| Ligand | Receptor | LRpair | Pathway | Tissue | Disease Stage |
| Page: 1 |
Top |
Single-cell gene regulatory network inference analysis |
| Find out the significant the regulons (TFs) and the target genes of each regulon across cell types for different disease states |
| TF | Cell Type | Tissue | Disease Stage | Target Gene | RSS | Regulon Activity |
| ∗The dot plots of a searched regulon are shown for all cell subpopulations in each disease state of each tissue based on the regulon specific score inferred using pySCENIC and by calculating the average expression. |
| Page: 1 |
Top |
Somatic mutation of malignant transformation related genes |
| Annotation of somatic variants for genes involved in malignant transformation |
| Hugo Symbol | Variant Class | Variant Classification | dbSNP RS | HGVSc | HGVSp | HGVSp Short | SWISSPROT | BIOTYPE | SIFT | PolyPhen | Tumor Sample Barcode | Tissue | Histology | Sex | Age | Stage | Therapy Types | Drugs | Outcome |
| SETD1B | SNV | Missense_Mutation | novel | c.3940G>A | p.Glu1314Lys | p.E1314K | Q9UPS6 | protein_coding | deleterious_low_confidence(0) | probably_damaging(0.972) | TCGA-5L-AAT1-01 | Breast | breast invasive carcinoma | Female | <65 | III/IV | Hormone Therapy | letrozol | SD |
| SETD1B | SNV | Missense_Mutation | novel | c.1649N>G | p.Ser550Cys | p.S550C | Q9UPS6 | protein_coding | deleterious(0) | probably_damaging(0.996) | TCGA-B6-A402-01 | Breast | breast invasive carcinoma | Female | <65 | I/II | Chemotherapy | cyclophosphamide | PD |
| SETD1B | SNV | Missense_Mutation | c.74N>A | p.Arg25Lys | p.R25K | Q9UPS6 | protein_coding | tolerated_low_confidence(0.2) | benign(0.003) | TCGA-E9-A1NG-01 | Breast | breast invasive carcinoma | Female | <65 | I/II | Hormone Therapy | letrozole | SD | |
| SETD1B | SNV | Missense_Mutation | rs777048615 | c.3463N>A | p.Glu1155Lys | p.E1155K | Q9UPS6 | protein_coding | tolerated_low_confidence(0.14) | benign(0.001) | TCGA-GM-A2DI-01 | Breast | breast invasive carcinoma | Female | <65 | I/II | Chemotherapy | taxotere | CR |
| SETD1B | deletion | Frame_Shift_Del | novel | c.818delN | p.Pro274ArgfsTer33 | p.P274Rfs*33 | Q9UPS6 | protein_coding | TCGA-D8-A27V-01 | Breast | breast invasive carcinoma | Female | <65 | I/II | Hormone Therapy | tamoxiphen | SD | ||
| SETD1B | SNV | Missense_Mutation | rs200717752 | c.931N>T | p.Arg311Trp | p.R311W | Q9UPS6 | protein_coding | deleterious(0.02) | probably_damaging(0.992) | TCGA-2W-A8YY-01 | Cervix | cervical & endocervical cancer | Female | <65 | I/II | Chemotherapy | cisplatin | CR |
| SETD1B | SNV | Missense_Mutation | novel | c.2659N>A | p.Val887Met | p.V887M | Q9UPS6 | protein_coding | tolerated(0.07) | benign(0.341) | TCGA-2W-A8YY-01 | Cervix | cervical & endocervical cancer | Female | <65 | I/II | Chemotherapy | cisplatin | CR |
| SETD1B | SNV | Missense_Mutation | novel | c.2777N>G | p.Asp926Gly | p.D926G | Q9UPS6 | protein_coding | tolerated(0.1) | possibly_damaging(0.76) | TCGA-2W-A8YY-01 | Cervix | cervical & endocervical cancer | Female | <65 | I/II | Chemotherapy | cisplatin | CR |
| SETD1B | SNV | Missense_Mutation | novel | c.3058N>T | p.Arg1020Trp | p.R1020W | Q9UPS6 | protein_coding | deleterious(0.02) | probably_damaging(0.948) | TCGA-2W-A8YY-01 | Cervix | cervical & endocervical cancer | Female | <65 | I/II | Chemotherapy | cisplatin | CR |
| SETD1B | SNV | Missense_Mutation | novel | c.1856N>A | p.Gly619Glu | p.G619E | Q9UPS6 | protein_coding | deleterious(0.02) | benign(0.276) | TCGA-EA-A3HS-01 | Cervix | cervical & endocervical cancer | Female | <65 | I/II | Unknown | Unknown | SD |
| Page: 1 2 3 4 5 6 7 8 9 10 11 |
Top |
Related drugs of malignant transformation related genes |
| Identification of chemicals and drugs interact with genes involved in malignant transfromation |
| (DGIdb 4.0) |
| Entrez ID | Symbol | Category | Interaction Types | Drug Claim Name | Drug Name | PMIDs |
| Page: 1 |

Copyright 2023-Present -The University of Texas Health Science Center at Houston |