
|
|||||
|
 | |
| |
| |
| |
| |
| |
|
Gene: SETBP1 |
Gene summary for SETBP1 |
| Gene information | Species | Human | Gene symbol | SETBP1 | Gene ID | 26040 |
| Gene name | SET binding protein 1 | |
| Gene Alias | MRD29 | |
| Cytomap | 18q12.3 | |
| Gene Type | protein-coding | GO ID | GO:0005575 | UniProtAcc | Q9Y6X0 |
Top |
Malignant transformation analysis |
| Identification of the aberrant gene expression in precancerous and cancerous lesions by comparing the gene expression of stem-like cells in diseased tissues with normal stem cells |
| Entrez ID | Symbol | Replicates | Species | Organ | Tissue | Adj P-value | Log2FC | Malignancy |
| 26040 | SETBP1 | CCI_1 | Human | Cervix | CC | 1.04e-09 | 8.84e-01 | 0.528 |
| 26040 | SETBP1 | CCI_3 | Human | Cervix | CC | 2.76e-05 | 6.29e-01 | 0.516 |
| 26040 | SETBP1 | T3 | Human | Cervix | CC | 9.28e-08 | 2.15e-01 | 0.1389 |
| 26040 | SETBP1 | HTA11_3410_2000001011 | Human | Colorectum | AD | 3.81e-14 | -5.36e-01 | 0.0155 |
| 26040 | SETBP1 | HTA11_696_2000001011 | Human | Colorectum | AD | 6.76e-09 | -4.44e-01 | -0.1464 |
| 26040 | SETBP1 | HTA11_866_3004761011 | Human | Colorectum | AD | 3.62e-08 | -4.06e-01 | 0.096 |
| 26040 | SETBP1 | HTA11_10711_2000001011 | Human | Colorectum | AD | 7.28e-03 | -3.92e-01 | 0.0338 |
| 26040 | SETBP1 | HTA11_7696_3000711011 | Human | Colorectum | AD | 2.54e-15 | -5.08e-01 | 0.0674 |
| 26040 | SETBP1 | HTA11_99999970781_79442 | Human | Colorectum | MSS | 6.70e-26 | -6.05e-01 | 0.294 |
| 26040 | SETBP1 | HTA11_99999971662_82457 | Human | Colorectum | MSS | 1.72e-25 | -5.93e-01 | 0.3859 |
| 26040 | SETBP1 | HTA11_99999973899_84307 | Human | Colorectum | MSS | 1.85e-06 | -6.06e-01 | 0.2585 |
| 26040 | SETBP1 | HTA11_99999974143_84620 | Human | Colorectum | MSS | 7.71e-21 | -5.91e-01 | 0.3005 |
| 26040 | SETBP1 | F007 | Human | Colorectum | FAP | 1.15e-14 | -6.22e-01 | 0.1176 |
| 26040 | SETBP1 | A002-C-010 | Human | Colorectum | FAP | 9.58e-24 | -5.64e-01 | 0.242 |
| 26040 | SETBP1 | A001-C-207 | Human | Colorectum | FAP | 3.02e-03 | -3.55e-01 | 0.1278 |
| 26040 | SETBP1 | A015-C-203 | Human | Colorectum | FAP | 1.73e-18 | -4.20e-01 | -0.1294 |
| 26040 | SETBP1 | A015-C-204 | Human | Colorectum | FAP | 3.72e-03 | -2.78e-01 | -0.0228 |
| 26040 | SETBP1 | A014-C-040 | Human | Colorectum | FAP | 6.79e-05 | -5.71e-01 | -0.1184 |
| 26040 | SETBP1 | A002-C-201 | Human | Colorectum | FAP | 2.88e-23 | -6.04e-01 | 0.0324 |
| 26040 | SETBP1 | A002-C-203 | Human | Colorectum | FAP | 6.50e-26 | -5.98e-01 | 0.2786 |
| Page: 1 2 3 4 5 |
| Tissue | Expression Dynamics | Abbreviation |
| Cervix | 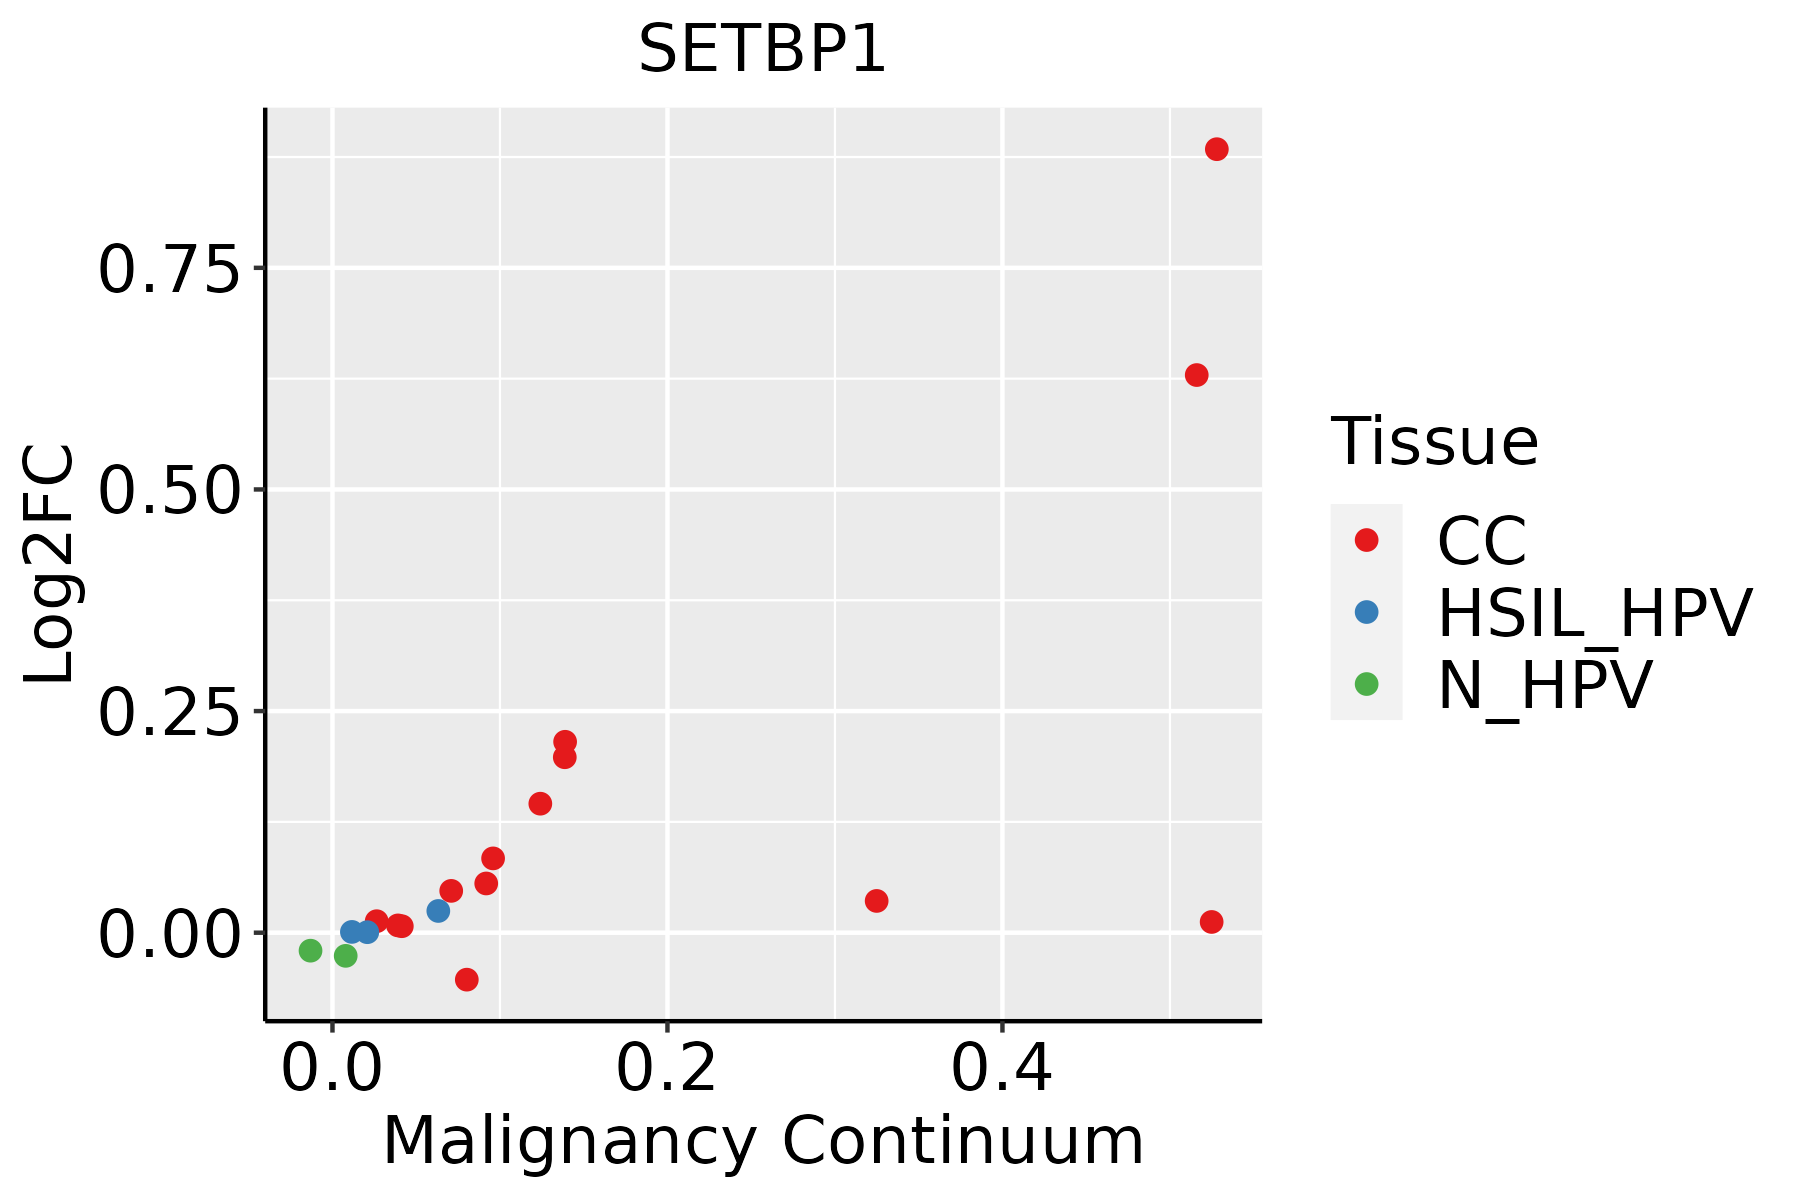 | CC: Cervix cancer |
| HSIL_HPV: HPV-infected high-grade squamous intraepithelial lesions | ||
| N_HPV: HPV-infected normal cervix | ||
| Colorectum (GSE201348) |  | FAP: Familial adenomatous polyposis |
| CRC: Colorectal cancer | ||
| Colorectum (HTA11) |  | AD: Adenomas |
| SER: Sessile serrated lesions | ||
| MSI-H: Microsatellite-high colorectal cancer | ||
| MSS: Microsatellite stable colorectal cancer | ||
| Liver | 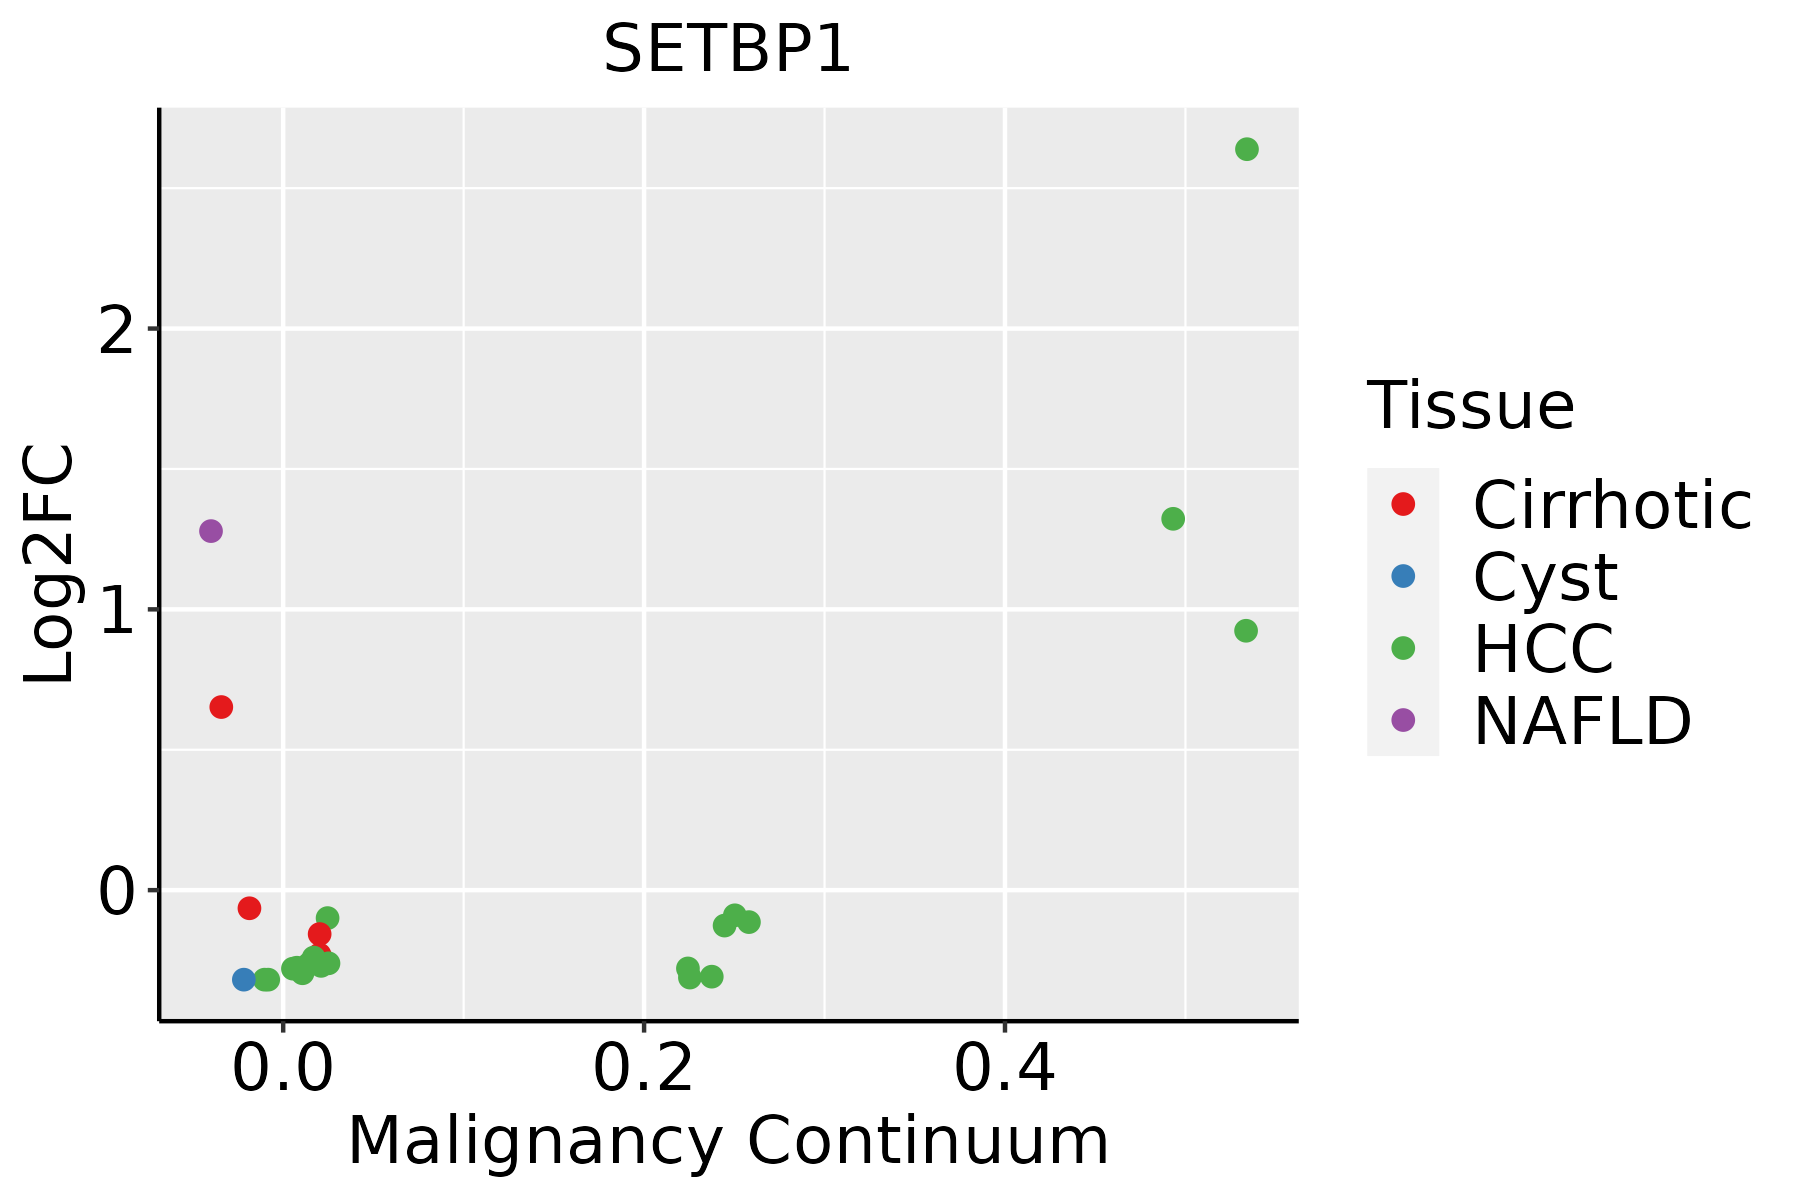 | HCC: Hepatocellular carcinoma |
| NAFLD: Non-alcoholic fatty liver disease | ||
| Oral Cavity |  | EOLP: Erosive Oral lichen planus |
| LP: leukoplakia | ||
| NEOLP: Non-erosive oral lichen planus | ||
| OSCC: Oral squamous cell carcinoma | ||
| Prostate |  | BPH: Benign Prostatic Hyperplasia |
| Thyroid | 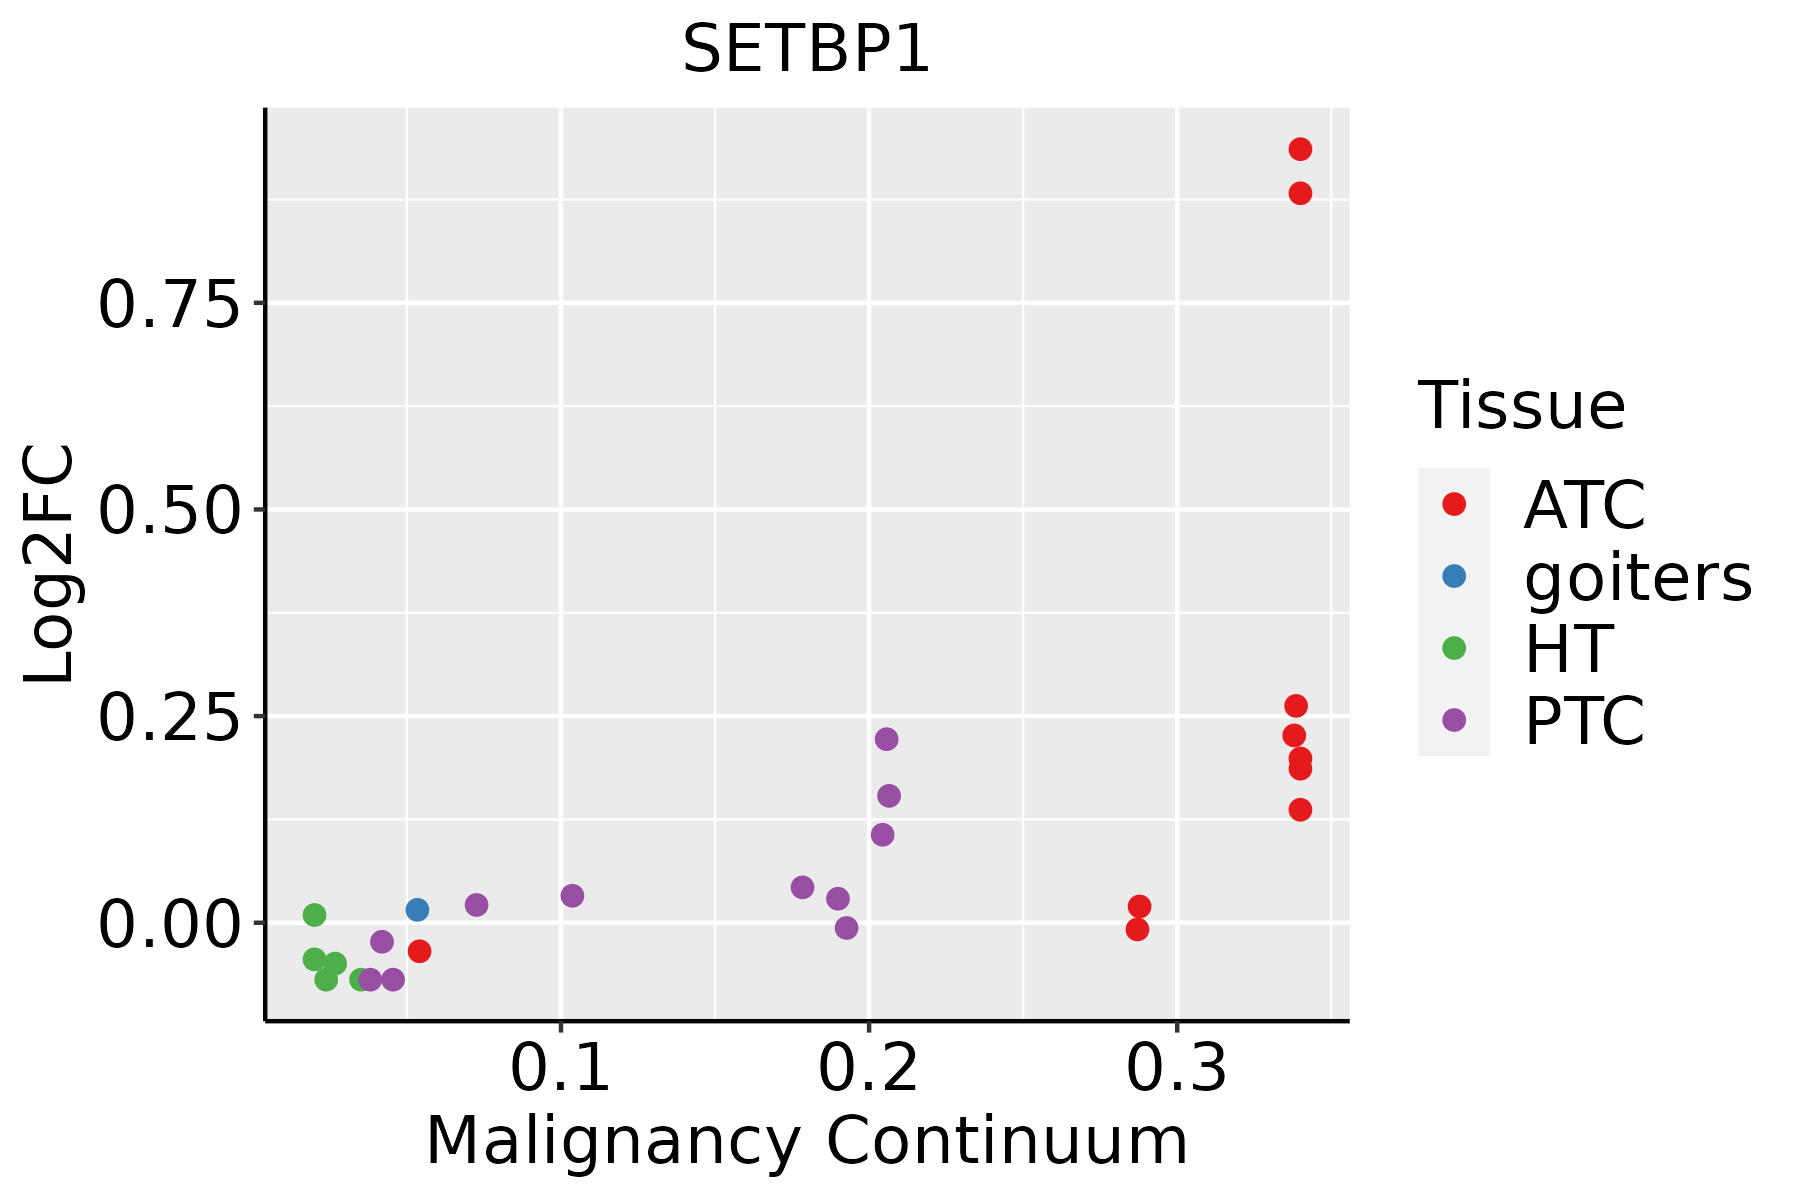 | ATC: Anaplastic thyroid cancer |
| HT: Hashimoto's thyroiditis | ||
| PTC: Papillary thyroid cancer |
| ∗log2FC in expression of this searched gene in stem-like cells from each diseased tissue sample relative to stem-like cells in normal samples in each tissue plotted against the malignancy continuum. Samples are colored based on if they are from different disease stage. |
Top |
Malignant transformation related pathway analysis |
| Find out the enriched GO biological processes and KEGG pathways involved in transition from healthy to precancer to cancer |
| Tissue | Disease Stage | Enriched GO biological Processes |
| Colorectum | AD |  |
| Colorectum | SER |  |
| Colorectum | MSS |  |
| Colorectum | MSI-H |  |
| Colorectum | FAP |  |
| ∗Top 15 enriched GO BP terms are showed in the bar plot of each disease state in each tissue. Each row represents a significant GO biological process which is colored according to the -log10(p.adjust). |
| Page: 1 2 3 4 5 6 7 8 9 |
| GO ID | Tissue | Disease Stage | Description | Gene Ratio | Bg Ratio | pvalue | p.adjust | Count |
| Page: 1 |
| Pathway ID | Tissue | Disease Stage | Description | Gene Ratio | Bg Ratio | pvalue | p.adjust | qvalue | Count |
| Page: 1 |
Top |
Cell-cell communication analysis |
| Identification of potential cell-cell interactions between two cell types and their ligand-receptor pairs for different disease states |
| Ligand | Receptor | LRpair | Pathway | Tissue | Disease Stage |
| Page: 1 |
Top |
Single-cell gene regulatory network inference analysis |
| Find out the significant the regulons (TFs) and the target genes of each regulon across cell types for different disease states |
| TF | Cell Type | Tissue | Disease Stage | Target Gene | RSS | Regulon Activity |
| SETBP1 | MYOFIB | Stomach | CAG | ZEB2,PDE1A,UNC5D, etc. | 1.92e-01 |  |
| SETBP1 | MYOFIB | Stomach | GC | ZEB2,PDE1A,UNC5D, etc. | 3.28e-01 |  |
| ∗The dot plots of a searched regulon are shown for all cell subpopulations in each disease state of each tissue based on the regulon specific score inferred using pySCENIC and by calculating the average expression. |
| Page: 1 |
Top |
Somatic mutation of malignant transformation related genes |
| Annotation of somatic variants for genes involved in malignant transformation |
| Hugo Symbol | Variant Class | Variant Classification | dbSNP RS | HGVSc | HGVSp | HGVSp Short | SWISSPROT | BIOTYPE | SIFT | PolyPhen | Tumor Sample Barcode | Tissue | Histology | Sex | Age | Stage | Therapy Types | Drugs | Outcome |
| SETBP1 | SNV | Missense_Mutation | c.3982N>A | p.Asp1328Asn | p.D1328N | Q9Y6X0 | protein_coding | tolerated(0.3) | benign(0.265) | TCGA-A8-A06Q-01 | Breast | breast invasive carcinoma | Female | <65 | III/IV | Unknown | Unknown | SD | |
| SETBP1 | SNV | Missense_Mutation | c.4356N>C | p.Lys1452Asn | p.K1452N | Q9Y6X0 | protein_coding | deleterious(0) | possibly_damaging(0.889) | TCGA-A8-A09I-01 | Breast | breast invasive carcinoma | Female | >=65 | I/II | Hormone Therapy | anastrozole | SD | |
| SETBP1 | SNV | Missense_Mutation | novel | c.2264A>G | p.Gln755Arg | p.Q755R | Q9Y6X0 | protein_coding | tolerated(0.05) | possibly_damaging(0.642) | TCGA-A8-A09W-01 | Breast | breast invasive carcinoma | Female | >=65 | III/IV | Unknown | Unknown | SD |
| SETBP1 | SNV | Missense_Mutation | c.2969T>C | p.Phe990Ser | p.F990S | Q9Y6X0 | protein_coding | deleterious(0) | probably_damaging(0.925) | TCGA-A8-A0A4-01 | Breast | breast invasive carcinoma | Female | >=65 | I/II | Hormone Therapy | tamoxiphen | CR | |
| SETBP1 | SNV | Missense_Mutation | c.335N>A | p.Arg112Gln | p.R112Q | Q9Y6X0 | protein_coding | deleterious(0) | probably_damaging(0.998) | TCGA-AC-A2B8-01 | Breast | breast invasive carcinoma | Female | >=65 | I/II | Chemotherapy | chemo | PD | |
| SETBP1 | SNV | Missense_Mutation | novel | c.3215N>A | p.Pro1072His | p.P1072H | Q9Y6X0 | protein_coding | deleterious(0) | probably_damaging(0.999) | TCGA-AN-A046-01 | Breast | breast invasive carcinoma | Female | >=65 | I/II | Unknown | Unknown | SD |
| SETBP1 | SNV | Missense_Mutation | c.4762N>G | p.Arg1588Gly | p.R1588G | Q9Y6X0 | protein_coding | deleterious_low_confidence(0) | probably_damaging(0.914) | TCGA-D8-A147-01 | Breast | breast invasive carcinoma | Female | <65 | I/II | Chemotherapy | doxorubicine | SD | |
| SETBP1 | SNV | Missense_Mutation | c.3280C>G | p.Gln1094Glu | p.Q1094E | Q9Y6X0 | protein_coding | deleterious(0.01) | benign(0.011) | TCGA-D8-A1J8-01 | Breast | breast invasive carcinoma | Female | >=65 | I/II | Hormone Therapy | nolvadex | SD | |
| SETBP1 | SNV | Missense_Mutation | rs777904911 | c.3689N>T | p.Thr1230Ile | p.T1230I | Q9Y6X0 | protein_coding | deleterious(0.01) | possibly_damaging(0.839) | TCGA-EW-A1IZ-01 | Breast | breast invasive carcinoma | Female | <65 | III/IV | Chemotherapy | taxotere | SD |
| SETBP1 | insertion | Nonsense_Mutation | novel | c.2266_2267insACTAAGAAAAGAAAG | p.Pro756delinsHisTerGluLysLysAla | p.P756delinsH*EKKA | Q9Y6X0 | protein_coding | TCGA-A8-A09W-01 | Breast | breast invasive carcinoma | Female | >=65 | III/IV | Unknown | Unknown | SD |
| Page: 1 2 3 4 5 6 7 8 9 10 11 12 13 14 15 16 17 18 19 20 21 22 23 24 25 26 |
Top |
Related drugs of malignant transformation related genes |
| Identification of chemicals and drugs interact with genes involved in malignant transfromation |
| (DGIdb 4.0) |
| Entrez ID | Symbol | Category | Interaction Types | Drug Claim Name | Drug Name | PMIDs |
| 26040 | SETBP1 | CLINICALLY ACTIONABLE | N/A | 23832012 |
| Page: 1 |

Copyright 2023-Present -The University of Texas Health Science Center at Houston |