
|
|||||
|
 | |
| |
| |
| |
| |
| |
|
Gene: SESN3 |
Gene summary for SESN3 |
| Gene information | Species | Human | Gene symbol | SESN3 | Gene ID | 143686 |
| Gene name | sestrin 3 | |
| Gene Alias | SEST3 | |
| Cytomap | 11q21 | |
| Gene Type | protein-coding | GO ID | GO:0000302 | UniProtAcc | P58005 |
Top |
Malignant transformation analysis |
| Identification of the aberrant gene expression in precancerous and cancerous lesions by comparing the gene expression of stem-like cells in diseased tissues with normal stem cells |
| Entrez ID | Symbol | Replicates | Species | Organ | Tissue | Adj P-value | Log2FC | Malignancy |
| 143686 | SESN3 | LZE4T | Human | Esophagus | ESCC | 1.49e-09 | 6.35e-01 | 0.0811 |
| 143686 | SESN3 | LZE8T | Human | Esophagus | ESCC | 2.11e-02 | -7.84e-02 | 0.067 |
| 143686 | SESN3 | LZE22D1 | Human | Esophagus | HGIN | 2.85e-02 | -1.22e-01 | 0.0595 |
| 143686 | SESN3 | LZE22T | Human | Esophagus | ESCC | 2.99e-03 | 3.46e-02 | 0.068 |
| 143686 | SESN3 | LZE24T | Human | Esophagus | ESCC | 3.64e-12 | 8.05e-01 | 0.0596 |
| 143686 | SESN3 | LZE21T | Human | Esophagus | ESCC | 7.33e-04 | 8.28e-03 | 0.0655 |
| 143686 | SESN3 | LZE6T | Human | Esophagus | ESCC | 4.72e-02 | -1.57e-01 | 0.0845 |
| 143686 | SESN3 | P2T-E | Human | Esophagus | ESCC | 2.43e-09 | 1.24e-01 | 0.1177 |
| 143686 | SESN3 | P4T-E | Human | Esophagus | ESCC | 8.73e-53 | 1.97e+00 | 0.1323 |
| 143686 | SESN3 | P5T-E | Human | Esophagus | ESCC | 4.67e-28 | 6.56e-01 | 0.1327 |
| 143686 | SESN3 | P8T-E | Human | Esophagus | ESCC | 1.45e-13 | 4.22e-01 | 0.0889 |
| 143686 | SESN3 | P9T-E | Human | Esophagus | ESCC | 2.20e-11 | 4.00e-01 | 0.1131 |
| 143686 | SESN3 | P10T-E | Human | Esophagus | ESCC | 4.50e-20 | 5.16e-01 | 0.116 |
| 143686 | SESN3 | P11T-E | Human | Esophagus | ESCC | 1.18e-08 | 8.22e-01 | 0.1426 |
| 143686 | SESN3 | P12T-E | Human | Esophagus | ESCC | 5.70e-33 | 9.21e-01 | 0.1122 |
| 143686 | SESN3 | P15T-E | Human | Esophagus | ESCC | 8.53e-19 | 7.06e-01 | 0.1149 |
| 143686 | SESN3 | P16T-E | Human | Esophagus | ESCC | 4.06e-13 | 1.99e-01 | 0.1153 |
| 143686 | SESN3 | P20T-E | Human | Esophagus | ESCC | 8.11e-10 | 3.25e-01 | 0.1124 |
| 143686 | SESN3 | P21T-E | Human | Esophagus | ESCC | 6.92e-27 | 8.64e-01 | 0.1617 |
| 143686 | SESN3 | P22T-E | Human | Esophagus | ESCC | 9.08e-28 | 2.75e-01 | 0.1236 |
| Page: 1 2 3 4 5 6 |
| Tissue | Expression Dynamics | Abbreviation |
| Esophagus | 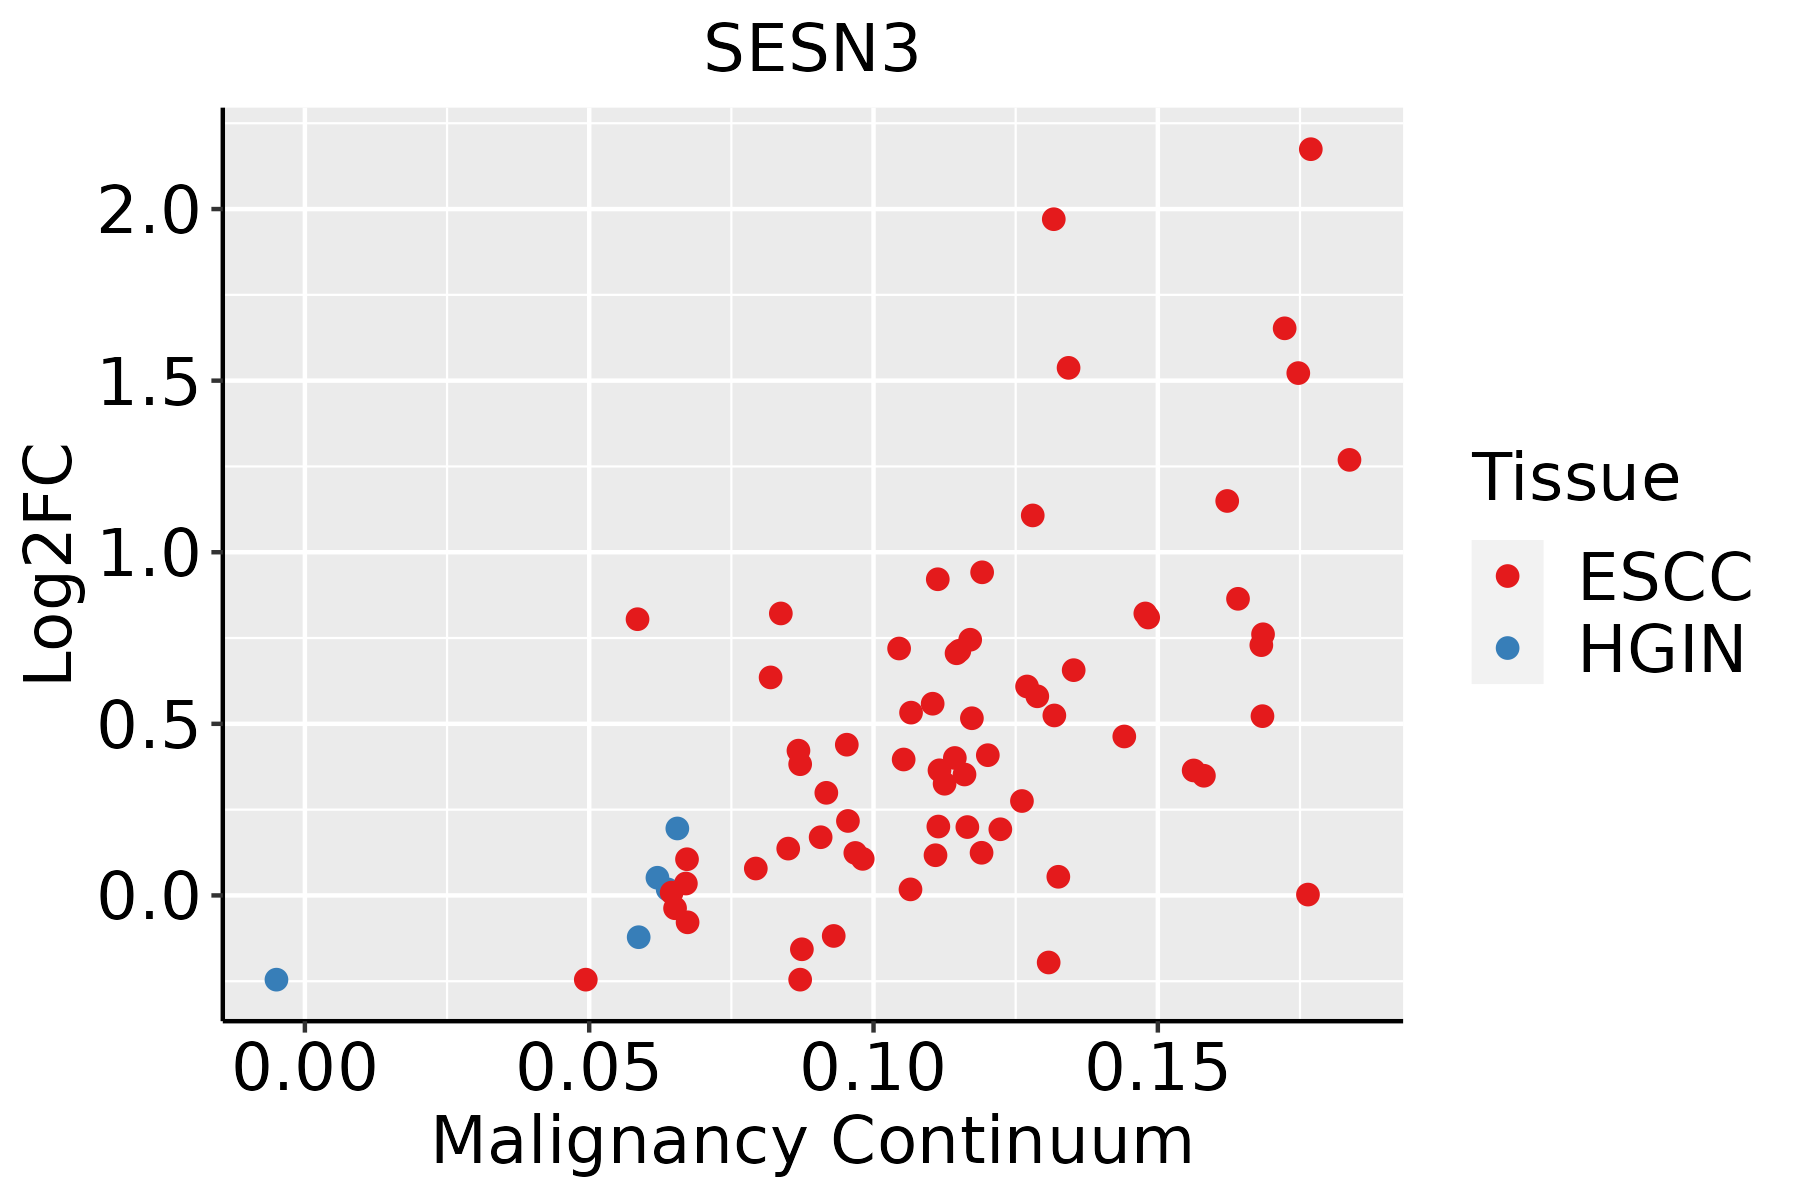 | ESCC: Esophageal squamous cell carcinoma |
| HGIN: High-grade intraepithelial neoplasias | ||
| LGIN: Low-grade intraepithelial neoplasias | ||
| Lung | 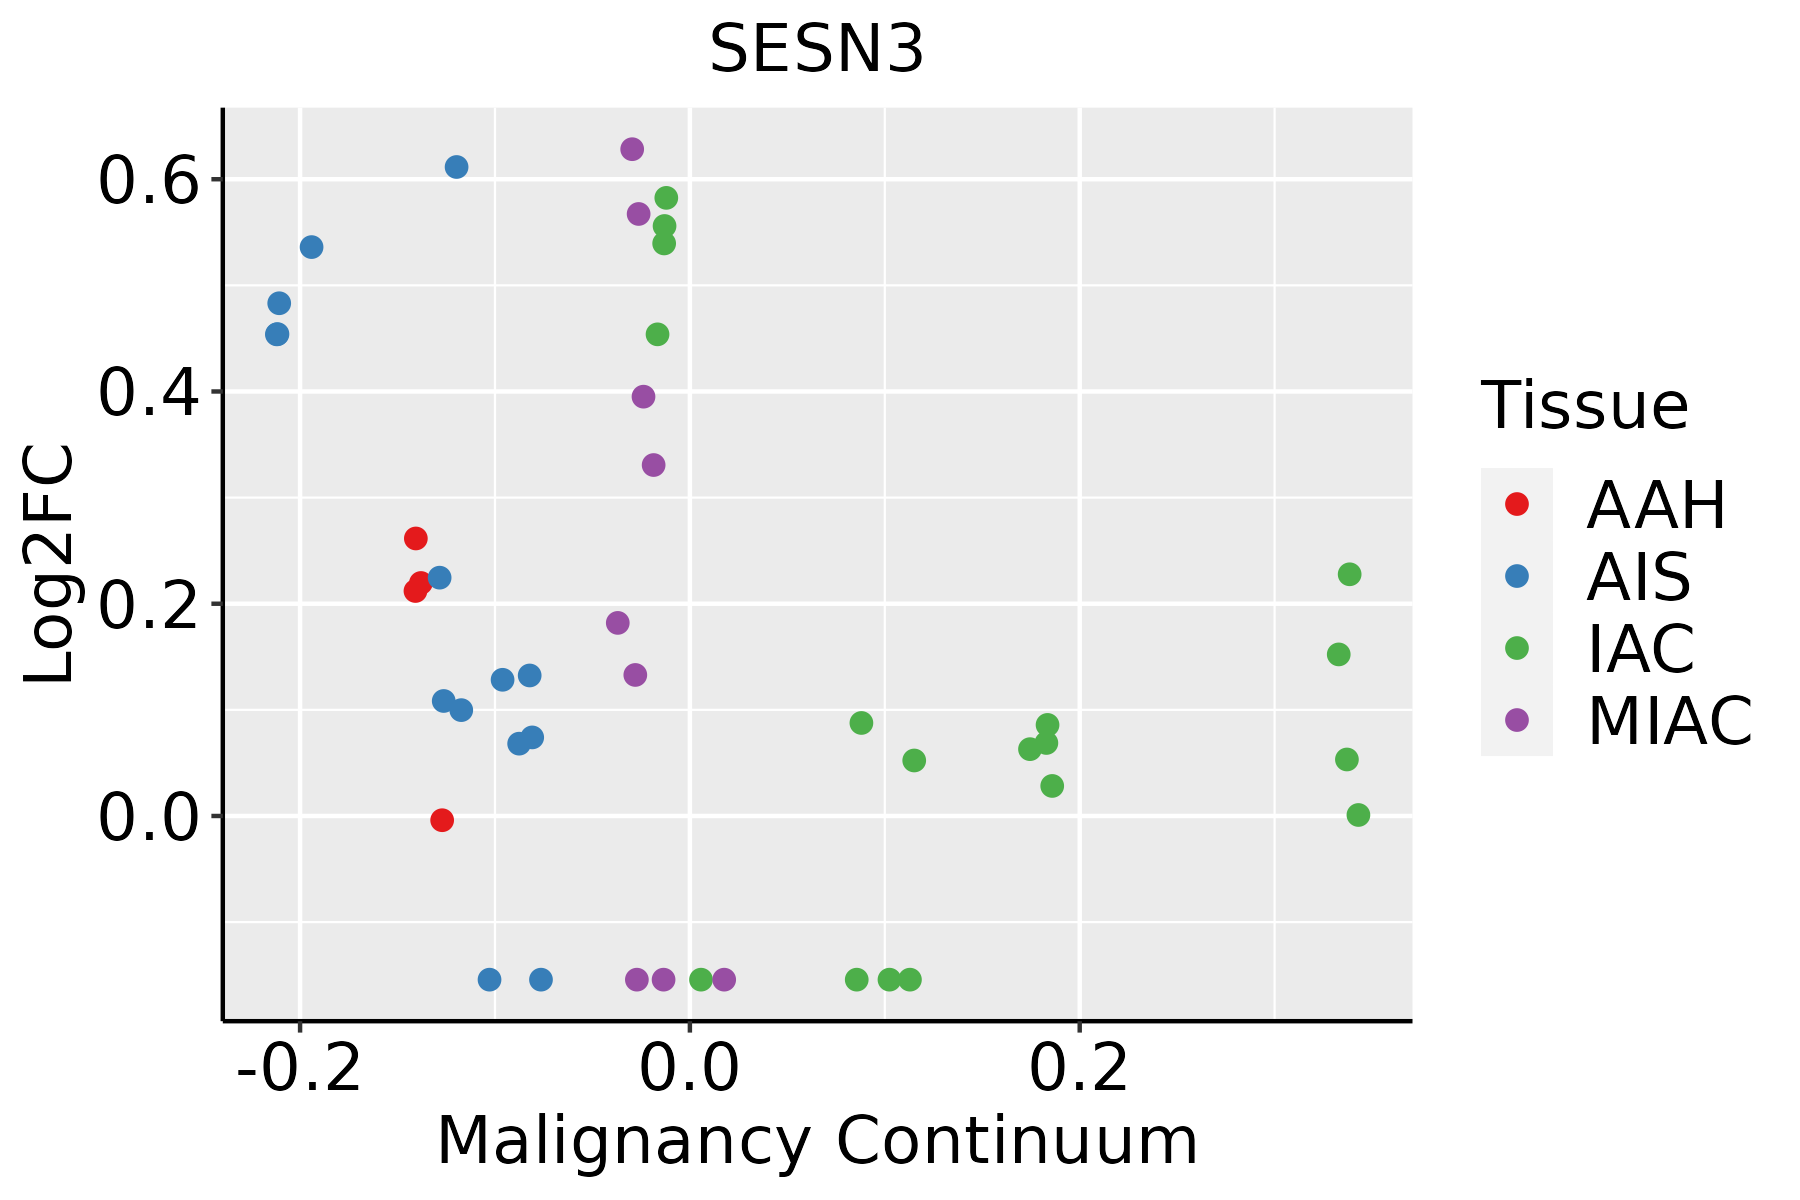 | AAH: Atypical adenomatous hyperplasia |
| AIS: Adenocarcinoma in situ | ||
| IAC: Invasive lung adenocarcinoma | ||
| MIA: Minimally invasive adenocarcinoma | ||
| Oral Cavity |  | EOLP: Erosive Oral lichen planus |
| LP: leukoplakia | ||
| NEOLP: Non-erosive oral lichen planus | ||
| OSCC: Oral squamous cell carcinoma | ||
| Prostate | 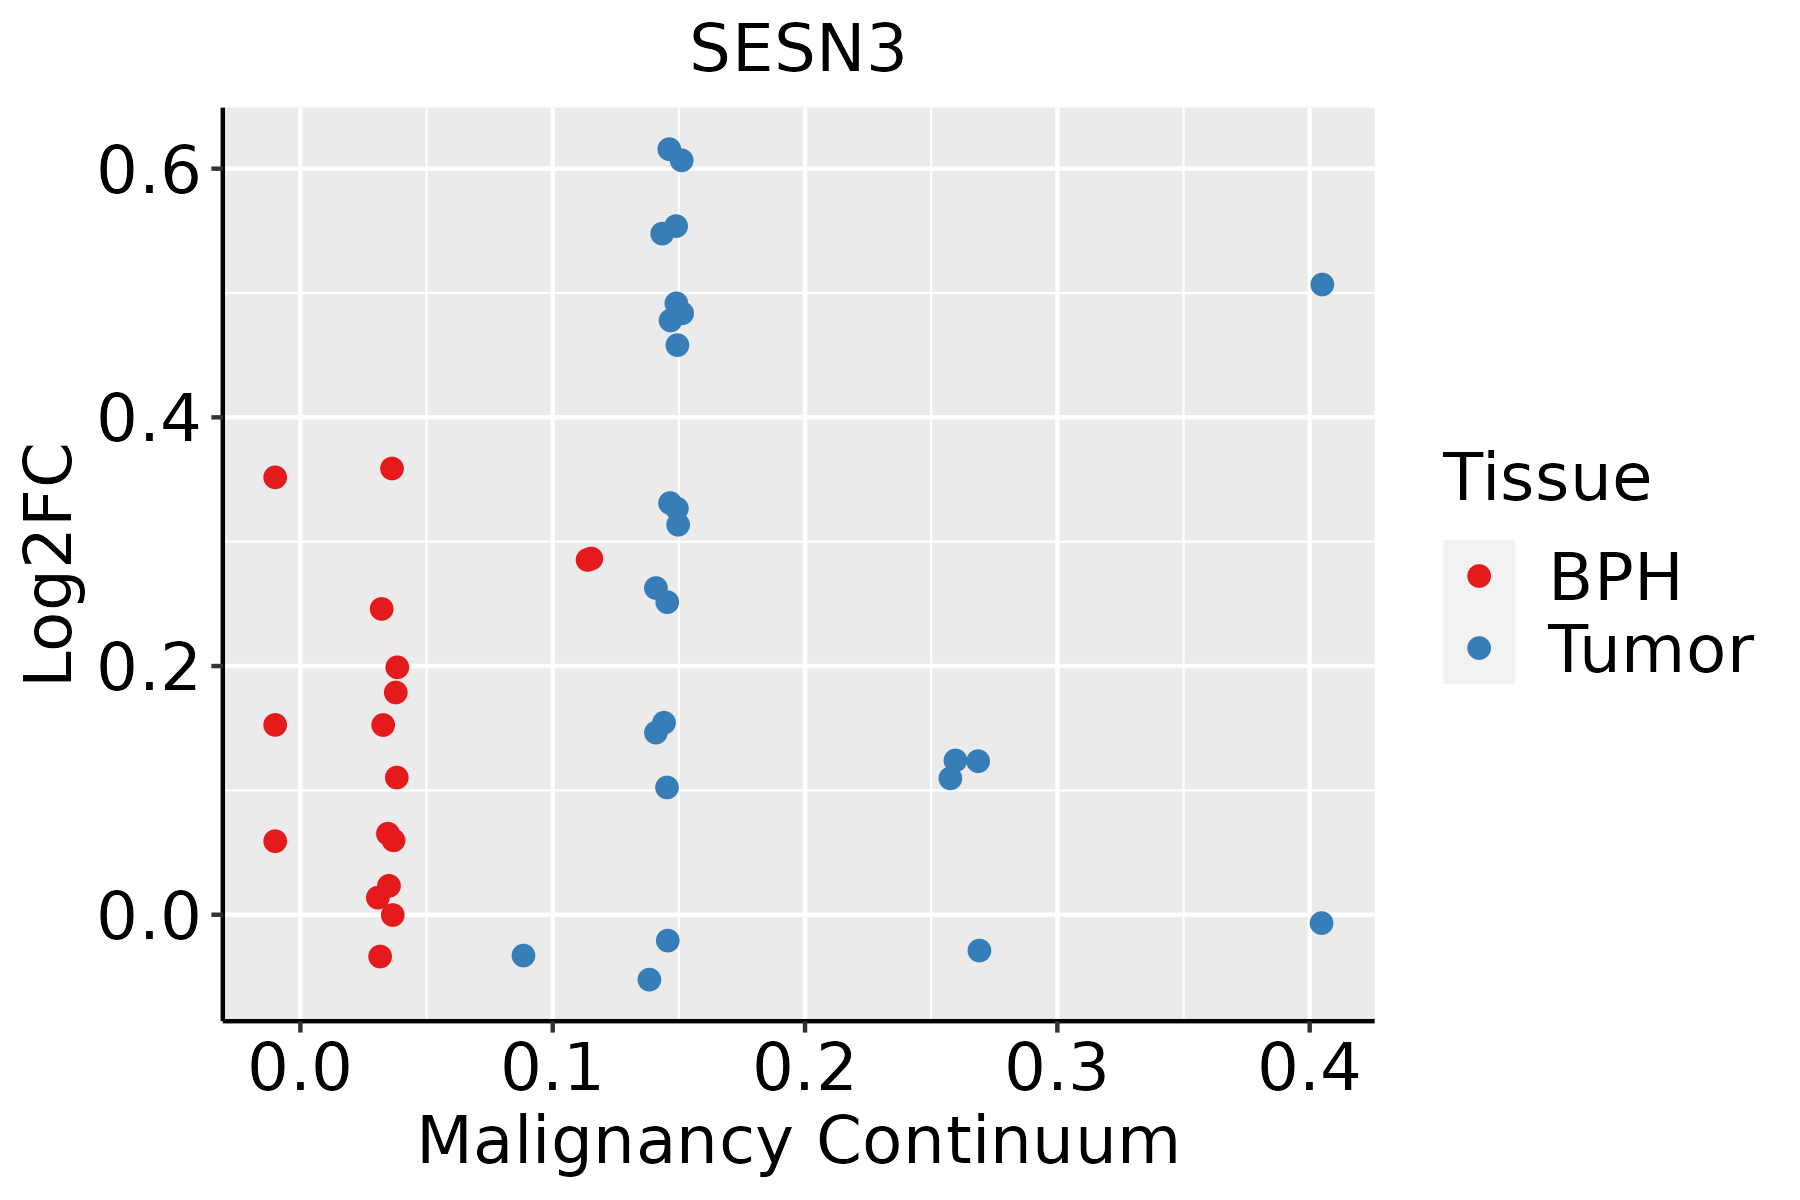 | BPH: Benign Prostatic Hyperplasia |
| Skin |  | AK: Actinic keratosis |
| cSCC: Cutaneous squamous cell carcinoma | ||
| SCCIS:squamous cell carcinoma in situ | ||
| Thyroid |  | ATC: Anaplastic thyroid cancer |
| HT: Hashimoto's thyroiditis | ||
| PTC: Papillary thyroid cancer |
| ∗log2FC in expression of this searched gene in stem-like cells from each diseased tissue sample relative to stem-like cells in normal samples in each tissue plotted against the malignancy continuum. Samples are colored based on if they are from different disease stage. |
Top |
Malignant transformation related pathway analysis |
| Find out the enriched GO biological processes and KEGG pathways involved in transition from healthy to precancer to cancer |
| Tissue | Disease Stage | Enriched GO biological Processes |
| Colorectum | AD |  |
| Colorectum | SER |  |
| Colorectum | MSS |  |
| Colorectum | MSI-H |  |
| Colorectum | FAP |  |
| ∗Top 15 enriched GO BP terms are showed in the bar plot of each disease state in each tissue. Each row represents a significant GO biological process which is colored according to the -log10(p.adjust). |
| Page: 1 2 3 4 5 6 7 8 9 |
| GO ID | Tissue | Disease Stage | Description | Gene Ratio | Bg Ratio | pvalue | p.adjust | Count |
| GO:000989626 | Esophagus | HGIN | positive regulation of catabolic process | 126/2587 | 492/18723 | 1.46e-12 | 2.09e-10 | 126 |
| GO:003133126 | Esophagus | HGIN | positive regulation of cellular catabolic process | 112/2587 | 427/18723 | 5.15e-12 | 6.72e-10 | 112 |
| GO:001050616 | Esophagus | HGIN | regulation of autophagy | 84/2587 | 317/18723 | 1.39e-09 | 1.08e-07 | 84 |
| GO:000697927 | Esophagus | HGIN | response to oxidative stress | 107/2587 | 446/18723 | 3.91e-09 | 2.76e-07 | 107 |
| GO:001623616 | Esophagus | HGIN | macroautophagy | 77/2587 | 291/18723 | 7.15e-09 | 4.61e-07 | 77 |
| GO:007149626 | Esophagus | HGIN | cellular response to external stimulus | 71/2587 | 320/18723 | 2.77e-05 | 7.19e-04 | 71 |
| GO:00162418 | Esophagus | HGIN | regulation of macroautophagy | 38/2587 | 141/18723 | 2.80e-05 | 7.21e-04 | 38 |
| GO:000030226 | Esophagus | HGIN | response to reactive oxygen species | 52/2587 | 222/18723 | 7.30e-05 | 1.66e-03 | 52 |
| GO:003166820 | Esophagus | HGIN | cellular response to extracellular stimulus | 56/2587 | 246/18723 | 9.05e-05 | 1.97e-03 | 56 |
| GO:003166920 | Esophagus | HGIN | cellular response to nutrient levels | 47/2587 | 215/18723 | 8.20e-04 | 1.07e-02 | 47 |
| GO:003166726 | Esophagus | HGIN | response to nutrient levels | 89/2587 | 474/18723 | 1.41e-03 | 1.64e-02 | 89 |
| GO:004343420 | Esophagus | HGIN | response to peptide hormone | 79/2587 | 414/18723 | 1.60e-03 | 1.79e-02 | 79 |
| GO:190165318 | Esophagus | HGIN | cellular response to peptide | 68/2587 | 359/18723 | 3.88e-03 | 3.54e-02 | 68 |
| GO:000926719 | Esophagus | HGIN | cellular response to starvation | 34/2587 | 156/18723 | 4.21e-03 | 3.77e-02 | 34 |
| GO:004259418 | Esophagus | HGIN | response to starvation | 41/2587 | 197/18723 | 4.34e-03 | 3.84e-02 | 41 |
| GO:00105088 | Esophagus | HGIN | positive regulation of autophagy | 28/2587 | 124/18723 | 5.34e-03 | 4.39e-02 | 28 |
| GO:001623617 | Esophagus | ESCC | macroautophagy | 216/8552 | 291/18723 | 1.94e-23 | 4.57e-21 | 216 |
| GO:0009896111 | Esophagus | ESCC | positive regulation of catabolic process | 332/8552 | 492/18723 | 4.36e-23 | 9.22e-21 | 332 |
| GO:0006979111 | Esophagus | ESCC | response to oxidative stress | 303/8552 | 446/18723 | 7.15e-22 | 1.30e-19 | 303 |
| GO:0031331111 | Esophagus | ESCC | positive regulation of cellular catabolic process | 292/8552 | 427/18723 | 8.67e-22 | 1.53e-19 | 292 |
| Page: 1 2 3 4 5 6 7 8 9 10 11 12 13 14 15 16 17 |
| Pathway ID | Tissue | Disease Stage | Description | Gene Ratio | Bg Ratio | pvalue | p.adjust | qvalue | Count |
| hsa0411510 | Esophagus | HGIN | p53 signaling pathway | 21/1383 | 74/8465 | 6.25e-03 | 4.25e-02 | 3.37e-02 | 21 |
| hsa0411515 | Esophagus | HGIN | p53 signaling pathway | 21/1383 | 74/8465 | 6.25e-03 | 4.25e-02 | 3.37e-02 | 21 |
| hsa0411524 | Esophagus | ESCC | p53 signaling pathway | 65/4205 | 74/8465 | 3.88e-12 | 6.50e-11 | 3.33e-11 | 65 |
| hsa0421114 | Esophagus | ESCC | Longevity regulating pathway | 58/4205 | 89/8465 | 2.19e-03 | 6.16e-03 | 3.16e-03 | 58 |
| hsa0411534 | Esophagus | ESCC | p53 signaling pathway | 65/4205 | 74/8465 | 3.88e-12 | 6.50e-11 | 3.33e-11 | 65 |
| hsa0421115 | Esophagus | ESCC | Longevity regulating pathway | 58/4205 | 89/8465 | 2.19e-03 | 6.16e-03 | 3.16e-03 | 58 |
| hsa041159 | Oral cavity | OSCC | p53 signaling pathway | 57/3704 | 74/8465 | 4.99e-09 | 5.07e-08 | 2.58e-08 | 57 |
| hsa0421110 | Oral cavity | OSCC | Longevity regulating pathway | 54/3704 | 89/8465 | 9.24e-04 | 2.65e-03 | 1.35e-03 | 54 |
| hsa0411514 | Oral cavity | OSCC | p53 signaling pathway | 57/3704 | 74/8465 | 4.99e-09 | 5.07e-08 | 2.58e-08 | 57 |
| hsa0421113 | Oral cavity | OSCC | Longevity regulating pathway | 54/3704 | 89/8465 | 9.24e-04 | 2.65e-03 | 1.35e-03 | 54 |
| hsa0411523 | Oral cavity | LP | p53 signaling pathway | 38/2418 | 74/8465 | 2.82e-05 | 1.92e-04 | 1.24e-04 | 38 |
| hsa0411533 | Oral cavity | LP | p53 signaling pathway | 38/2418 | 74/8465 | 2.82e-05 | 1.92e-04 | 1.24e-04 | 38 |
| hsa041158 | Prostate | BPH | p53 signaling pathway | 30/1718 | 74/8465 | 5.15e-05 | 3.40e-04 | 2.10e-04 | 30 |
| hsa042119 | Prostate | BPH | Longevity regulating pathway | 27/1718 | 89/8465 | 1.57e-02 | 4.42e-02 | 2.73e-02 | 27 |
| hsa0411513 | Prostate | BPH | p53 signaling pathway | 30/1718 | 74/8465 | 5.15e-05 | 3.40e-04 | 2.10e-04 | 30 |
| hsa0421112 | Prostate | BPH | Longevity regulating pathway | 27/1718 | 89/8465 | 1.57e-02 | 4.42e-02 | 2.73e-02 | 27 |
| hsa0411522 | Prostate | Tumor | p53 signaling pathway | 29/1791 | 74/8465 | 2.99e-04 | 1.65e-03 | 1.02e-03 | 29 |
| hsa0411532 | Prostate | Tumor | p53 signaling pathway | 29/1791 | 74/8465 | 2.99e-04 | 1.65e-03 | 1.02e-03 | 29 |
| Page: 1 |
Top |
Cell-cell communication analysis |
| Identification of potential cell-cell interactions between two cell types and their ligand-receptor pairs for different disease states |
| Ligand | Receptor | LRpair | Pathway | Tissue | Disease Stage |
| Page: 1 |
Top |
Single-cell gene regulatory network inference analysis |
| Find out the significant the regulons (TFs) and the target genes of each regulon across cell types for different disease states |
| TF | Cell Type | Tissue | Disease Stage | Target Gene | RSS | Regulon Activity |
| ∗The dot plots of a searched regulon are shown for all cell subpopulations in each disease state of each tissue based on the regulon specific score inferred using pySCENIC and by calculating the average expression. |
| Page: 1 |
Top |
Somatic mutation of malignant transformation related genes |
| Annotation of somatic variants for genes involved in malignant transformation |
| Hugo Symbol | Variant Class | Variant Classification | dbSNP RS | HGVSc | HGVSp | HGVSp Short | SWISSPROT | BIOTYPE | SIFT | PolyPhen | Tumor Sample Barcode | Tissue | Histology | Sex | Age | Stage | Therapy Types | Drugs | Outcome |
| SESN3 | SNV | Missense_Mutation | novel | c.474N>G | p.Ile158Met | p.I158M | P58005 | protein_coding | deleterious(0) | possibly_damaging(0.859) | TCGA-AN-A046-01 | Breast | breast invasive carcinoma | Female | >=65 | I/II | Unknown | Unknown | SD |
| SESN3 | SNV | Missense_Mutation | c.494N>A | p.Arg165Gln | p.R165Q | P58005 | protein_coding | deleterious(0.04) | probably_damaging(0.997) | TCGA-2W-A8YY-01 | Cervix | cervical & endocervical cancer | Female | <65 | I/II | Chemotherapy | cisplatin | CR | |
| SESN3 | SNV | Missense_Mutation | novel | c.343G>A | p.Ala115Thr | p.A115T | P58005 | protein_coding | deleterious(0) | probably_damaging(0.999) | TCGA-EA-A410-01 | Cervix | cervical & endocervical cancer | Female | <65 | I/II | Unknown | Unknown | SD |
| SESN3 | SNV | Missense_Mutation | c.128N>G | p.Phe43Cys | p.F43C | P58005 | protein_coding | deleterious(0) | probably_damaging(0.998) | TCGA-FU-A3TX-01 | Cervix | cervical & endocervical cancer | Female | >=65 | I/II | Unknown | Unknown | SD | |
| SESN3 | SNV | Missense_Mutation | c.193G>C | p.Glu65Gln | p.E65Q | P58005 | protein_coding | tolerated(0.1) | probably_damaging(0.933) | TCGA-IR-A3LA-01 | Cervix | cervical & endocervical cancer | Female | <65 | I/II | Chemotherapy | cisplatin | CR | |
| SESN3 | SNV | Missense_Mutation | rs746291519 | c.866G>A | p.Arg289His | p.R289H | P58005 | protein_coding | deleterious(0.01) | benign(0.071) | TCGA-AA-3819-01 | Colorectum | colon adenocarcinoma | Female | <65 | I/II | Unknown | Unknown | SD |
| SESN3 | SNV | Missense_Mutation | novel | c.651N>G | p.Asp217Glu | p.D217E | P58005 | protein_coding | tolerated(0.17) | benign(0.003) | TCGA-AA-3950-01 | Colorectum | colon adenocarcinoma | Female | >=65 | I/II | Unknown | Unknown | SD |
| SESN3 | SNV | Missense_Mutation | c.892C>A | p.Leu298Ile | p.L298I | P58005 | protein_coding | tolerated(0.18) | probably_damaging(0.992) | TCGA-AA-A00N-01 | Colorectum | colon adenocarcinoma | Male | >=65 | I/II | Unknown | Unknown | PD | |
| SESN3 | SNV | Missense_Mutation | c.557N>A | p.Ser186Tyr | p.S186Y | P58005 | protein_coding | deleterious(0) | probably_damaging(0.998) | TCGA-AA-A010-01 | Colorectum | colon adenocarcinoma | Female | <65 | I/II | Chemotherapy | folinic | CR | |
| SESN3 | SNV | Missense_Mutation | c.292N>T | p.Arg98Cys | p.R98C | P58005 | protein_coding | deleterious(0.01) | probably_damaging(0.963) | TCGA-D5-6928-01 | Colorectum | colon adenocarcinoma | Male | >=65 | I/II | Unknown | Unknown | SD |
| Page: 1 2 3 4 5 6 7 |
Top |
Related drugs of malignant transformation related genes |
| Identification of chemicals and drugs interact with genes involved in malignant transfromation |
| (DGIdb 4.0) |
| Entrez ID | Symbol | Category | Interaction Types | Drug Claim Name | Drug Name | PMIDs |
| Page: 1 |

Copyright 2023-Present -The University of Texas Health Science Center at Houston |