
|
|||||
|
 | |
| |
| |
| |
| |
| |
|
Gene: SESN1 |
Gene summary for SESN1 |
| Gene information | Species | Human | Gene symbol | SESN1 | Gene ID | 27244 |
| Gene name | sestrin 1 | |
| Gene Alias | PA26 | |
| Cytomap | 6q21 | |
| Gene Type | protein-coding | GO ID | GO:0000302 | UniProtAcc | Q9Y6P5 |
Top |
Malignant transformation analysis |
| Identification of the aberrant gene expression in precancerous and cancerous lesions by comparing the gene expression of stem-like cells in diseased tissues with normal stem cells |
| Entrez ID | Symbol | Replicates | Species | Organ | Tissue | Adj P-value | Log2FC | Malignancy |
| 27244 | SESN1 | LZE4T | Human | Esophagus | ESCC | 2.98e-02 | 2.11e-01 | 0.0811 |
| 27244 | SESN1 | LZE20T | Human | Esophagus | ESCC | 2.52e-03 | 8.99e-02 | 0.0662 |
| 27244 | SESN1 | LZE24T | Human | Esophagus | ESCC | 1.48e-11 | 1.92e-01 | 0.0596 |
| 27244 | SESN1 | P2T-E | Human | Esophagus | ESCC | 2.00e-23 | 4.13e-01 | 0.1177 |
| 27244 | SESN1 | P4T-E | Human | Esophagus | ESCC | 8.12e-06 | 1.36e-01 | 0.1323 |
| 27244 | SESN1 | P8T-E | Human | Esophagus | ESCC | 4.85e-14 | 1.58e-01 | 0.0889 |
| 27244 | SESN1 | P9T-E | Human | Esophagus | ESCC | 1.57e-04 | 9.46e-02 | 0.1131 |
| 27244 | SESN1 | P10T-E | Human | Esophagus | ESCC | 1.71e-13 | 1.76e-01 | 0.116 |
| 27244 | SESN1 | P11T-E | Human | Esophagus | ESCC | 2.24e-07 | 1.82e-01 | 0.1426 |
| 27244 | SESN1 | P12T-E | Human | Esophagus | ESCC | 2.90e-18 | 3.98e-01 | 0.1122 |
| 27244 | SESN1 | P15T-E | Human | Esophagus | ESCC | 1.95e-16 | 3.79e-01 | 0.1149 |
| 27244 | SESN1 | P16T-E | Human | Esophagus | ESCC | 7.92e-33 | 6.73e-01 | 0.1153 |
| 27244 | SESN1 | P20T-E | Human | Esophagus | ESCC | 4.75e-11 | 2.09e-01 | 0.1124 |
| 27244 | SESN1 | P21T-E | Human | Esophagus | ESCC | 2.14e-09 | 9.04e-02 | 0.1617 |
| 27244 | SESN1 | P22T-E | Human | Esophagus | ESCC | 1.88e-16 | 1.73e-01 | 0.1236 |
| 27244 | SESN1 | P23T-E | Human | Esophagus | ESCC | 3.39e-13 | 2.69e-01 | 0.108 |
| 27244 | SESN1 | P24T-E | Human | Esophagus | ESCC | 4.01e-09 | 1.60e-01 | 0.1287 |
| 27244 | SESN1 | P26T-E | Human | Esophagus | ESCC | 9.85e-18 | 2.90e-01 | 0.1276 |
| 27244 | SESN1 | P27T-E | Human | Esophagus | ESCC | 1.38e-22 | 3.34e-01 | 0.1055 |
| 27244 | SESN1 | P28T-E | Human | Esophagus | ESCC | 1.12e-17 | 3.30e-01 | 0.1149 |
| Page: 1 2 3 4 |
| Tissue | Expression Dynamics | Abbreviation |
| Esophagus | 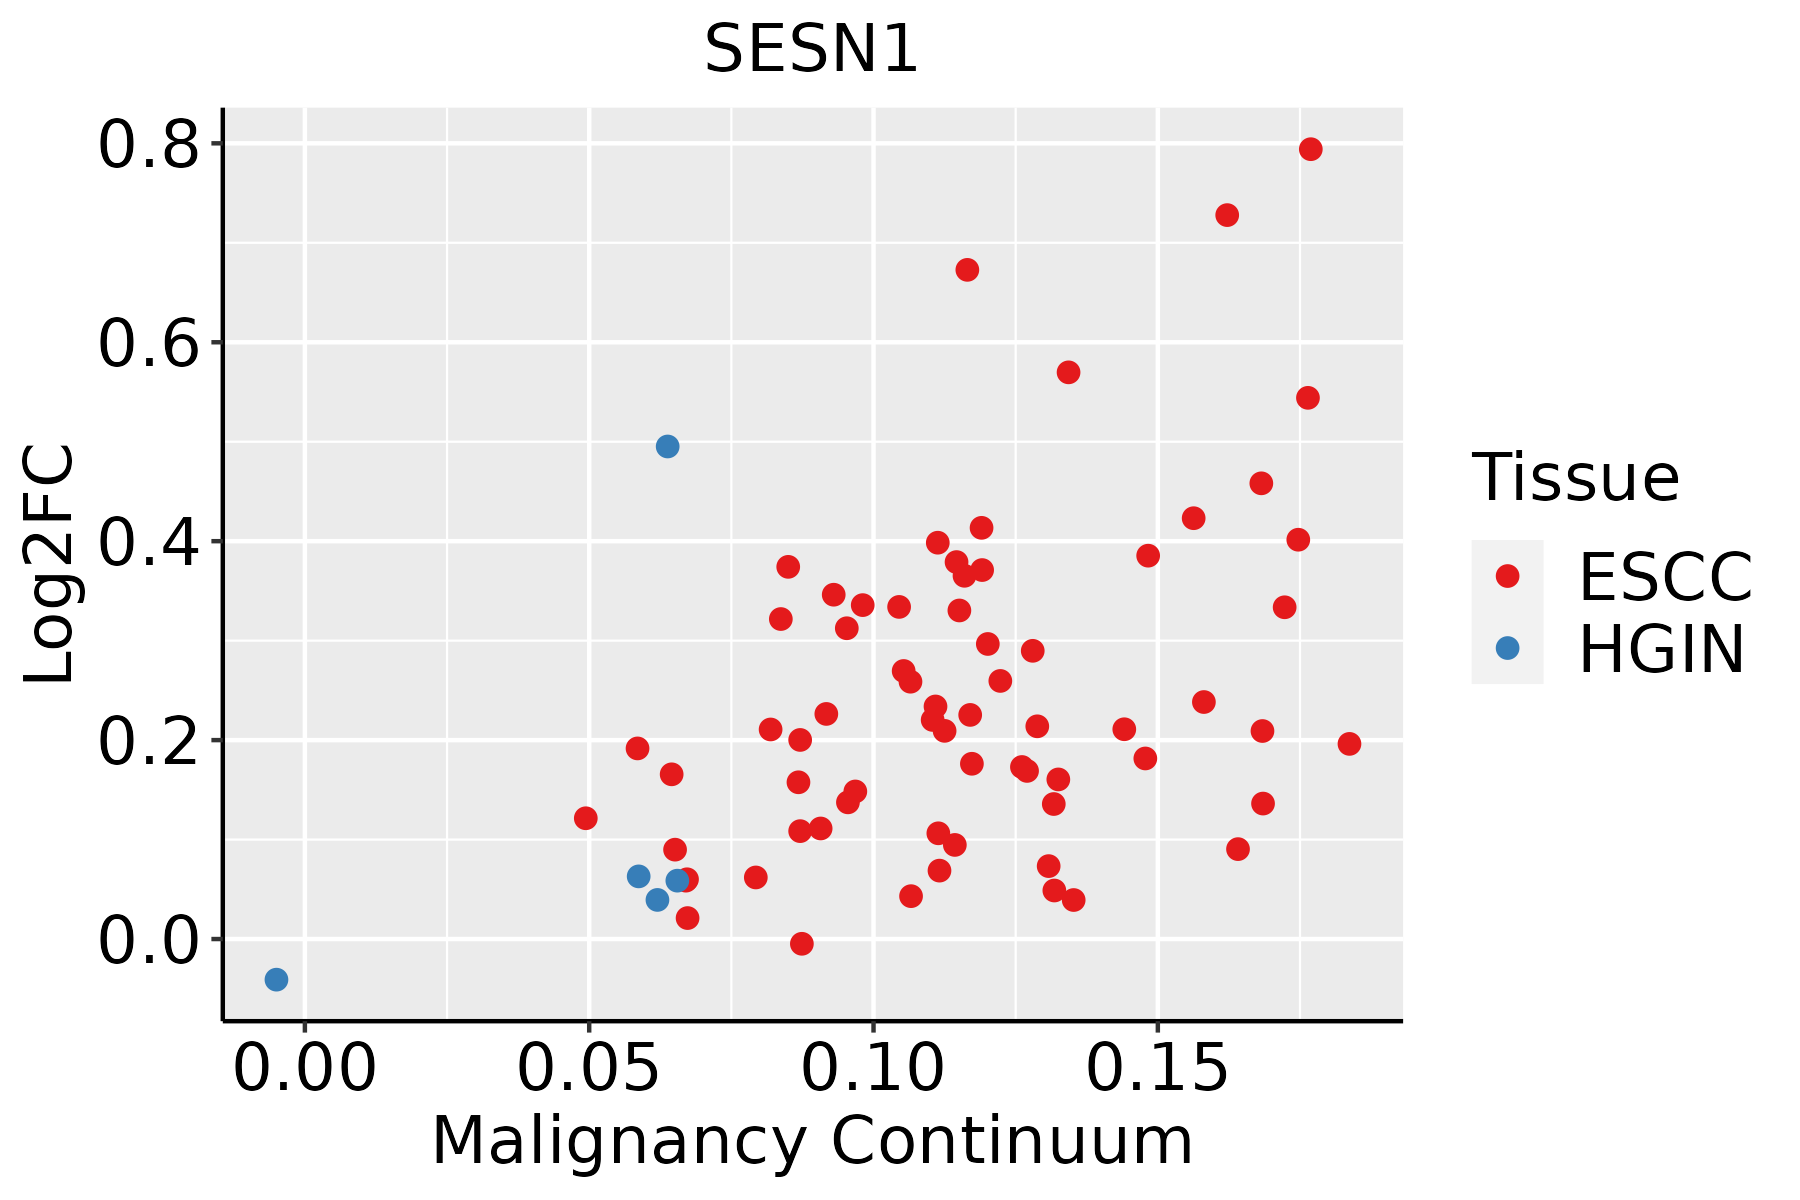 | ESCC: Esophageal squamous cell carcinoma |
| HGIN: High-grade intraepithelial neoplasias | ||
| LGIN: Low-grade intraepithelial neoplasias | ||
| Thyroid | 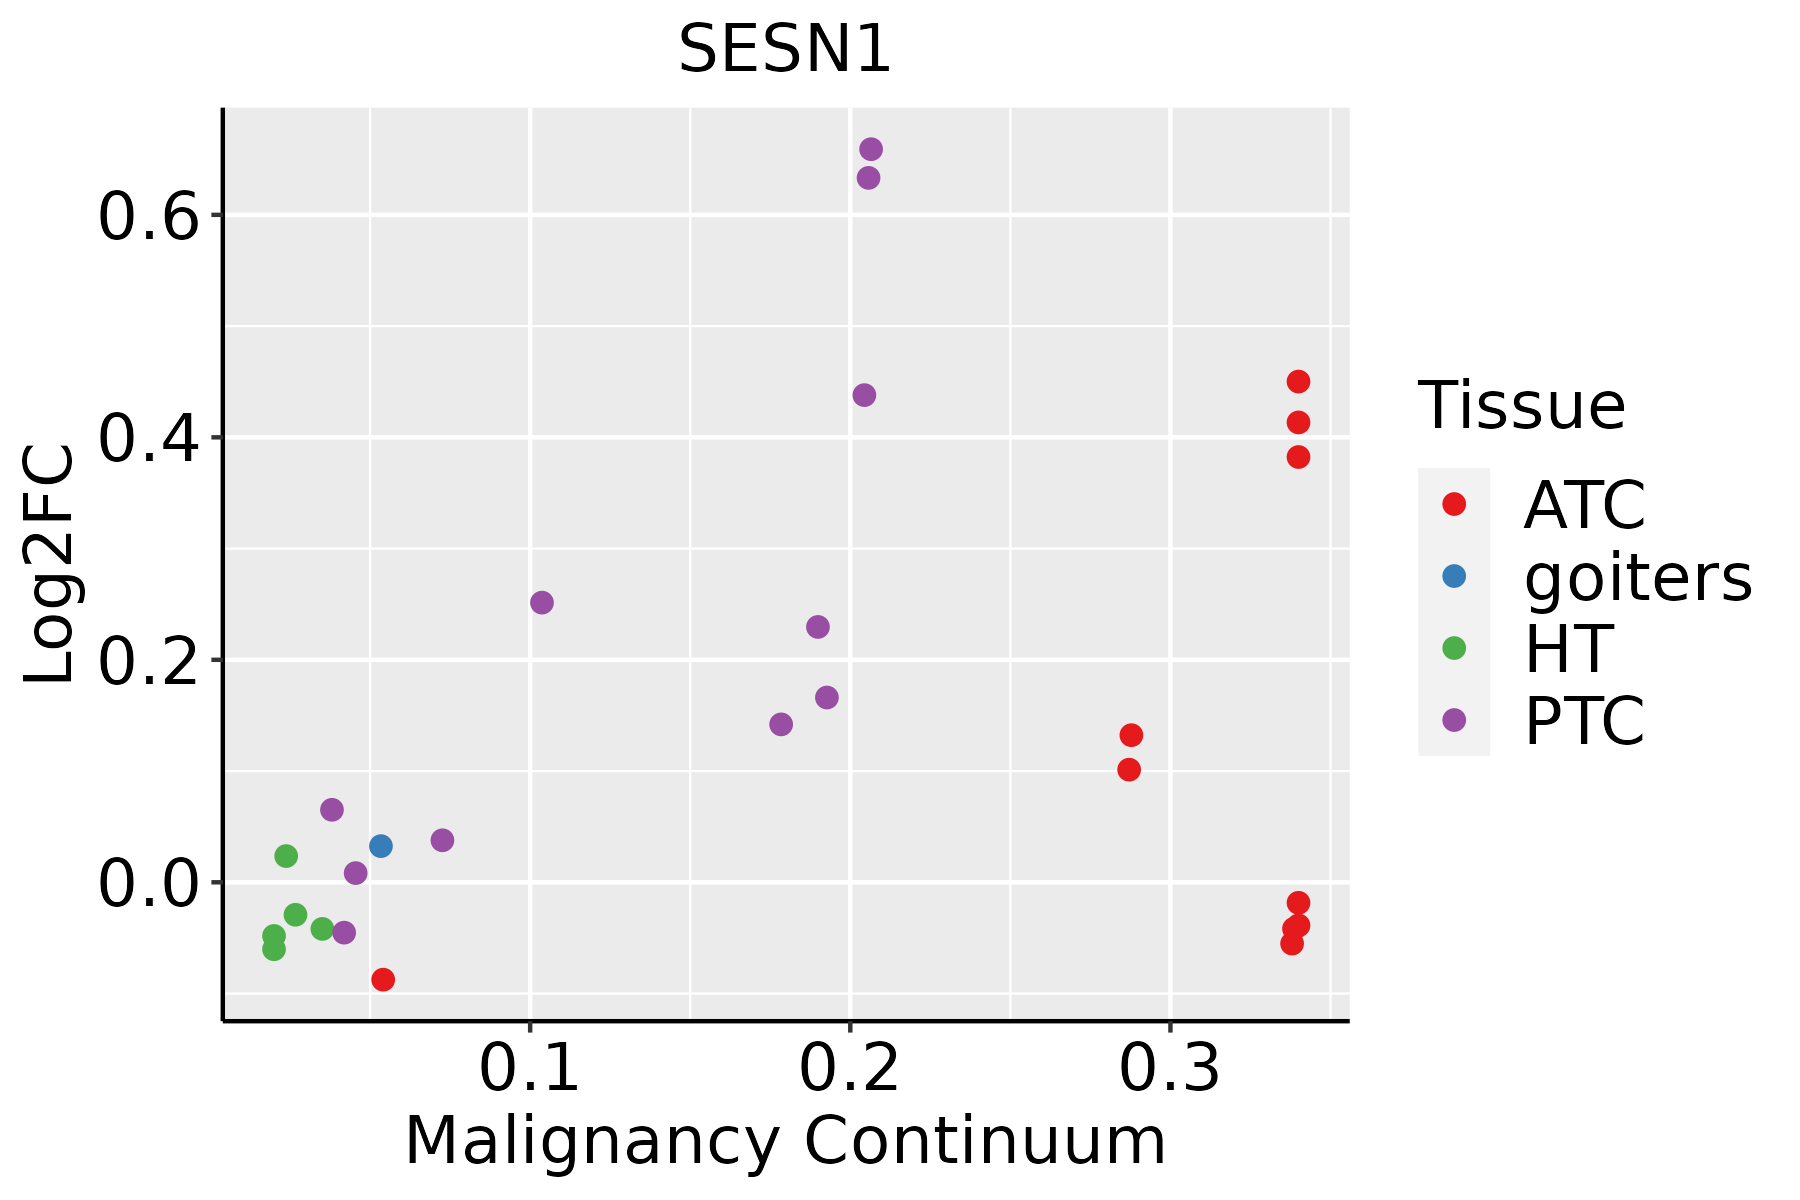 | ATC: Anaplastic thyroid cancer |
| HT: Hashimoto's thyroiditis | ||
| PTC: Papillary thyroid cancer |
| ∗log2FC in expression of this searched gene in stem-like cells from each diseased tissue sample relative to stem-like cells in normal samples in each tissue plotted against the malignancy continuum. Samples are colored based on if they are from different disease stage. |
Top |
Malignant transformation related pathway analysis |
| Find out the enriched GO biological processes and KEGG pathways involved in transition from healthy to precancer to cancer |
| Tissue | Disease Stage | Enriched GO biological Processes |
| Colorectum | AD |  |
| Colorectum | SER |  |
| Colorectum | MSS |  |
| Colorectum | MSI-H |  |
| Colorectum | FAP |  |
| ∗Top 15 enriched GO BP terms are showed in the bar plot of each disease state in each tissue. Each row represents a significant GO biological process which is colored according to the -log10(p.adjust). |
| Page: 1 2 3 4 5 6 7 8 9 |
| GO ID | Tissue | Disease Stage | Description | Gene Ratio | Bg Ratio | pvalue | p.adjust | Count |
| GO:001623617 | Esophagus | ESCC | macroautophagy | 216/8552 | 291/18723 | 1.94e-23 | 4.57e-21 | 216 |
| GO:0009896111 | Esophagus | ESCC | positive regulation of catabolic process | 332/8552 | 492/18723 | 4.36e-23 | 9.22e-21 | 332 |
| GO:0006979111 | Esophagus | ESCC | response to oxidative stress | 303/8552 | 446/18723 | 7.15e-22 | 1.30e-19 | 303 |
| GO:0031331111 | Esophagus | ESCC | positive regulation of cellular catabolic process | 292/8552 | 427/18723 | 8.67e-22 | 1.53e-19 | 292 |
| GO:001050617 | Esophagus | ESCC | regulation of autophagy | 220/8552 | 317/18723 | 6.72e-18 | 6.36e-16 | 220 |
| GO:0071496111 | Esophagus | ESCC | cellular response to external stimulus | 215/8552 | 320/18723 | 4.29e-15 | 2.43e-13 | 215 |
| GO:0031668111 | Esophagus | ESCC | cellular response to extracellular stimulus | 168/8552 | 246/18723 | 4.93e-13 | 2.23e-11 | 168 |
| GO:0031669110 | Esophagus | ESCC | cellular response to nutrient levels | 148/8552 | 215/18723 | 4.58e-12 | 1.76e-10 | 148 |
| GO:0031667111 | Esophagus | ESCC | response to nutrient levels | 289/8552 | 474/18723 | 9.25e-12 | 3.47e-10 | 289 |
| GO:0000302111 | Esophagus | ESCC | response to reactive oxygen species | 150/8552 | 222/18723 | 3.06e-11 | 1.02e-09 | 150 |
| GO:001624114 | Esophagus | ESCC | regulation of macroautophagy | 102/8552 | 141/18723 | 1.09e-10 | 3.27e-09 | 102 |
| GO:0009267110 | Esophagus | ESCC | cellular response to starvation | 110/8552 | 156/18723 | 2.63e-10 | 7.37e-09 | 110 |
| GO:004259419 | Esophagus | ESCC | response to starvation | 133/8552 | 197/18723 | 4.31e-10 | 1.14e-08 | 133 |
| GO:001050816 | Esophagus | ESCC | positive regulation of autophagy | 81/8552 | 124/18723 | 7.74e-06 | 7.65e-05 | 81 |
| GO:19909284 | Esophagus | ESCC | response to amino acid starvation | 37/8552 | 49/18723 | 2.05e-05 | 1.78e-04 | 37 |
| GO:00421492 | Esophagus | ESCC | cellular response to glucose starvation | 36/8552 | 48/18723 | 3.43e-05 | 2.80e-04 | 36 |
| GO:00432007 | Esophagus | ESCC | response to amino acid | 74/8552 | 116/18723 | 6.23e-05 | 4.76e-04 | 74 |
| GO:000110110 | Esophagus | ESCC | response to acid chemical | 84/8552 | 135/18723 | 7.70e-05 | 5.74e-04 | 84 |
| GO:00319294 | Esophagus | ESCC | TOR signaling | 79/8552 | 126/18723 | 8.57e-05 | 6.21e-04 | 79 |
| GO:00341984 | Esophagus | ESCC | cellular response to amino acid starvation | 34/8552 | 46/18723 | 9.39e-05 | 6.70e-04 | 34 |
| Page: 1 2 3 4 5 |
| Pathway ID | Tissue | Disease Stage | Description | Gene Ratio | Bg Ratio | pvalue | p.adjust | qvalue | Count |
| hsa0411524 | Esophagus | ESCC | p53 signaling pathway | 65/4205 | 74/8465 | 3.88e-12 | 6.50e-11 | 3.33e-11 | 65 |
| hsa0421114 | Esophagus | ESCC | Longevity regulating pathway | 58/4205 | 89/8465 | 2.19e-03 | 6.16e-03 | 3.16e-03 | 58 |
| hsa0411534 | Esophagus | ESCC | p53 signaling pathway | 65/4205 | 74/8465 | 3.88e-12 | 6.50e-11 | 3.33e-11 | 65 |
| hsa0421115 | Esophagus | ESCC | Longevity regulating pathway | 58/4205 | 89/8465 | 2.19e-03 | 6.16e-03 | 3.16e-03 | 58 |
| Page: 1 |
Top |
Cell-cell communication analysis |
| Identification of potential cell-cell interactions between two cell types and their ligand-receptor pairs for different disease states |
| Ligand | Receptor | LRpair | Pathway | Tissue | Disease Stage |
| Page: 1 |
Top |
Single-cell gene regulatory network inference analysis |
| Find out the significant the regulons (TFs) and the target genes of each regulon across cell types for different disease states |
| TF | Cell Type | Tissue | Disease Stage | Target Gene | RSS | Regulon Activity |
| ∗The dot plots of a searched regulon are shown for all cell subpopulations in each disease state of each tissue based on the regulon specific score inferred using pySCENIC and by calculating the average expression. |
| Page: 1 |
Top |
Somatic mutation of malignant transformation related genes |
| Annotation of somatic variants for genes involved in malignant transformation |
| Hugo Symbol | Variant Class | Variant Classification | dbSNP RS | HGVSc | HGVSp | HGVSp Short | SWISSPROT | BIOTYPE | SIFT | PolyPhen | Tumor Sample Barcode | Tissue | Histology | Sex | Age | Stage | Therapy Types | Drugs | Outcome |
| SESN1 | SNV | Missense_Mutation | novel | c.991G>C | p.Glu331Gln | p.E331Q | Q9Y6P5 | protein_coding | deleterious(0.02) | probably_damaging(0.991) | TCGA-AO-A0J9-01 | Breast | breast invasive carcinoma | Female | <65 | III/IV | Chemotherapy | cyclophosphamide | PD |
| SESN1 | SNV | Missense_Mutation | rs777845724 | c.1384C>T | p.Arg462Trp | p.R462W | Q9Y6P5 | protein_coding | deleterious(0.02) | benign(0) | TCGA-2W-A8YY-01 | Cervix | cervical & endocervical cancer | Female | <65 | I/II | Chemotherapy | cisplatin | CR |
| SESN1 | SNV | Missense_Mutation | novel | c.509C>T | p.Pro170Leu | p.P170L | Q9Y6P5 | protein_coding | deleterious(0) | probably_damaging(0.998) | TCGA-AA-3950-01 | Colorectum | colon adenocarcinoma | Female | >=65 | I/II | Unknown | Unknown | SD |
| SESN1 | SNV | Missense_Mutation | c.293N>T | p.Arg98Ile | p.R98I | Q9Y6P5 | protein_coding | deleterious(0) | possibly_damaging(0.735) | TCGA-AA-A010-01 | Colorectum | colon adenocarcinoma | Female | <65 | I/II | Chemotherapy | folinic | CR | |
| SESN1 | SNV | Missense_Mutation | c.200N>T | p.Ala67Val | p.A67V | Q9Y6P5 | protein_coding | tolerated(0.51) | possibly_damaging(0.546) | TCGA-F4-6570-01 | Colorectum | colon adenocarcinoma | Female | >=65 | I/II | Unknown | Unknown | SD | |
| SESN1 | deletion | Frame_Shift_Del | novel | c.446delN | p.Phe149SerfsTer6 | p.F149Sfs*6 | Q9Y6P5 | protein_coding | TCGA-A6-3809-01 | Colorectum | colon adenocarcinoma | Female | >=65 | I/II | Unknown | Unknown | SD | ||
| SESN1 | SNV | Missense_Mutation | novel | c.1499N>C | p.Val500Ala | p.V500A | Q9Y6P5 | protein_coding | tolerated(0.94) | probably_damaging(0.98) | TCGA-A5-A0G1-01 | Endometrium | uterine corpus endometrioid carcinoma | Female | >=65 | I/II | Unknown | Unknown | SD |
| SESN1 | SNV | Missense_Mutation | novel | c.469N>C | p.Phe157Leu | p.F157L | Q9Y6P5 | protein_coding | deleterious(0) | probably_damaging(0.969) | TCGA-A5-A0G1-01 | Endometrium | uterine corpus endometrioid carcinoma | Female | >=65 | I/II | Unknown | Unknown | SD |
| SESN1 | SNV | Missense_Mutation | novel | c.650N>A | p.Pro217His | p.P217H | Q9Y6P5 | protein_coding | deleterious(0) | probably_damaging(0.912) | TCGA-A5-A0G2-01 | Endometrium | uterine corpus endometrioid carcinoma | Female | <65 | III/IV | Unknown | Unknown | SD |
| SESN1 | SNV | Missense_Mutation | c.987N>A | p.Phe329Leu | p.F329L | Q9Y6P5 | protein_coding | tolerated(0.65) | benign(0) | TCGA-AP-A056-01 | Endometrium | uterine corpus endometrioid carcinoma | Female | <65 | I/II | Unknown | Unknown | SD |
| Page: 1 2 3 4 5 |
Top |
Related drugs of malignant transformation related genes |
| Identification of chemicals and drugs interact with genes involved in malignant transfromation |
| (DGIdb 4.0) |
| Entrez ID | Symbol | Category | Interaction Types | Drug Claim Name | Drug Name | PMIDs |
| Page: 1 |

Copyright 2023-Present -The University of Texas Health Science Center at Houston |