
|
|||||
|
 | |
| |
| |
| |
| |
| |
|
Gene: SERTAD3 |
Gene summary for SERTAD3 |
| Gene information | Species | Human | Gene symbol | SERTAD3 | Gene ID | 29946 |
| Gene name | SERTA domain containing 3 | |
| Gene Alias | RBT1 | |
| Cytomap | 19q13.2 | |
| Gene Type | protein-coding | GO ID | GO:0001558 | UniProtAcc | A0A024R0N2 |
Top |
Malignant transformation analysis |
| Identification of the aberrant gene expression in precancerous and cancerous lesions by comparing the gene expression of stem-like cells in diseased tissues with normal stem cells |
| Entrez ID | Symbol | Replicates | Species | Organ | Tissue | Adj P-value | Log2FC | Malignancy |
| 29946 | SERTAD3 | LZE4T | Human | Esophagus | ESCC | 1.83e-07 | 4.46e-01 | 0.0811 |
| 29946 | SERTAD3 | LZE7T | Human | Esophagus | ESCC | 1.15e-07 | 1.83e-01 | 0.0667 |
| 29946 | SERTAD3 | LZE8T | Human | Esophagus | ESCC | 3.59e-14 | 2.59e-01 | 0.067 |
| 29946 | SERTAD3 | LZE20T | Human | Esophagus | ESCC | 5.15e-12 | 6.23e-01 | 0.0662 |
| 29946 | SERTAD3 | LZE24T | Human | Esophagus | ESCC | 7.00e-24 | 7.88e-01 | 0.0596 |
| 29946 | SERTAD3 | P1T-E | Human | Esophagus | ESCC | 4.00e-12 | 1.20e+00 | 0.0875 |
| 29946 | SERTAD3 | P2T-E | Human | Esophagus | ESCC | 1.12e-22 | 5.56e-01 | 0.1177 |
| 29946 | SERTAD3 | P4T-E | Human | Esophagus | ESCC | 9.90e-39 | 1.03e+00 | 0.1323 |
| 29946 | SERTAD3 | P5T-E | Human | Esophagus | ESCC | 3.21e-27 | 4.54e-01 | 0.1327 |
| 29946 | SERTAD3 | P8T-E | Human | Esophagus | ESCC | 3.97e-54 | 1.41e+00 | 0.0889 |
| 29946 | SERTAD3 | P9T-E | Human | Esophagus | ESCC | 3.05e-14 | 2.40e-01 | 0.1131 |
| 29946 | SERTAD3 | P10T-E | Human | Esophagus | ESCC | 4.04e-12 | 4.04e-01 | 0.116 |
| 29946 | SERTAD3 | P11T-E | Human | Esophagus | ESCC | 3.54e-20 | 1.21e+00 | 0.1426 |
| 29946 | SERTAD3 | P12T-E | Human | Esophagus | ESCC | 1.36e-47 | 1.19e+00 | 0.1122 |
| 29946 | SERTAD3 | P15T-E | Human | Esophagus | ESCC | 3.21e-23 | 6.46e-01 | 0.1149 |
| 29946 | SERTAD3 | P16T-E | Human | Esophagus | ESCC | 3.38e-12 | 2.02e-01 | 0.1153 |
| 29946 | SERTAD3 | P19T-E | Human | Esophagus | ESCC | 9.13e-04 | 5.37e-01 | 0.1662 |
| 29946 | SERTAD3 | P20T-E | Human | Esophagus | ESCC | 4.85e-29 | 8.78e-01 | 0.1124 |
| 29946 | SERTAD3 | P21T-E | Human | Esophagus | ESCC | 6.98e-17 | 2.14e-01 | 0.1617 |
| 29946 | SERTAD3 | P22T-E | Human | Esophagus | ESCC | 2.69e-18 | 5.81e-01 | 0.1236 |
| Page: 1 2 3 4 5 6 |
| Tissue | Expression Dynamics | Abbreviation |
| Esophagus | 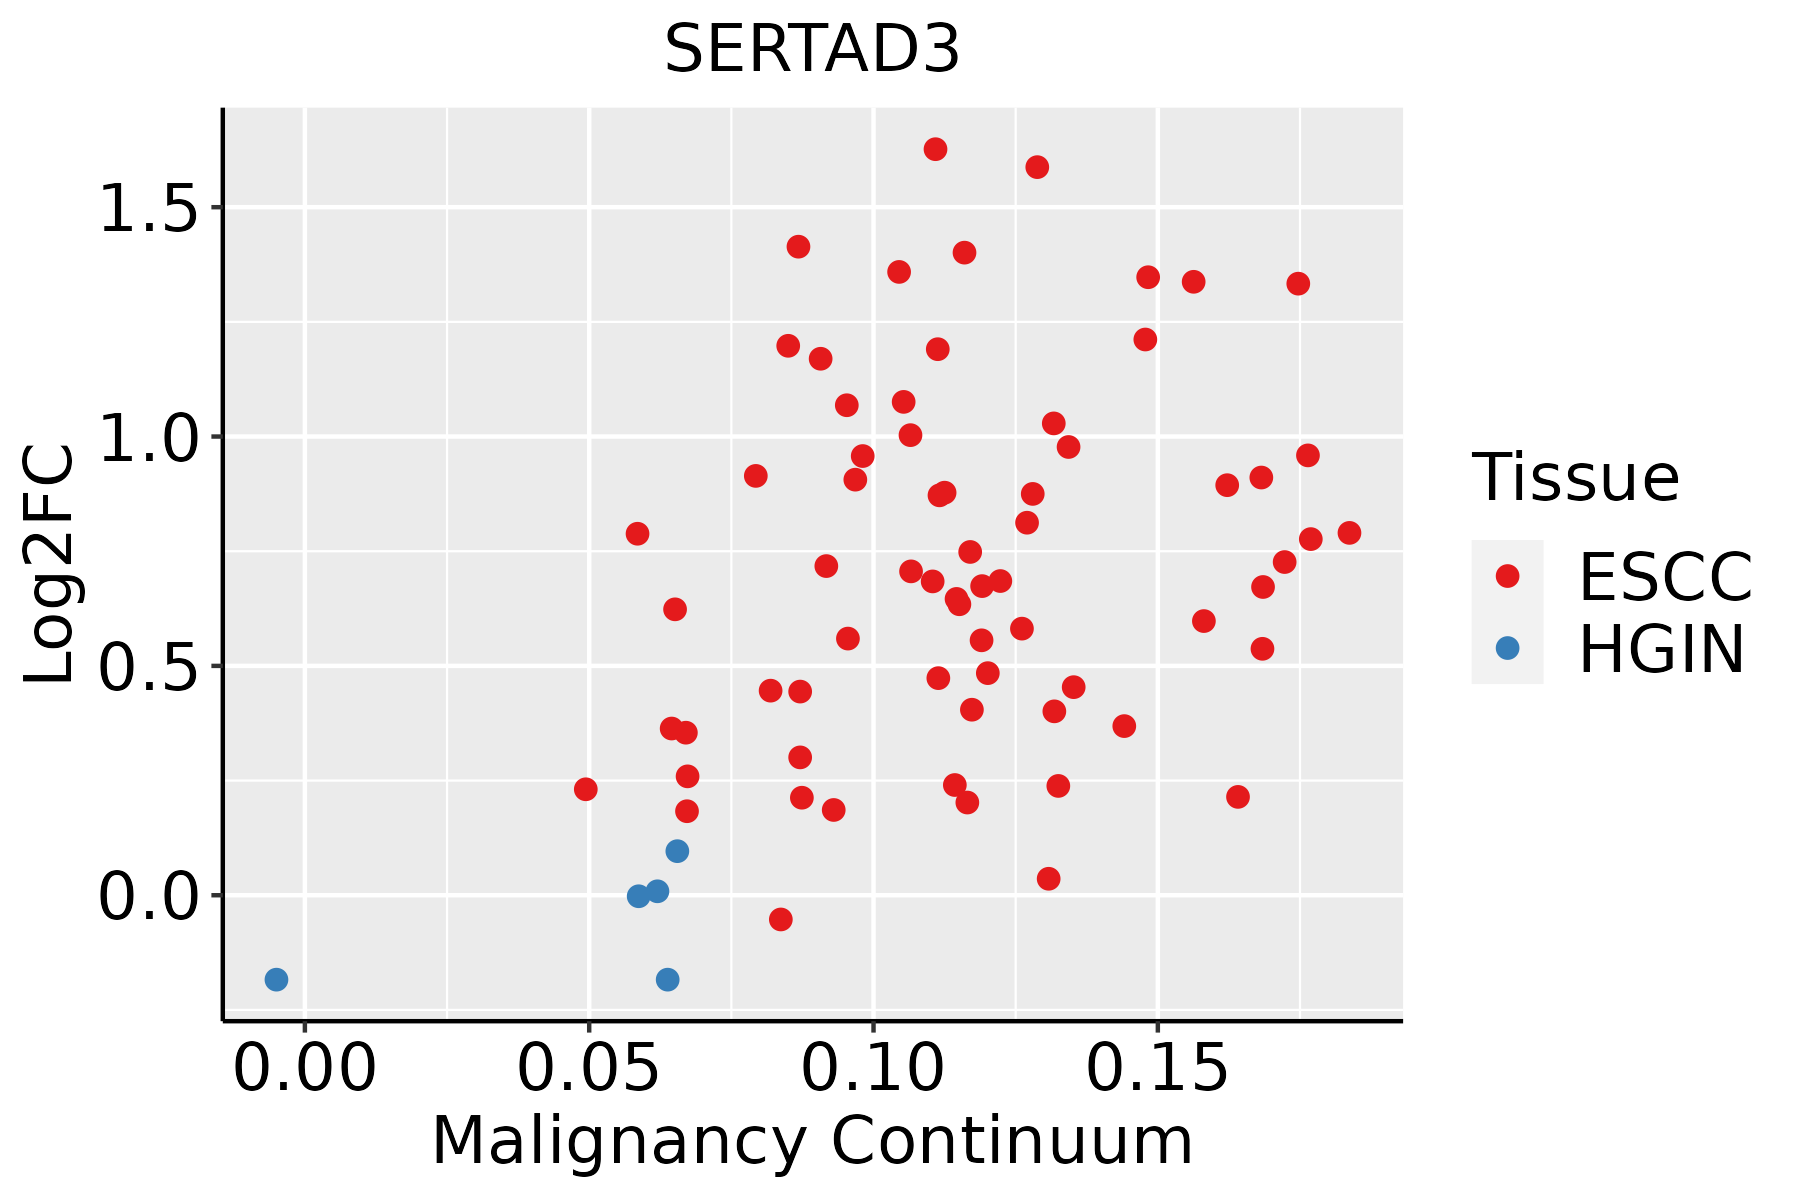 | ESCC: Esophageal squamous cell carcinoma |
| HGIN: High-grade intraepithelial neoplasias | ||
| LGIN: Low-grade intraepithelial neoplasias | ||
| Liver | 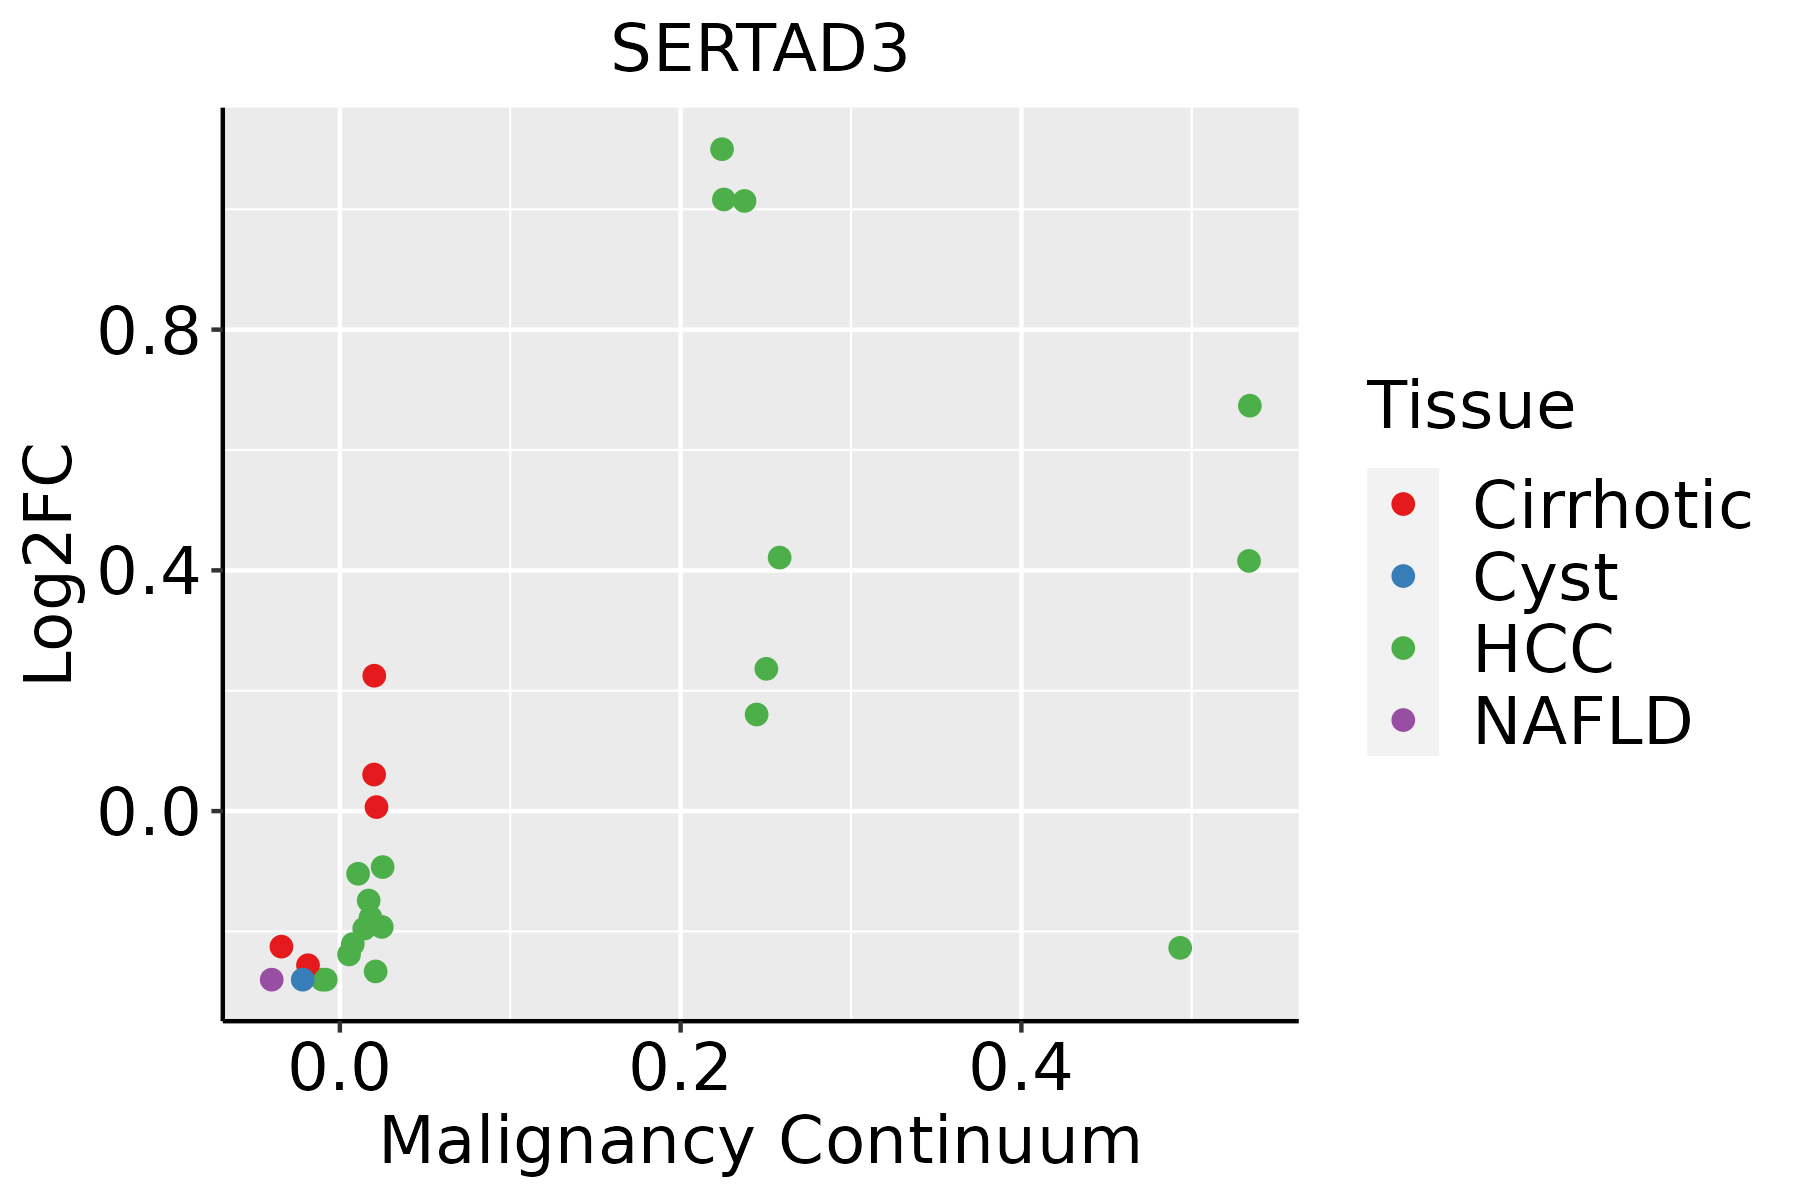 | HCC: Hepatocellular carcinoma |
| NAFLD: Non-alcoholic fatty liver disease | ||
| Oral Cavity | 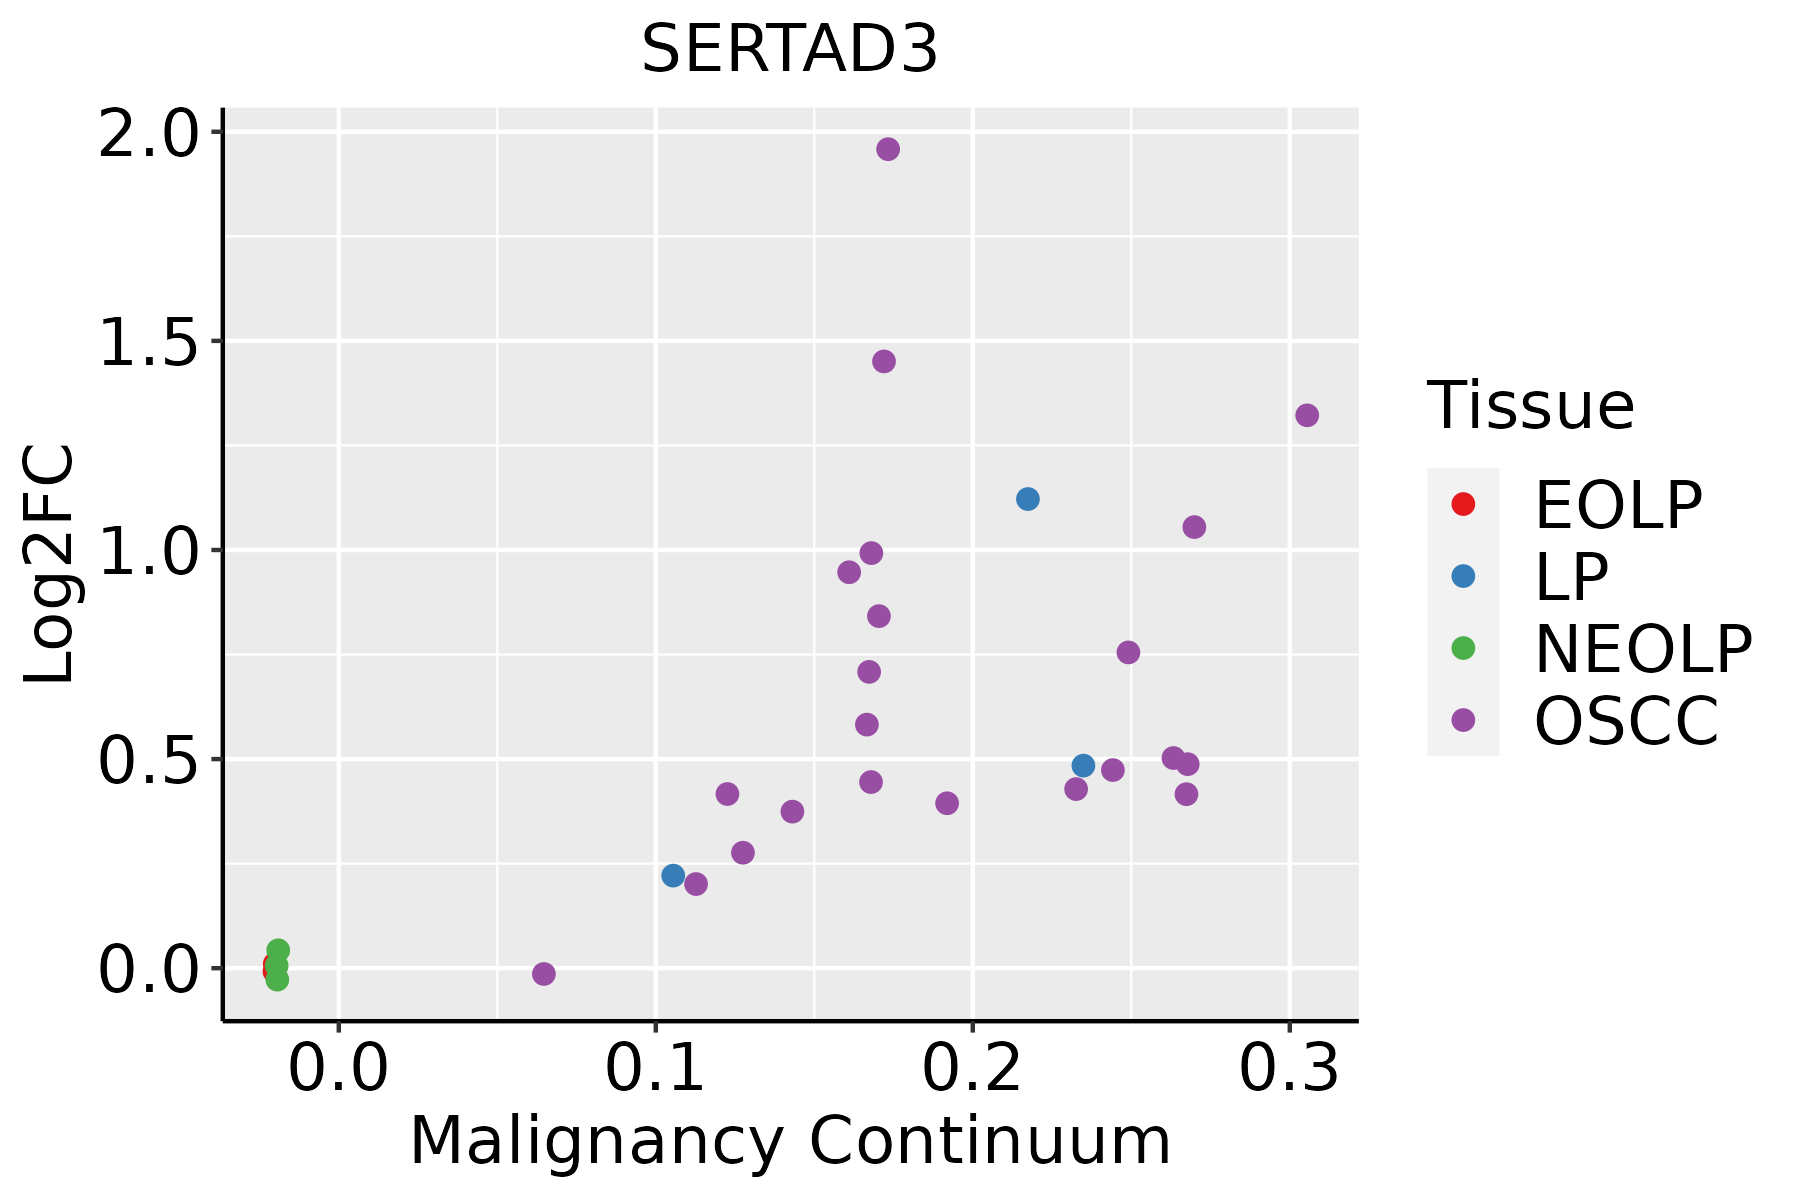 | EOLP: Erosive Oral lichen planus |
| LP: leukoplakia | ||
| NEOLP: Non-erosive oral lichen planus | ||
| OSCC: Oral squamous cell carcinoma | ||
| Thyroid | 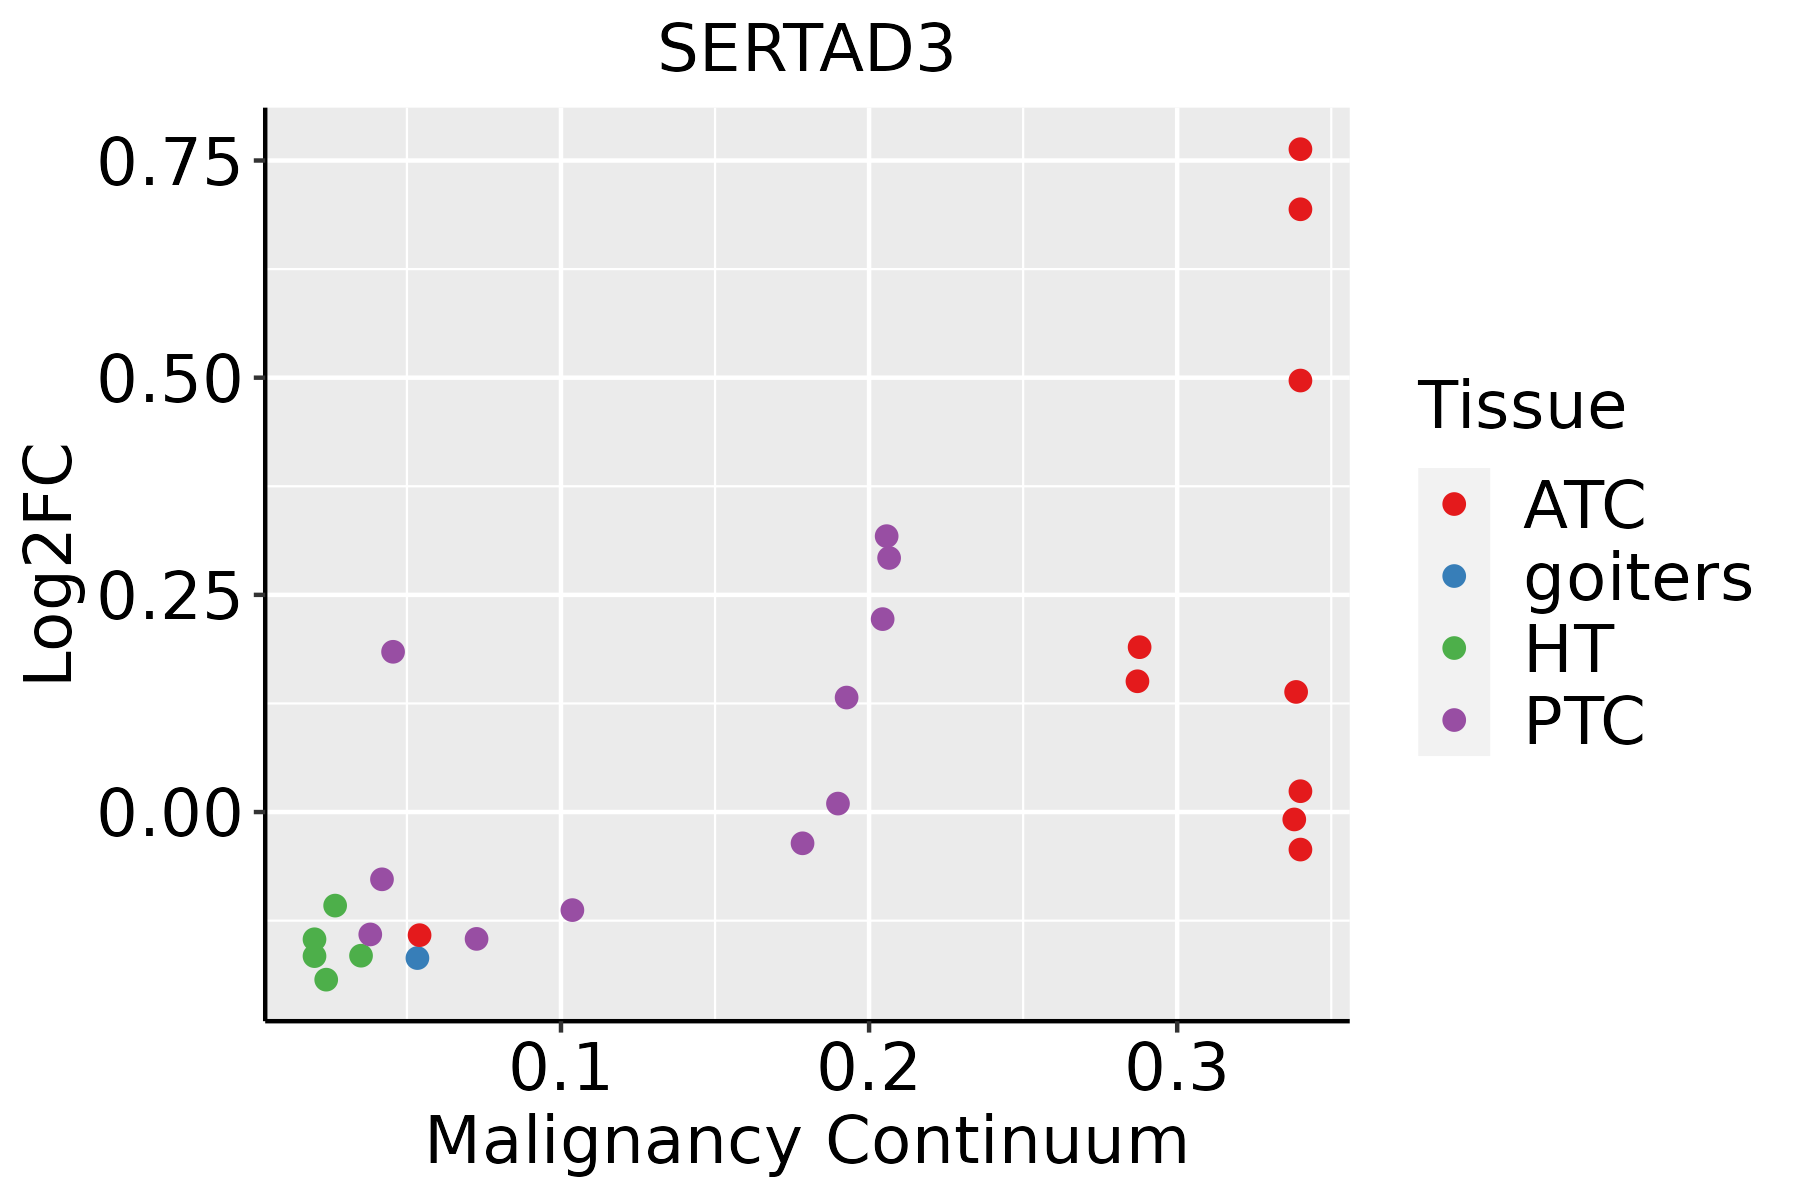 | ATC: Anaplastic thyroid cancer |
| HT: Hashimoto's thyroiditis | ||
| PTC: Papillary thyroid cancer |
| ∗log2FC in expression of this searched gene in stem-like cells from each diseased tissue sample relative to stem-like cells in normal samples in each tissue plotted against the malignancy continuum. Samples are colored based on if they are from different disease stage. |
Top |
Malignant transformation related pathway analysis |
| Find out the enriched GO biological processes and KEGG pathways involved in transition from healthy to precancer to cancer |
| Tissue | Disease Stage | Enriched GO biological Processes |
| Colorectum | AD |  |
| Colorectum | SER |  |
| Colorectum | MSS |  |
| Colorectum | MSI-H |  |
| Colorectum | FAP |  |
| ∗Top 15 enriched GO BP terms are showed in the bar plot of each disease state in each tissue. Each row represents a significant GO biological process which is colored according to the -log10(p.adjust). |
| Page: 1 2 3 4 5 6 7 8 9 |
| GO ID | Tissue | Disease Stage | Description | Gene Ratio | Bg Ratio | pvalue | p.adjust | Count |
| GO:0016049110 | Esophagus | ESCC | cell growth | 289/8552 | 482/18723 | 1.29e-10 | 3.77e-09 | 289 |
| GO:000155819 | Esophagus | ESCC | regulation of cell growth | 248/8552 | 414/18723 | 2.97e-09 | 6.45e-08 | 248 |
| GO:00459267 | Esophagus | ESCC | negative regulation of growth | 148/8552 | 249/18723 | 7.88e-06 | 7.73e-05 | 148 |
| GO:00303085 | Esophagus | ESCC | negative regulation of cell growth | 108/8552 | 188/18723 | 7.46e-04 | 3.87e-03 | 108 |
| GO:001604911 | Liver | Cirrhotic | cell growth | 160/4634 | 482/18723 | 1.50e-05 | 2.07e-04 | 160 |
| GO:000155811 | Liver | Cirrhotic | regulation of cell growth | 132/4634 | 414/18723 | 5.53e-04 | 4.36e-03 | 132 |
| GO:001604921 | Liver | HCC | cell growth | 269/7958 | 482/18723 | 1.84e-09 | 5.35e-08 | 269 |
| GO:000155821 | Liver | HCC | regulation of cell growth | 228/7958 | 414/18723 | 1.34e-07 | 2.55e-06 | 228 |
| GO:00459263 | Liver | HCC | negative regulation of growth | 129/7958 | 249/18723 | 1.81e-03 | 9.37e-03 | 129 |
| GO:0030308 | Liver | HCC | negative regulation of cell growth | 98/7958 | 188/18723 | 4.74e-03 | 2.02e-02 | 98 |
| GO:001604917 | Oral cavity | OSCC | cell growth | 268/7305 | 482/18723 | 6.55e-14 | 3.51e-12 | 268 |
| GO:000155816 | Oral cavity | OSCC | regulation of cell growth | 228/7305 | 414/18723 | 1.74e-11 | 6.09e-10 | 228 |
| GO:00459266 | Oral cavity | OSCC | negative regulation of growth | 135/7305 | 249/18723 | 7.29e-07 | 1.03e-05 | 135 |
| GO:00303084 | Oral cavity | OSCC | negative regulation of cell growth | 101/7305 | 188/18723 | 2.85e-05 | 2.63e-04 | 101 |
| GO:001604918 | Oral cavity | LP | cell growth | 155/4623 | 482/18723 | 1.08e-04 | 1.31e-03 | 155 |
| GO:000155817 | Oral cavity | LP | regulation of cell growth | 134/4623 | 414/18723 | 2.25e-04 | 2.41e-03 | 134 |
| GO:0016049112 | Thyroid | PTC | cell growth | 225/5968 | 482/18723 | 4.75e-12 | 2.07e-10 | 225 |
| GO:0001558111 | Thyroid | PTC | regulation of cell growth | 188/5968 | 414/18723 | 4.13e-09 | 1.09e-07 | 188 |
| GO:004592614 | Thyroid | PTC | negative regulation of growth | 105/5968 | 249/18723 | 3.76e-04 | 2.54e-03 | 105 |
| GO:00303087 | Thyroid | PTC | negative regulation of cell growth | 80/5968 | 188/18723 | 1.28e-03 | 7.31e-03 | 80 |
| Page: 1 2 |
| Pathway ID | Tissue | Disease Stage | Description | Gene Ratio | Bg Ratio | pvalue | p.adjust | qvalue | Count |
| Page: 1 |
Top |
Cell-cell communication analysis |
| Identification of potential cell-cell interactions between two cell types and their ligand-receptor pairs for different disease states |
| Ligand | Receptor | LRpair | Pathway | Tissue | Disease Stage |
| Page: 1 |
Top |
Single-cell gene regulatory network inference analysis |
| Find out the significant the regulons (TFs) and the target genes of each regulon across cell types for different disease states |
| TF | Cell Type | Tissue | Disease Stage | Target Gene | RSS | Regulon Activity |
| ∗The dot plots of a searched regulon are shown for all cell subpopulations in each disease state of each tissue based on the regulon specific score inferred using pySCENIC and by calculating the average expression. |
| Page: 1 |
Top |
Somatic mutation of malignant transformation related genes |
| Annotation of somatic variants for genes involved in malignant transformation |
| Hugo Symbol | Variant Class | Variant Classification | dbSNP RS | HGVSc | HGVSp | HGVSp Short | SWISSPROT | BIOTYPE | SIFT | PolyPhen | Tumor Sample Barcode | Tissue | Histology | Sex | Age | Stage | Therapy Types | Drugs | Outcome |
| SERTAD3 | SNV | Missense_Mutation | c.337N>G | p.Gln113Glu | p.Q113E | Q9UJW9 | protein_coding | tolerated(0.59) | benign(0.051) | TCGA-A1-A0SK-01 | Breast | breast invasive carcinoma | Female | <65 | I/II | Unknown | Unknown | PD | |
| SERTAD3 | SNV | Missense_Mutation | rs767674354 | c.127N>T | p.Arg43Cys | p.R43C | Q9UJW9 | protein_coding | deleterious(0.01) | possibly_damaging(0.643) | TCGA-A8-A07L-01 | Breast | breast invasive carcinoma | Female | <65 | III/IV | Chemotherapy | CR | |
| SERTAD3 | SNV | Missense_Mutation | c.490G>A | p.Ala164Thr | p.A164T | Q9UJW9 | protein_coding | tolerated(0.39) | benign(0.005) | TCGA-A8-A08R-01 | Breast | breast invasive carcinoma | Female | <65 | I/II | Unknown | Unknown | SD | |
| SERTAD3 | SNV | Missense_Mutation | rs750801778 | c.497C>T | p.Ala166Val | p.A166V | Q9UJW9 | protein_coding | tolerated(0.39) | benign(0.326) | TCGA-BH-A18Q-01 | Breast | breast invasive carcinoma | Female | <65 | I/II | Unknown | Unknown | SD |
| SERTAD3 | SNV | Missense_Mutation | novel | c.71N>A | p.Ala24Glu | p.A24E | Q9UJW9 | protein_coding | tolerated(0.91) | benign(0.351) | TCGA-DS-A1OB-01 | Cervix | cervical & endocervical cancer | Female | <65 | I/II | Chemotherapy | carboplatin | PD |
| SERTAD3 | SNV | Missense_Mutation | c.81N>C | p.Gln27His | p.Q27H | Q9UJW9 | protein_coding | tolerated(0.1) | benign(0.037) | TCGA-FU-A40J-01 | Cervix | cervical & endocervical cancer | Female | <65 | III/IV | Chemotherapy | carboplatin | CR | |
| SERTAD3 | SNV | Missense_Mutation | rs369267116 | c.419G>A | p.Arg140Gln | p.R140Q | Q9UJW9 | protein_coding | tolerated(0.24) | benign(0.001) | TCGA-AA-3672-01 | Colorectum | colon adenocarcinoma | Female | >=65 | III/IV | Unknown | Unknown | SD |
| SERTAD3 | SNV | Missense_Mutation | c.472N>A | p.Ala158Thr | p.A158T | Q9UJW9 | protein_coding | tolerated(0.46) | benign(0) | TCGA-AA-3815-01 | Colorectum | colon adenocarcinoma | Female | >=65 | I/II | Unknown | Unknown | SD | |
| SERTAD3 | SNV | Missense_Mutation | rs760926284 | c.104N>A | p.Arg35His | p.R35H | Q9UJW9 | protein_coding | tolerated(0.16) | benign(0.005) | TCGA-DM-A28F-01 | Colorectum | colon adenocarcinoma | Male | >=65 | III/IV | Unknown | Unknown | SD |
| SERTAD3 | deletion | Frame_Shift_Del | c.237delN | p.Glu80SerfsTer37 | p.E80Sfs*37 | Q9UJW9 | protein_coding | TCGA-AA-3710-01 | Colorectum | colon adenocarcinoma | Female | >=65 | I/II | Unknown | Unknown | SD |
| Page: 1 2 3 |
Top |
Related drugs of malignant transformation related genes |
| Identification of chemicals and drugs interact with genes involved in malignant transfromation |
| (DGIdb 4.0) |
| Entrez ID | Symbol | Category | Interaction Types | Drug Claim Name | Drug Name | PMIDs |
| Page: 1 |

Copyright 2023-Present -The University of Texas Health Science Center at Houston |