Schematic overview of the cellular and molecular mechanisms involved in the cancer progression, including the proposed cellular and molecular mechanisms in cancer cells trajectory. AT1: alveolar type 1 cells; AT2: alveolar type 2 cells; AAH: atypical adenomatous hyperplasia; AIS: adenocarcinoma in situ; MIA: minimally invasive adenocarcinoma; IA: invasive adenocarcinoma; EMT: epithelial-mesenchymal transition

Home

Download

Statistics

Help

Contact

Center for Computational Systems Medicine
leaf

Gene summary

leaf

Malignant transformation analysis

leaf

Malignant transformation related pathway analysis

leaf

Cell-cell communication analysis

leaf

Single-cell gene regulatory network inference analysis

leaf

Somatic mutation of malignant transformation related genes

leaf

Related drugs of malignant transformation related genes

Gene: SERTAD2

Gene summary for SERTAD2

check button Gene summary.

Gene informationSpeciesHuman
Gene symbol

SERTAD2

Gene ID

9792

Gene nameSERTA domain containing 2
Gene AliasSei-2
Cytomap2p14
Gene Typeprotein-coding
GO ID

GO:0001558

UniProtAcc

Q14140


Top

Malignant transformation analysis

check button Identification of the aberrant gene expression in precancerous and cancerous lesions by comparing the gene expression of stem-like cells in diseased tissues with normal stem cells
check button Malignant transformation involving gene list.
Entrez IDSymbolReplicatesSpeciesOrganTissueAdj P-valueLog2FCMalignancy
9792SERTAD2LZE2THumanEsophagusESCC1.46e-032.46e-010.082
9792SERTAD2LZE4THumanEsophagusESCC5.92e-196.02e-010.0811
9792SERTAD2LZE5THumanEsophagusESCC3.53e-033.46e-010.0514
9792SERTAD2LZE7THumanEsophagusESCC1.68e-086.77e-010.0667
9792SERTAD2LZE8THumanEsophagusESCC6.27e-134.24e-010.067
9792SERTAD2LZE20THumanEsophagusESCC7.12e-063.04e-010.0662
9792SERTAD2LZE21D1HumanEsophagusHGIN4.59e-022.56e-010.0632
9792SERTAD2LZE22THumanEsophagusESCC1.20e-033.21e-010.068
9792SERTAD2LZE24THumanEsophagusESCC8.49e-194.90e-010.0596
9792SERTAD2LZE21THumanEsophagusESCC4.74e-097.30e-010.0655
9792SERTAD2LZE6THumanEsophagusESCC2.23e-052.28e-010.0845
9792SERTAD2P1T-EHumanEsophagusESCC7.01e-149.16e-010.0875
9792SERTAD2P2T-EHumanEsophagusESCC4.22e-518.85e-010.1177
9792SERTAD2P4T-EHumanEsophagusESCC1.00e-235.13e-010.1323
9792SERTAD2P5T-EHumanEsophagusESCC2.98e-172.42e-010.1327
9792SERTAD2P8T-EHumanEsophagusESCC7.80e-182.65e-010.0889
9792SERTAD2P9T-EHumanEsophagusESCC4.90e-092.22e-010.1131
9792SERTAD2P10T-EHumanEsophagusESCC1.44e-172.86e-010.116
9792SERTAD2P11T-EHumanEsophagusESCC2.35e-177.61e-010.1426
9792SERTAD2P12T-EHumanEsophagusESCC2.37e-266.59e-010.1122
Page: 1 2 3 4 5 6 

check button Transcriptomic changes along malignancy continuum.
TissueExpression DynamicsAbbreviation
EsophagusThe image shows the transcriptomic changes along malignancy continuum.log2FC in expression of this searched gene in stem-like cells from each diseased tissue sample relative to stem-like cells in normal samples in each tissue plotted against the malignancy continuum. Samples are colored based on if they are from different disease stage.
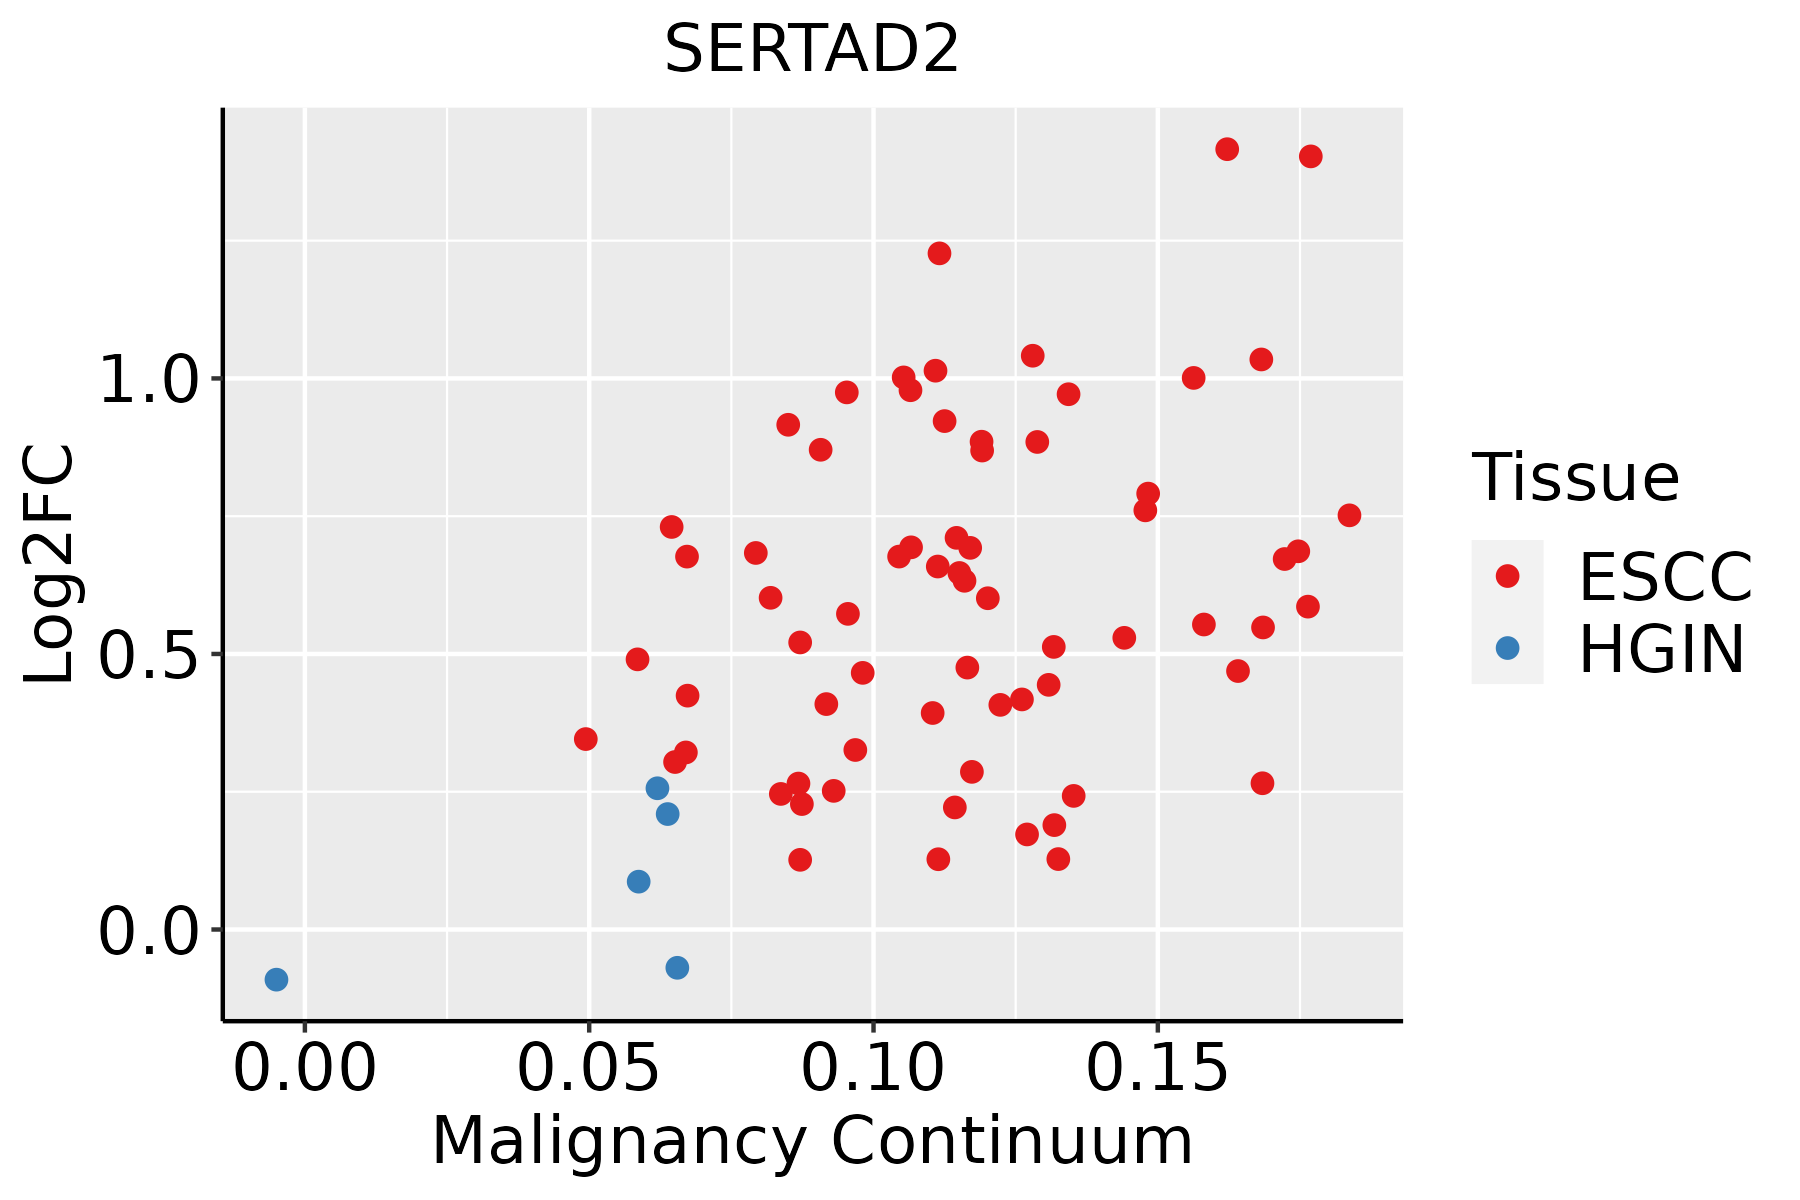
ESCC: Esophageal squamous cell carcinoma
HGIN: High-grade intraepithelial neoplasias
LGIN: Low-grade intraepithelial neoplasias
LiverThe image shows the transcriptomic changes along malignancy continuum.log2FC in expression of this searched gene in stem-like cells from each diseased tissue sample relative to stem-like cells in normal samples in each tissue plotted against the malignancy continuum. Samples are colored based on if they are from different disease stage.
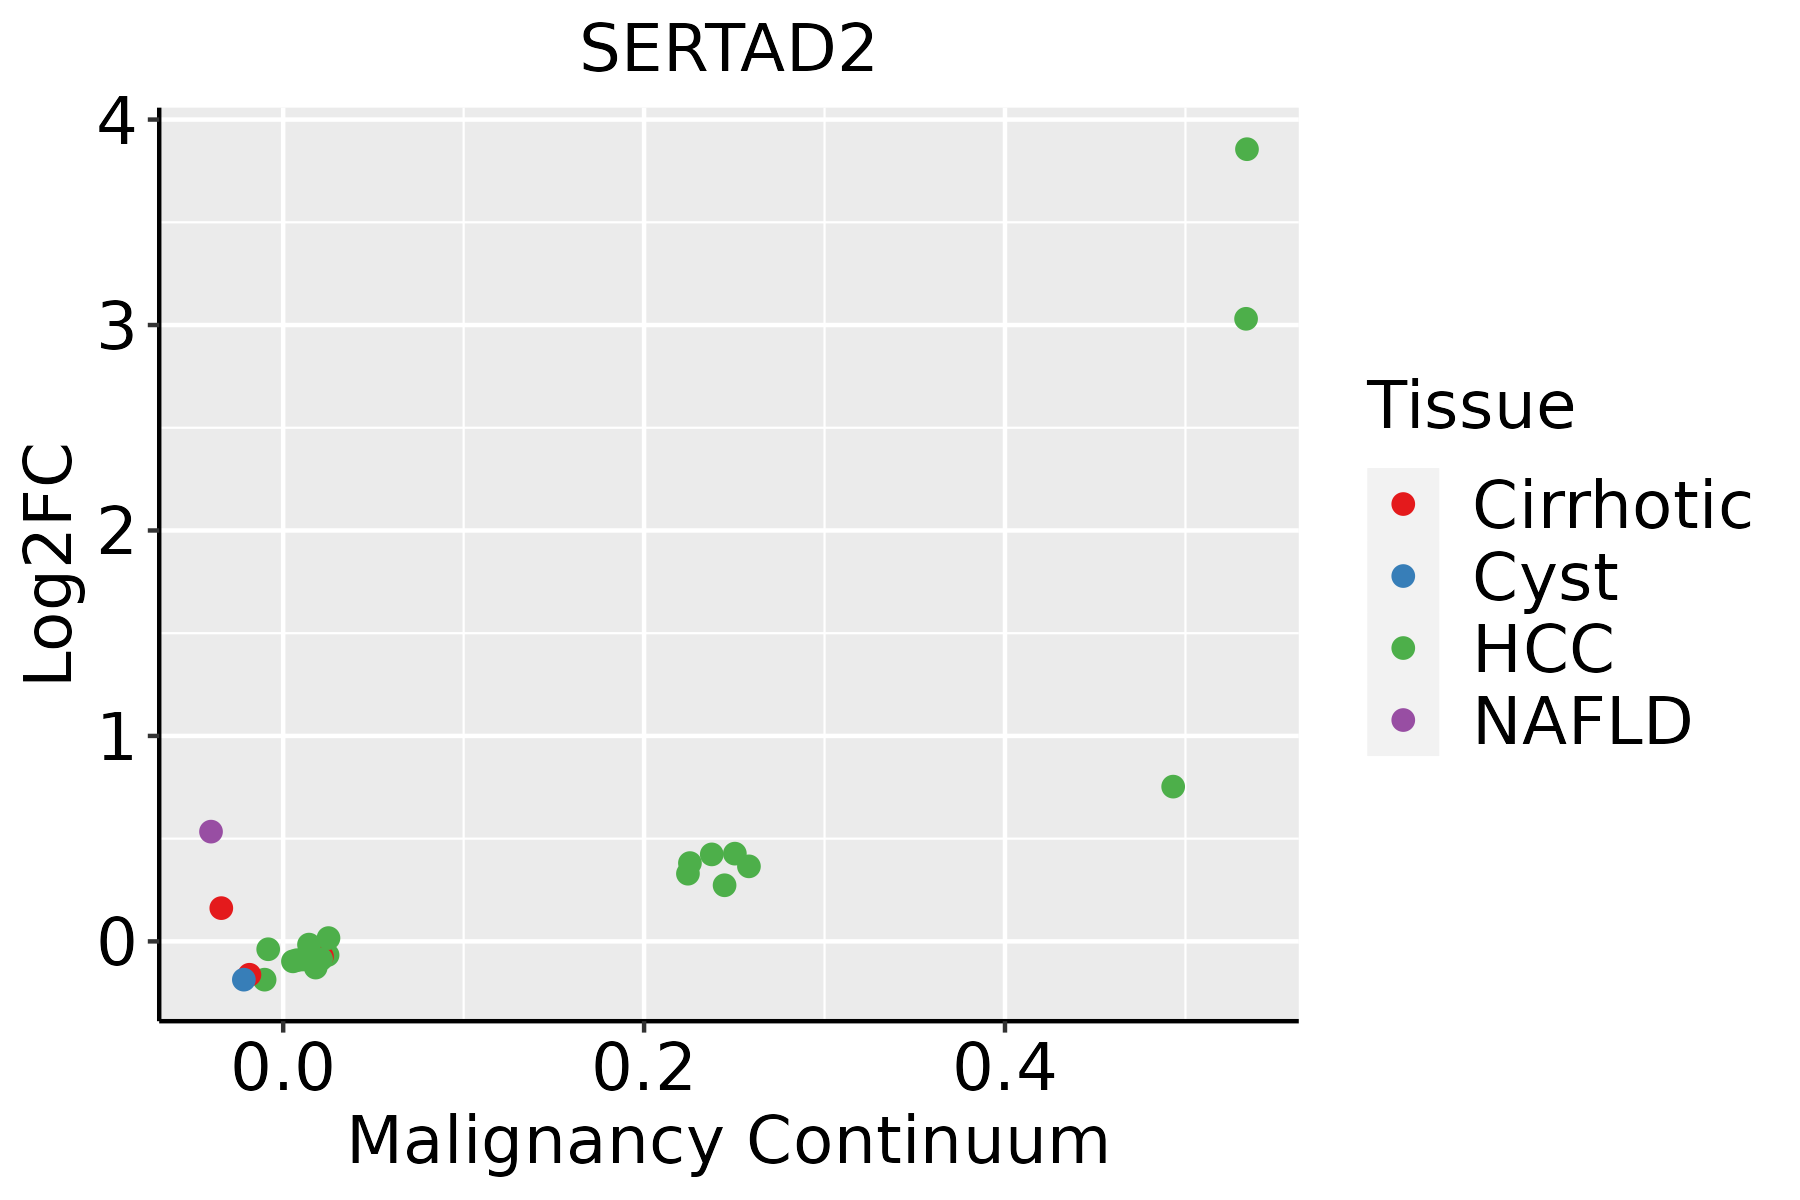
HCC: Hepatocellular carcinoma
NAFLD: Non-alcoholic fatty liver disease
Oral CavityThe image shows the transcriptomic changes along malignancy continuum.log2FC in expression of this searched gene in stem-like cells from each diseased tissue sample relative to stem-like cells in normal samples in each tissue plotted against the malignancy continuum. Samples are colored based on if they are from different disease stage.EOLP: Erosive Oral lichen planus
LP: leukoplakia
NEOLP: Non-erosive oral lichen planus
OSCC: Oral squamous cell carcinoma
ProstateThe image shows the transcriptomic changes along malignancy continuum.log2FC in expression of this searched gene in stem-like cells from each diseased tissue sample relative to stem-like cells in normal samples in each tissue plotted against the malignancy continuum. Samples are colored based on if they are from different disease stage.BPH: Benign Prostatic Hyperplasia
ThyroidThe image shows the transcriptomic changes along malignancy continuum.log2FC in expression of this searched gene in stem-like cells from each diseased tissue sample relative to stem-like cells in normal samples in each tissue plotted against the malignancy continuum. Samples are colored based on if they are from different disease stage.
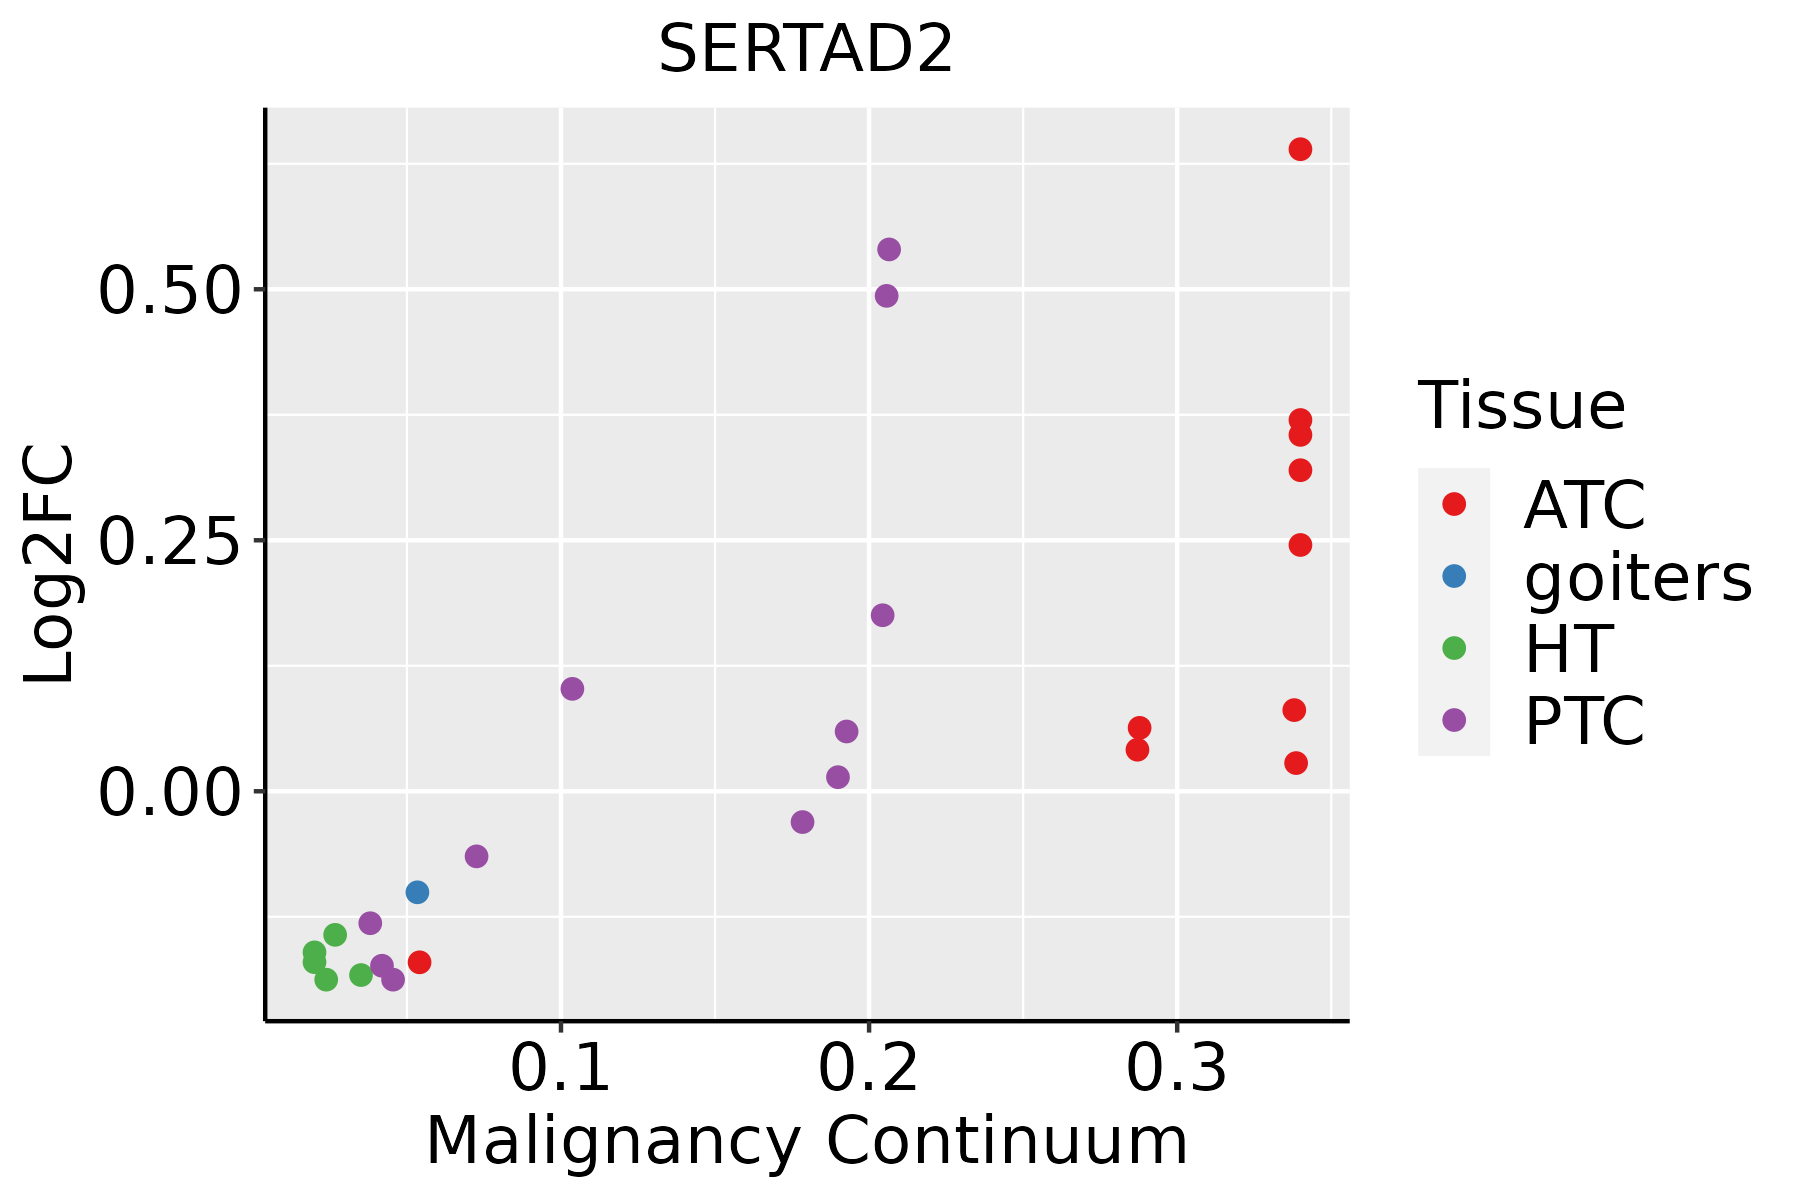
ATC: Anaplastic thyroid cancer
HT: Hashimoto's thyroiditis
PTC: Papillary thyroid cancer
∗log2FC in expression of this searched gene in stem-like cells from each diseased tissue sample relative to stem-like cells in normal samples in each tissue plotted against the malignancy continuum. Samples are colored based on if they are from different disease stage.

Top

Malignant transformation related pathway analysis

check buttonFind out the enriched GO biological processes and KEGG pathways involved in transition from healthy to precancer to cancer
check button Figure of enriched GO biological processes.
TissueDisease StageEnriched GO biological Processes
ColorectumADGO analysis - Figure of enriched GO biological processes: Top 15 enriched GO BP terms are showed in the bar plot of each disease state in each tissue. Each row represents a significant GO biological process which is colored according to the -log10(p.adjust).
ColorectumSERGO analysis - Figure of enriched GO biological processes: Top 15 enriched GO BP terms are showed in the bar plot of each disease state in each tissue. Each row represents a significant GO biological process which is colored according to the -log10(p.adjust).
ColorectumMSSGO analysis - Figure of enriched GO biological processes: Top 15 enriched GO BP terms are showed in the bar plot of each disease state in each tissue. Each row represents a significant GO biological process which is colored according to the -log10(p.adjust).
ColorectumMSI-HGO analysis - Figure of enriched GO biological processes: Top 15 enriched GO BP terms are showed in the bar plot of each disease state in each tissue. Each row represents a significant GO biological process which is colored according to the -log10(p.adjust).
ColorectumFAPGO analysis - Figure of enriched GO biological processes: Top 15 enriched GO BP terms are showed in the bar plot of each disease state in each tissue. Each row represents a significant GO biological process which is colored according to the -log10(p.adjust).
∗Top 15 enriched GO BP terms are showed in the bar plot of each disease state in each tissue. Each row represents a significant GO biological process which is colored according to the -log10(p.adjust).
Page: 1 2 3 4 5 6 7 8 9 

check button Enriched GO biological processes.
GO IDTissueDisease StageDescriptionGene RatioBg Ratiopvaluep.adjustCount
GO:00063687EsophagusHGINtranscription elongation from RNA polymerase II promoter24/258769/187238.93e-062.64e-0424
GO:00063548EsophagusHGINDNA-templated transcription, elongation27/258791/187236.62e-051.52e-0327
GO:001604919EsophagusHGINcell growth93/2587482/187234.49e-046.62e-0393
GO:000155818EsophagusHGINregulation of cell growth76/2587414/187235.40e-034.42e-0276
GO:000635414EsophagusESCCDNA-templated transcription, elongation76/855291/187238.35e-144.11e-1276
GO:0016049110EsophagusESCCcell growth289/8552482/187231.29e-103.77e-09289
GO:000636814EsophagusESCCtranscription elongation from RNA polymerase II promoter56/855269/187231.40e-093.30e-0856
GO:000155819EsophagusESCCregulation of cell growth248/8552414/187232.97e-096.45e-08248
GO:00400295EsophagusESCCregulation of gene expression, epigenetic74/8552105/187232.24e-073.42e-0674
GO:00459267EsophagusESCCnegative regulation of growth148/8552249/187237.88e-067.73e-05148
GO:00480962EsophagusESCCchromatin-mediated maintenance of transcription11/855211/187231.80e-041.16e-0311
GO:00303085EsophagusESCCnegative regulation of cell growth108/8552188/187237.46e-043.87e-03108
GO:0045815EsophagusESCCpositive regulation of gene expression, epigenetic13/855217/187231.00e-023.42e-0213
GO:00160495LiverNAFLDcell growth85/1882482/187231.75e-071.25e-0585
GO:00015585LiverNAFLDregulation of cell growth63/1882414/187235.50e-047.46e-0363
GO:001604911LiverCirrhoticcell growth160/4634482/187231.50e-052.07e-04160
GO:000155811LiverCirrhoticregulation of cell growth132/4634414/187235.53e-044.36e-03132
GO:00063544LiverCirrhoticDNA-templated transcription, elongation35/463491/187232.56e-031.53e-0235
GO:00063683LiverCirrhotictranscription elongation from RNA polymerase II promoter28/463469/187232.70e-031.58e-0228
GO:001604921LiverHCCcell growth269/7958482/187231.84e-095.35e-08269
Page: 1 2 3 4 5 

check button Enriched KEGG pathways.
Pathway IDTissueDisease StageDescriptionGene RatioBg Ratiopvaluep.adjustqvalueCount
Page: 1 

Top

Cell-cell communication analysis

check buttonIdentification of potential cell-cell interactions between two cell types and their ligand-receptor pairs for different disease states
LigandReceptorLRpairPathwayTissueDisease Stage
Page: 1 

Top

Single-cell gene regulatory network inference analysis

check buttonFind out the significant the regulons (TFs) and the target genes of each regulon across cell types for different disease states
TFCell TypeTissueDisease StageTarget GeneRSSRegulon Activity
∗The dot plots of a searched regulon are shown for all cell subpopulations in each disease state of each tissue based on the regulon specific score inferred using pySCENIC and by calculating the average expression.
Page: 1 

Top

Somatic mutation of malignant transformation related genes

check buttonAnnotation of somatic variants for genes involved in malignant transformation
Hugo SymbolVariant ClassVariant ClassificationdbSNP RSHGVScHGVSpHGVSp ShortSWISSPROTBIOTYPESIFTPolyPhenTumor Sample BarcodeTissueHistologySexAgeStageTherapy TypesDrugsOutcome
SERTAD2SNVMissense_Mutationc.897N>Ap.Met299Ilep.M299IQ14140protein_codingtolerated(0.37)benign(0.003)TCGA-A8-A06T-01Breastbreast invasive carcinomaFemale>=65III/IVHormone TherapyanastrozoleSD
SERTAD2SNVMissense_Mutationnovelc.62T>Cp.Ile21Thrp.I21TQ14140protein_codingtolerated(0.34)benign(0.003)TCGA-AQ-A54N-01Breastbreast invasive carcinomaFemale<65I/IIUnknownUnknownSD
SERTAD2insertionNonsense_Mutationnovelc.831_832insCCAGAAGGCATCCATCATGTTGCTTAATTGTCTTCTGCAGCTCCATAATATATTp.Asp277_Asp278insProGluGlyIleHisHisValAlaTerLeuSerSerAlaAlaProTerTyrIlep.D277_D278insPEGIHHVA*LSSAAP*YIQ14140protein_codingTCGA-AO-A0J9-01Breastbreast invasive carcinomaFemale<65III/IVChemotherapycyclophosphamidePD
SERTAD2deletionFrame_Shift_Delnovelc.844delNp.Thr282LeufsTer51p.T282Lfs*51Q14140protein_codingTCGA-EW-A2FV-01Breastbreast invasive carcinomaFemale<65III/IVChemotherapydocetaxelSD
SERTAD2deletionFrame_Shift_Delnovelc.112delNp.Gln38ArgfsTer9p.Q38Rfs*9Q14140protein_codingTCGA-EW-A2FV-01Breastbreast invasive carcinomaFemale<65III/IVChemotherapydocetaxelSD
SERTAD2SNVMissense_Mutationrs377127082c.332C>Tp.Ala111Valp.A111VQ14140protein_codingtolerated(0.17)benign(0)TCGA-2W-A8YY-01Cervixcervical & endocervical cancerFemale<65I/IIChemotherapycisplatinCR
SERTAD2SNVMissense_Mutationnovelc.554N>Tp.Ser185Phep.S185FQ14140protein_codingdeleterious(0.03)possibly_damaging(0.77)TCGA-C5-A8XH-01Cervixcervical & endocervical cancerFemale<65I/IIUnknownUnknownSD
SERTAD2SNVMissense_Mutationnovelc.548C>Tp.Ser183Phep.S183FQ14140protein_codingdeleterious(0.02)possibly_damaging(0.459)TCGA-C5-A902-01Cervixcervical & endocervical cancerFemale<65I/IIChemotherapycisplatinSD
SERTAD2insertionFrame_Shift_Insnovelc.811_812insAp.Met271AsnfsTer108p.M271Nfs*108Q14140protein_codingTCGA-EA-A410-01Cervixcervical & endocervical cancerFemale<65I/IIUnknownUnknownSD
SERTAD2SNVMissense_Mutationrs760388077c.595A>Gp.Thr199Alap.T199AQ14140protein_codingtolerated(0.77)benign(0)TCGA-AA-3663-01Colorectumcolon adenocarcinomaMale<65I/IIUnknownUnknownSD
Page: 1 2 3 4 

Top

Related drugs of malignant transformation related genes

check buttonIdentification of chemicals and drugs interact with genes involved in malignant transfromation
(DGIdb 4.0)
Entrez IDSymbolCategoryInteraction TypesDrug Claim NameDrug NamePMIDs
Page: 1