
|
|||||
|
 | |
| |
| |
| |
| |
| |
|
Gene: SERPINI1 |
Gene summary for SERPINI1 |
| Gene information | Species | Human | Gene symbol | SERPINI1 | Gene ID | 5274 |
| Gene name | serpin family I member 1 | |
| Gene Alias | HNS-S1 | |
| Cytomap | 3q26.1 | |
| Gene Type | protein-coding | GO ID | GO:0006508 | UniProtAcc | A0A0S2Z455 |
Top |
Malignant transformation analysis |
| Identification of the aberrant gene expression in precancerous and cancerous lesions by comparing the gene expression of stem-like cells in diseased tissues with normal stem cells |
| Entrez ID | Symbol | Replicates | Species | Organ | Tissue | Adj P-value | Log2FC | Malignancy |
| 5274 | SERPINI1 | LZE24T | Human | Esophagus | ESCC | 1.29e-04 | 1.81e-01 | 0.0596 |
| 5274 | SERPINI1 | LZE21T | Human | Esophagus | ESCC | 2.46e-02 | 1.89e-01 | 0.0655 |
| 5274 | SERPINI1 | P2T-E | Human | Esophagus | ESCC | 1.56e-04 | 4.39e-02 | 0.1177 |
| 5274 | SERPINI1 | P4T-E | Human | Esophagus | ESCC | 8.69e-10 | 3.22e-01 | 0.1323 |
| 5274 | SERPINI1 | P8T-E | Human | Esophagus | ESCC | 5.02e-08 | 6.79e-02 | 0.0889 |
| 5274 | SERPINI1 | P10T-E | Human | Esophagus | ESCC | 2.67e-03 | 8.27e-02 | 0.116 |
| 5274 | SERPINI1 | P12T-E | Human | Esophagus | ESCC | 1.72e-02 | 1.21e-01 | 0.1122 |
| 5274 | SERPINI1 | P16T-E | Human | Esophagus | ESCC | 1.54e-03 | 6.10e-02 | 0.1153 |
| 5274 | SERPINI1 | P23T-E | Human | Esophagus | ESCC | 1.61e-06 | 2.99e-01 | 0.108 |
| 5274 | SERPINI1 | P26T-E | Human | Esophagus | ESCC | 7.71e-41 | 9.67e-01 | 0.1276 |
| 5274 | SERPINI1 | P27T-E | Human | Esophagus | ESCC | 1.53e-10 | 3.19e-01 | 0.1055 |
| 5274 | SERPINI1 | P36T-E | Human | Esophagus | ESCC | 1.43e-08 | 3.11e-01 | 0.1187 |
| 5274 | SERPINI1 | P48T-E | Human | Esophagus | ESCC | 6.85e-05 | 2.23e-01 | 0.0959 |
| 5274 | SERPINI1 | P52T-E | Human | Esophagus | ESCC | 6.54e-05 | 1.89e-01 | 0.1555 |
| 5274 | SERPINI1 | P62T-E | Human | Esophagus | ESCC | 2.94e-04 | 1.42e-01 | 0.1302 |
| 5274 | SERPINI1 | P74T-E | Human | Esophagus | ESCC | 1.70e-11 | 4.00e-01 | 0.1479 |
| 5274 | SERPINI1 | P76T-E | Human | Esophagus | ESCC | 2.27e-03 | 2.22e-01 | 0.1207 |
| 5274 | SERPINI1 | P79T-E | Human | Esophagus | ESCC | 1.14e-06 | 3.66e-01 | 0.1154 |
| 5274 | SERPINI1 | P128T-E | Human | Esophagus | ESCC | 3.01e-14 | 5.76e-01 | 0.1241 |
| 5274 | SERPINI1 | HCC1_Meng | Human | Liver | HCC | 3.02e-42 | 1.79e-01 | 0.0246 |
| Page: 1 2 |
| Tissue | Expression Dynamics | Abbreviation |
| Esophagus | 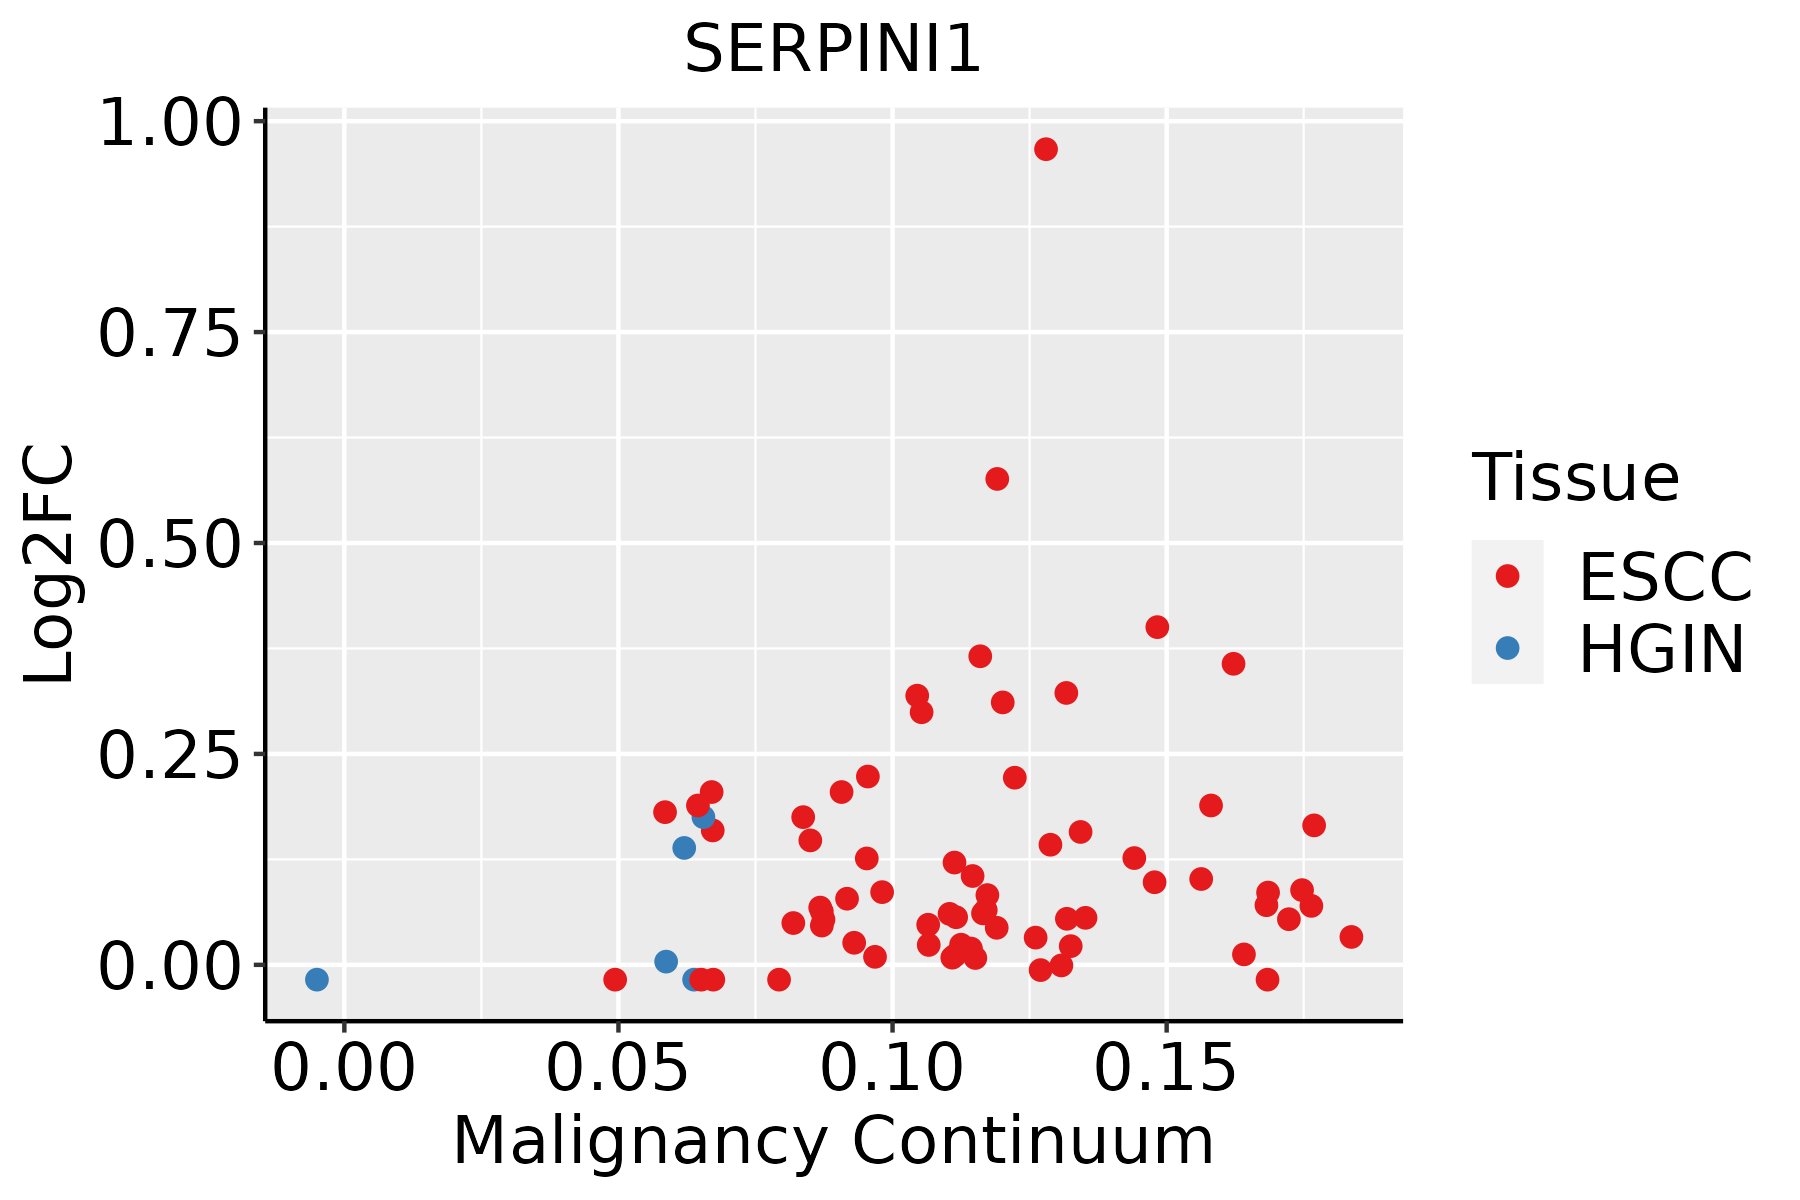 | ESCC: Esophageal squamous cell carcinoma |
| HGIN: High-grade intraepithelial neoplasias | ||
| LGIN: Low-grade intraepithelial neoplasias | ||
| Liver |  | HCC: Hepatocellular carcinoma |
| NAFLD: Non-alcoholic fatty liver disease |
| ∗log2FC in expression of this searched gene in stem-like cells from each diseased tissue sample relative to stem-like cells in normal samples in each tissue plotted against the malignancy continuum. Samples are colored based on if they are from different disease stage. |
Top |
Malignant transformation related pathway analysis |
| Find out the enriched GO biological processes and KEGG pathways involved in transition from healthy to precancer to cancer |
| Tissue | Disease Stage | Enriched GO biological Processes |
| Colorectum | AD |  |
| Colorectum | SER |  |
| Colorectum | MSS |  |
| Colorectum | MSI-H |  |
| Colorectum | FAP |  |
| ∗Top 15 enriched GO BP terms are showed in the bar plot of each disease state in each tissue. Each row represents a significant GO biological process which is colored according to the -log10(p.adjust). |
| Page: 1 2 3 4 5 6 7 8 9 |
| GO ID | Tissue | Disease Stage | Description | Gene Ratio | Bg Ratio | pvalue | p.adjust | Count |
| GO:0052547111 | Esophagus | ESCC | regulation of peptidase activity | 275/8552 | 461/18723 | 7.54e-10 | 1.88e-08 | 275 |
| GO:0052548111 | Esophagus | ESCC | regulation of endopeptidase activity | 253/8552 | 432/18723 | 3.68e-08 | 6.78e-07 | 253 |
| GO:003134616 | Esophagus | ESCC | positive regulation of cell projection organization | 201/8552 | 353/18723 | 1.19e-05 | 1.11e-04 | 201 |
| GO:0045861111 | Esophagus | ESCC | negative regulation of proteolysis | 195/8552 | 351/18723 | 1.13e-04 | 7.85e-04 | 195 |
| GO:0051346110 | Esophagus | ESCC | negative regulation of hydrolase activity | 208/8552 | 379/18723 | 1.76e-04 | 1.14e-03 | 208 |
| GO:001097516 | Esophagus | ESCC | regulation of neuron projection development | 240/8552 | 445/18723 | 2.48e-04 | 1.53e-03 | 240 |
| GO:00109764 | Esophagus | ESCC | positive regulation of neuron projection development | 91/8552 | 163/18723 | 5.72e-03 | 2.13e-02 | 91 |
| GO:001046620 | Esophagus | ESCC | negative regulation of peptidase activity | 140/8552 | 262/18723 | 6.73e-03 | 2.46e-02 | 140 |
| GO:001095119 | Esophagus | ESCC | negative regulation of endopeptidase activity | 135/8552 | 252/18723 | 6.86e-03 | 2.51e-02 | 135 |
| GO:005254722 | Liver | HCC | regulation of peptidase activity | 247/7958 | 461/18723 | 8.28e-07 | 1.27e-05 | 247 |
| GO:003134611 | Liver | HCC | positive regulation of cell projection organization | 193/7958 | 353/18723 | 2.28e-06 | 3.08e-05 | 193 |
| GO:005254822 | Liver | HCC | regulation of endopeptidase activity | 230/7958 | 432/18723 | 3.58e-06 | 4.68e-05 | 230 |
| GO:004586122 | Liver | HCC | negative regulation of proteolysis | 186/7958 | 351/18723 | 4.19e-05 | 4.11e-04 | 186 |
| GO:005134622 | Liver | HCC | negative regulation of hydrolase activity | 195/7958 | 379/18723 | 2.44e-04 | 1.82e-03 | 195 |
| GO:001097511 | Liver | HCC | regulation of neuron projection development | 220/7958 | 445/18723 | 1.68e-03 | 8.78e-03 | 220 |
| GO:0010976 | Liver | HCC | positive regulation of neuron projection development | 88/7958 | 163/18723 | 1.98e-03 | 1.00e-02 | 88 |
| GO:001095121 | Liver | HCC | negative regulation of endopeptidase activity | 129/7958 | 252/18723 | 3.17e-03 | 1.47e-02 | 129 |
| GO:001046621 | Liver | HCC | negative regulation of peptidase activity | 132/7958 | 262/18723 | 5.82e-03 | 2.42e-02 | 132 |
| Page: 1 |
| Pathway ID | Tissue | Disease Stage | Description | Gene Ratio | Bg Ratio | pvalue | p.adjust | qvalue | Count |
| Page: 1 |
Top |
Cell-cell communication analysis |
| Identification of potential cell-cell interactions between two cell types and their ligand-receptor pairs for different disease states |
| Ligand | Receptor | LRpair | Pathway | Tissue | Disease Stage |
| Page: 1 |
Top |
Single-cell gene regulatory network inference analysis |
| Find out the significant the regulons (TFs) and the target genes of each regulon across cell types for different disease states |
| TF | Cell Type | Tissue | Disease Stage | Target Gene | RSS | Regulon Activity |
| ∗The dot plots of a searched regulon are shown for all cell subpopulations in each disease state of each tissue based on the regulon specific score inferred using pySCENIC and by calculating the average expression. |
| Page: 1 |
Top |
Somatic mutation of malignant transformation related genes |
| Annotation of somatic variants for genes involved in malignant transformation |
| Hugo Symbol | Variant Class | Variant Classification | dbSNP RS | HGVSc | HGVSp | HGVSp Short | SWISSPROT | BIOTYPE | SIFT | PolyPhen | Tumor Sample Barcode | Tissue | Histology | Sex | Age | Stage | Therapy Types | Drugs | Outcome |
| SERPINI1 | SNV | Missense_Mutation | c.127N>A | p.Asp43Asn | p.D43N | Q99574 | protein_coding | tolerated(0.6) | possibly_damaging(0.592) | TCGA-AN-A041-01 | Breast | breast invasive carcinoma | Female | <65 | I/II | Unknown | Unknown | SD | |
| SERPINI1 | SNV | Missense_Mutation | c.550G>T | p.Val184Phe | p.V184F | Q99574 | protein_coding | deleterious(0) | possibly_damaging(0.675) | TCGA-BH-A0HY-01 | Breast | breast invasive carcinoma | Female | <65 | I/II | Hormone Therapy | taxotere | CR | |
| SERPINI1 | SNV | Missense_Mutation | novel | c.788N>G | p.Pro263Arg | p.P263R | Q99574 | protein_coding | tolerated(0.25) | probably_damaging(0.995) | TCGA-C5-A1BQ-01 | Cervix | cervical & endocervical cancer | Female | >=65 | III/IV | Chemotherapy | cisplatin | CR |
| SERPINI1 | SNV | Missense_Mutation | novel | c.374N>G | p.Leu125Trp | p.L125W | Q99574 | protein_coding | deleterious(0) | probably_damaging(0.992) | TCGA-DS-A7WI-01 | Cervix | cervical & endocervical cancer | Female | <65 | I/II | Chemotherapy | cisplatin | PD |
| SERPINI1 | SNV | Missense_Mutation | c.799N>G | p.Leu267Val | p.L267V | Q99574 | protein_coding | tolerated(0.51) | benign(0.067) | TCGA-JW-A5VL-01 | Cervix | cervical & endocervical cancer | Female | <65 | I/II | Unknown | Unknown | SD | |
| SERPINI1 | SNV | Missense_Mutation | c.46N>T | p.Ala16Ser | p.A16S | Q99574 | protein_coding | tolerated(0.99) | benign(0.028) | TCGA-A6-2677-01 | Colorectum | colon adenocarcinoma | Female | >=65 | III/IV | Ancillary | leucovorin | SD | |
| SERPINI1 | SNV | Missense_Mutation | c.1131N>A | p.Phe377Leu | p.F377L | Q99574 | protein_coding | tolerated(1) | benign(0.069) | TCGA-A6-6141-01 | Colorectum | colon adenocarcinoma | Male | <65 | I/II | Chemotherapy | 5-fu | SD | |
| SERPINI1 | SNV | Missense_Mutation | c.242N>A | p.Leu81Gln | p.L81Q | Q99574 | protein_coding | tolerated(0.67) | probably_damaging(0.992) | TCGA-AA-3833-01 | Colorectum | colon adenocarcinoma | Female | <65 | I/II | Unknown | Unknown | SD | |
| SERPINI1 | SNV | Missense_Mutation | rs745438717 | c.608N>A | p.Ser203Tyr | p.S203Y | Q99574 | protein_coding | deleterious(0.01) | probably_damaging(1) | TCGA-CA-6717-01 | Colorectum | colon adenocarcinoma | Male | <65 | I/II | Chemotherapy | oxaliplatin | CR |
| SERPINI1 | SNV | Missense_Mutation | novel | c.945N>G | p.Ile315Met | p.I315M | Q99574 | protein_coding | deleterious(0.03) | possibly_damaging(0.585) | TCGA-CA-6717-01 | Colorectum | colon adenocarcinoma | Male | <65 | I/II | Chemotherapy | oxaliplatin | CR |
| Page: 1 2 3 4 5 6 7 8 |
Top |
Related drugs of malignant transformation related genes |
| Identification of chemicals and drugs interact with genes involved in malignant transfromation |
| (DGIdb 4.0) |
| Entrez ID | Symbol | Category | Interaction Types | Drug Claim Name | Drug Name | PMIDs |
| Page: 1 |

Copyright 2023-Present -The University of Texas Health Science Center at Houston |