
|
|||||
|
 | |
| |
| |
| |
| |
| |
|
Gene: SERPINH1 |
Gene summary for SERPINH1 |
| Gene information | Species | Human | Gene symbol | SERPINH1 | Gene ID | 871 |
| Gene name | serpin family H member 1 | |
| Gene Alias | AsTP3 | |
| Cytomap | 11q13.5 | |
| Gene Type | protein-coding | GO ID | GO:0001501 | UniProtAcc | A0A024R5K8 |
Top |
Malignant transformation analysis |
| Identification of the aberrant gene expression in precancerous and cancerous lesions by comparing the gene expression of stem-like cells in diseased tissues with normal stem cells |
| Entrez ID | Symbol | Replicates | Species | Organ | Tissue | Adj P-value | Log2FC | Malignancy |
| 871 | SERPINH1 | sample1 | Human | Cervix | CC | 1.24e-19 | 7.40e-01 | 0.0959 |
| 871 | SERPINH1 | T1 | Human | Cervix | CC | 1.79e-29 | 7.18e-01 | 0.0918 |
| 871 | SERPINH1 | HTA11_3410_2000001011 | Human | Colorectum | AD | 2.04e-04 | 2.05e-01 | 0.0155 |
| 871 | SERPINH1 | HTA11_2487_2000001011 | Human | Colorectum | SER | 2.59e-03 | 2.67e-01 | -0.1808 |
| 871 | SERPINH1 | HTA11_1938_2000001011 | Human | Colorectum | AD | 2.83e-13 | 5.73e-01 | -0.0811 |
| 871 | SERPINH1 | HTA11_78_2000001011 | Human | Colorectum | AD | 3.06e-05 | 3.31e-01 | -0.1088 |
| 871 | SERPINH1 | HTA11_347_2000001011 | Human | Colorectum | AD | 1.46e-13 | 3.76e-01 | -0.1954 |
| 871 | SERPINH1 | HTA11_3361_2000001011 | Human | Colorectum | AD | 2.43e-04 | 3.01e-01 | -0.1207 |
| 871 | SERPINH1 | HTA11_83_2000001011 | Human | Colorectum | SER | 5.95e-04 | 3.14e-01 | -0.1526 |
| 871 | SERPINH1 | HTA11_696_2000001011 | Human | Colorectum | AD | 1.80e-12 | 3.46e-01 | -0.1464 |
| 871 | SERPINH1 | HTA11_866_2000001011 | Human | Colorectum | AD | 3.47e-09 | 2.85e-01 | -0.1001 |
| 871 | SERPINH1 | HTA11_1391_2000001011 | Human | Colorectum | AD | 3.81e-15 | 5.06e-01 | -0.059 |
| 871 | SERPINH1 | HTA11_5212_2000001011 | Human | Colorectum | AD | 1.51e-02 | 2.93e-01 | -0.2061 |
| 871 | SERPINH1 | HTA11_5216_2000001011 | Human | Colorectum | SER | 3.01e-02 | 3.55e-01 | -0.1462 |
| 871 | SERPINH1 | HTA11_546_2000001011 | Human | Colorectum | AD | 1.53e-05 | 4.07e-01 | -0.0842 |
| 871 | SERPINH1 | HTA11_7862_2000001011 | Human | Colorectum | AD | 1.85e-02 | 3.14e-01 | -0.0179 |
| 871 | SERPINH1 | HTA11_866_3004761011 | Human | Colorectum | AD | 4.55e-37 | 7.68e-01 | 0.096 |
| 871 | SERPINH1 | HTA11_8622_2000001021 | Human | Colorectum | SER | 4.02e-08 | 5.85e-01 | 0.0528 |
| 871 | SERPINH1 | HTA11_7663_2000001011 | Human | Colorectum | SER | 2.94e-08 | 5.77e-01 | 0.0131 |
| 871 | SERPINH1 | HTA11_10623_2000001011 | Human | Colorectum | AD | 3.73e-04 | 3.96e-01 | -0.0177 |
| Page: 1 2 3 4 5 6 7 8 9 10 11 |
| Tissue | Expression Dynamics | Abbreviation |
| Cervix | 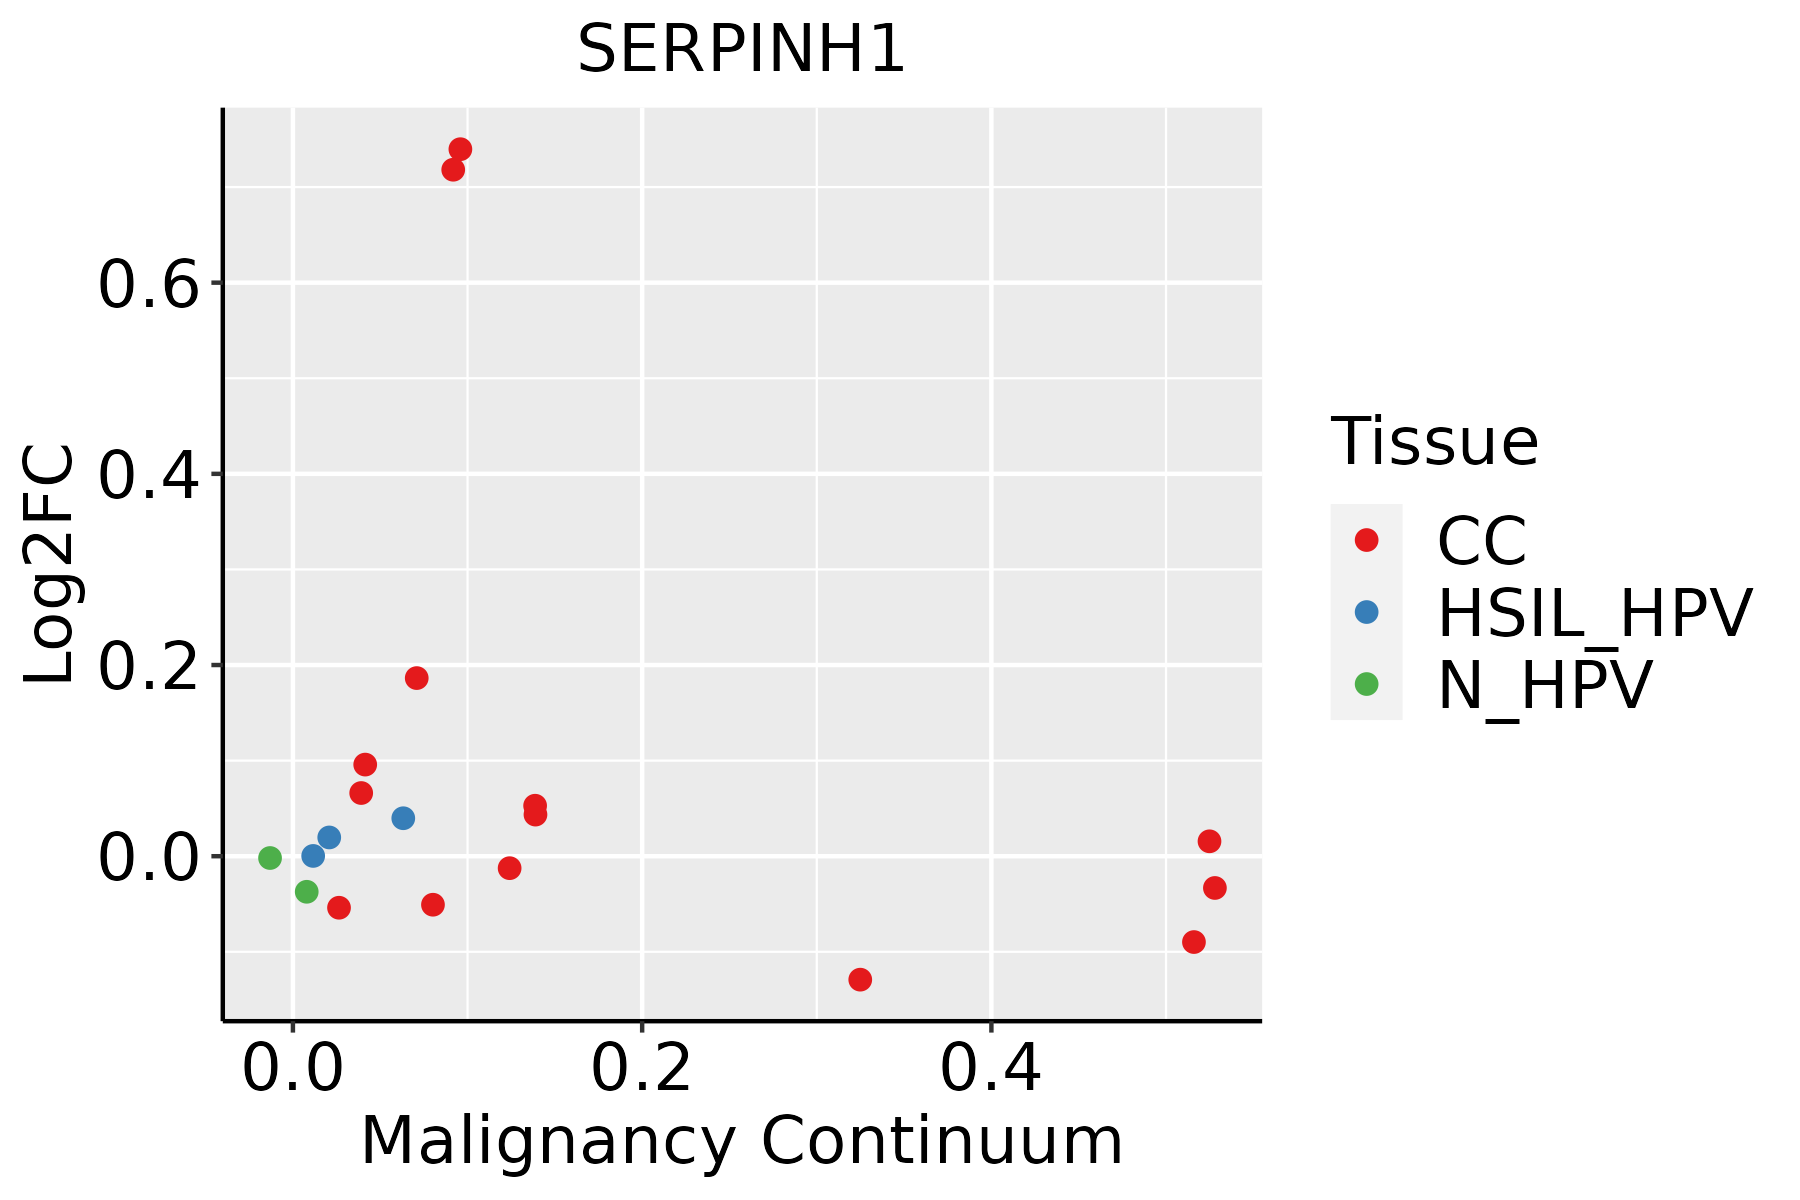 | CC: Cervix cancer |
| HSIL_HPV: HPV-infected high-grade squamous intraepithelial lesions | ||
| N_HPV: HPV-infected normal cervix | ||
| Colorectum (GSE201348) | 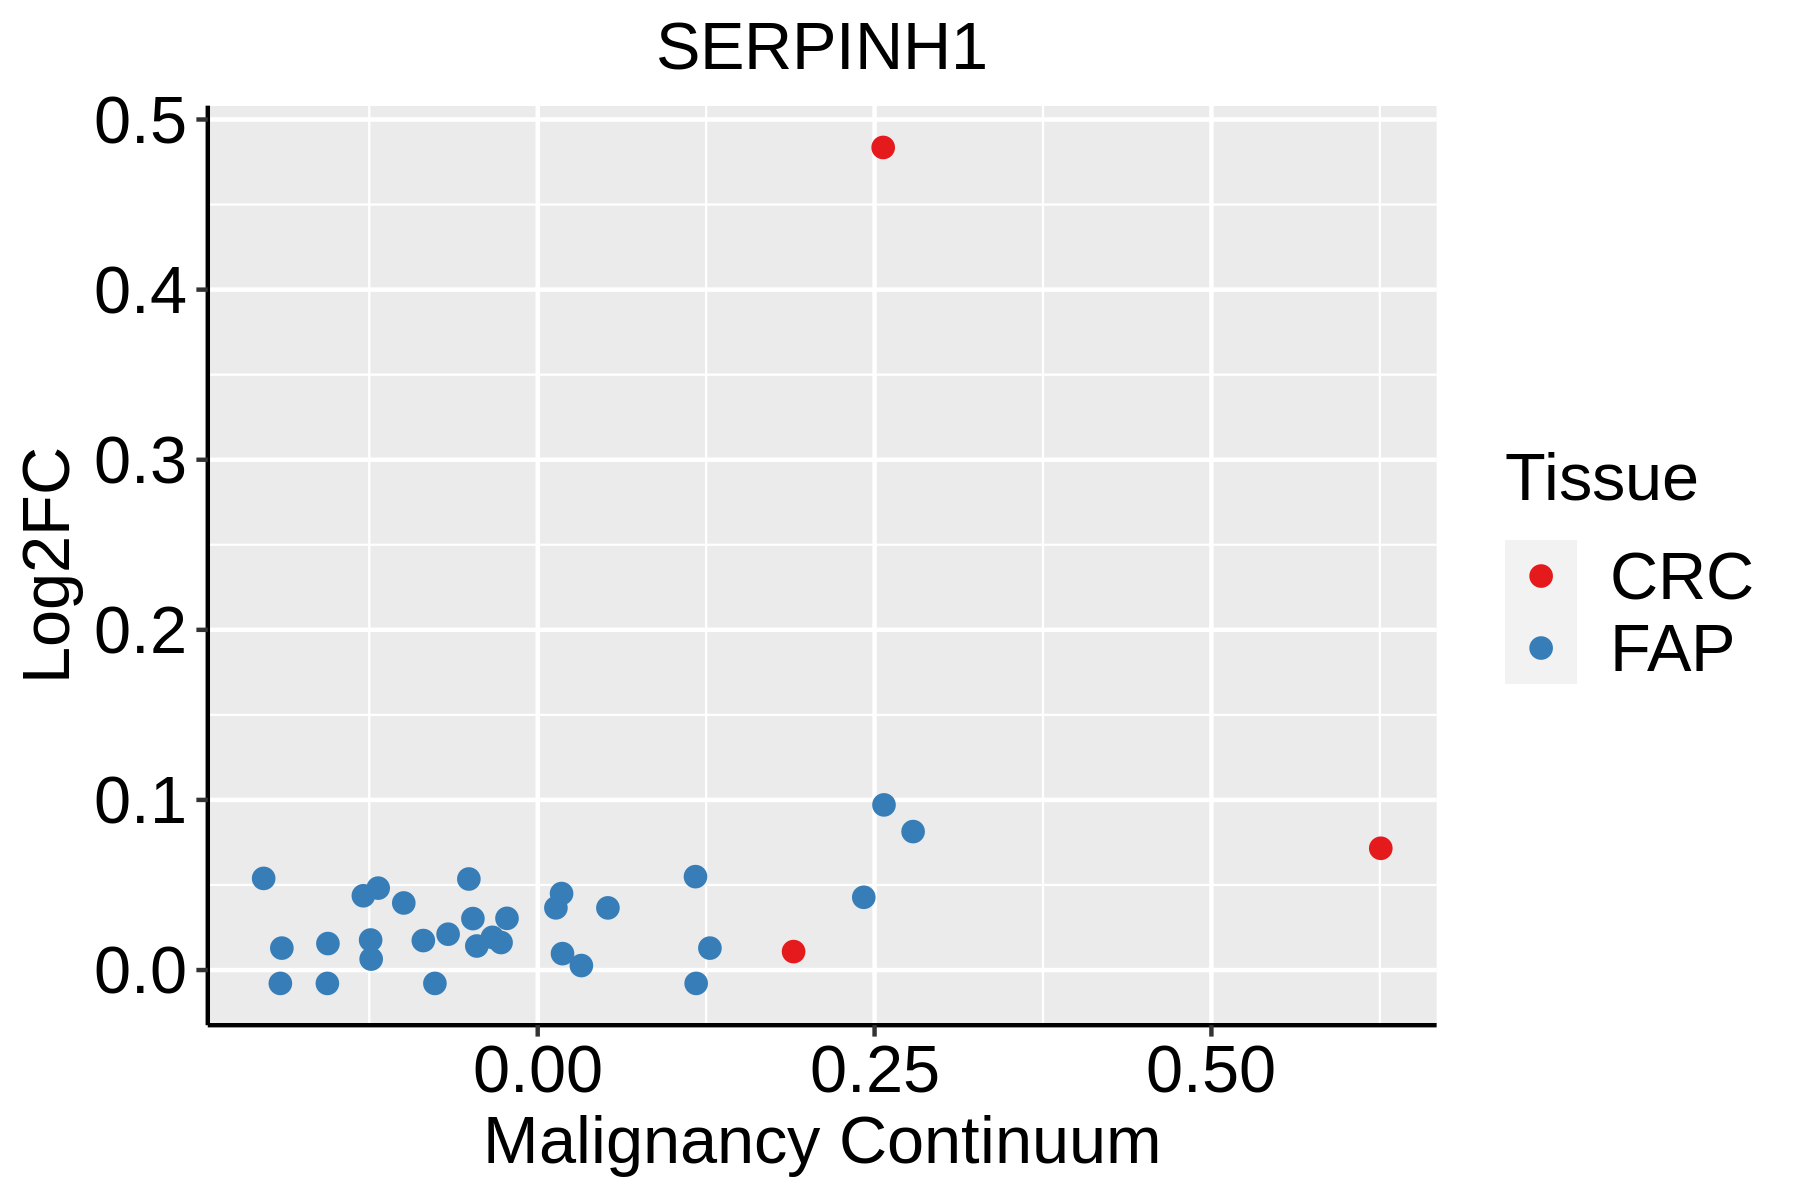 | FAP: Familial adenomatous polyposis |
| CRC: Colorectal cancer | ||
| Colorectum (HTA11) |  | AD: Adenomas |
| SER: Sessile serrated lesions | ||
| MSI-H: Microsatellite-high colorectal cancer | ||
| MSS: Microsatellite stable colorectal cancer | ||
| Endometrium | 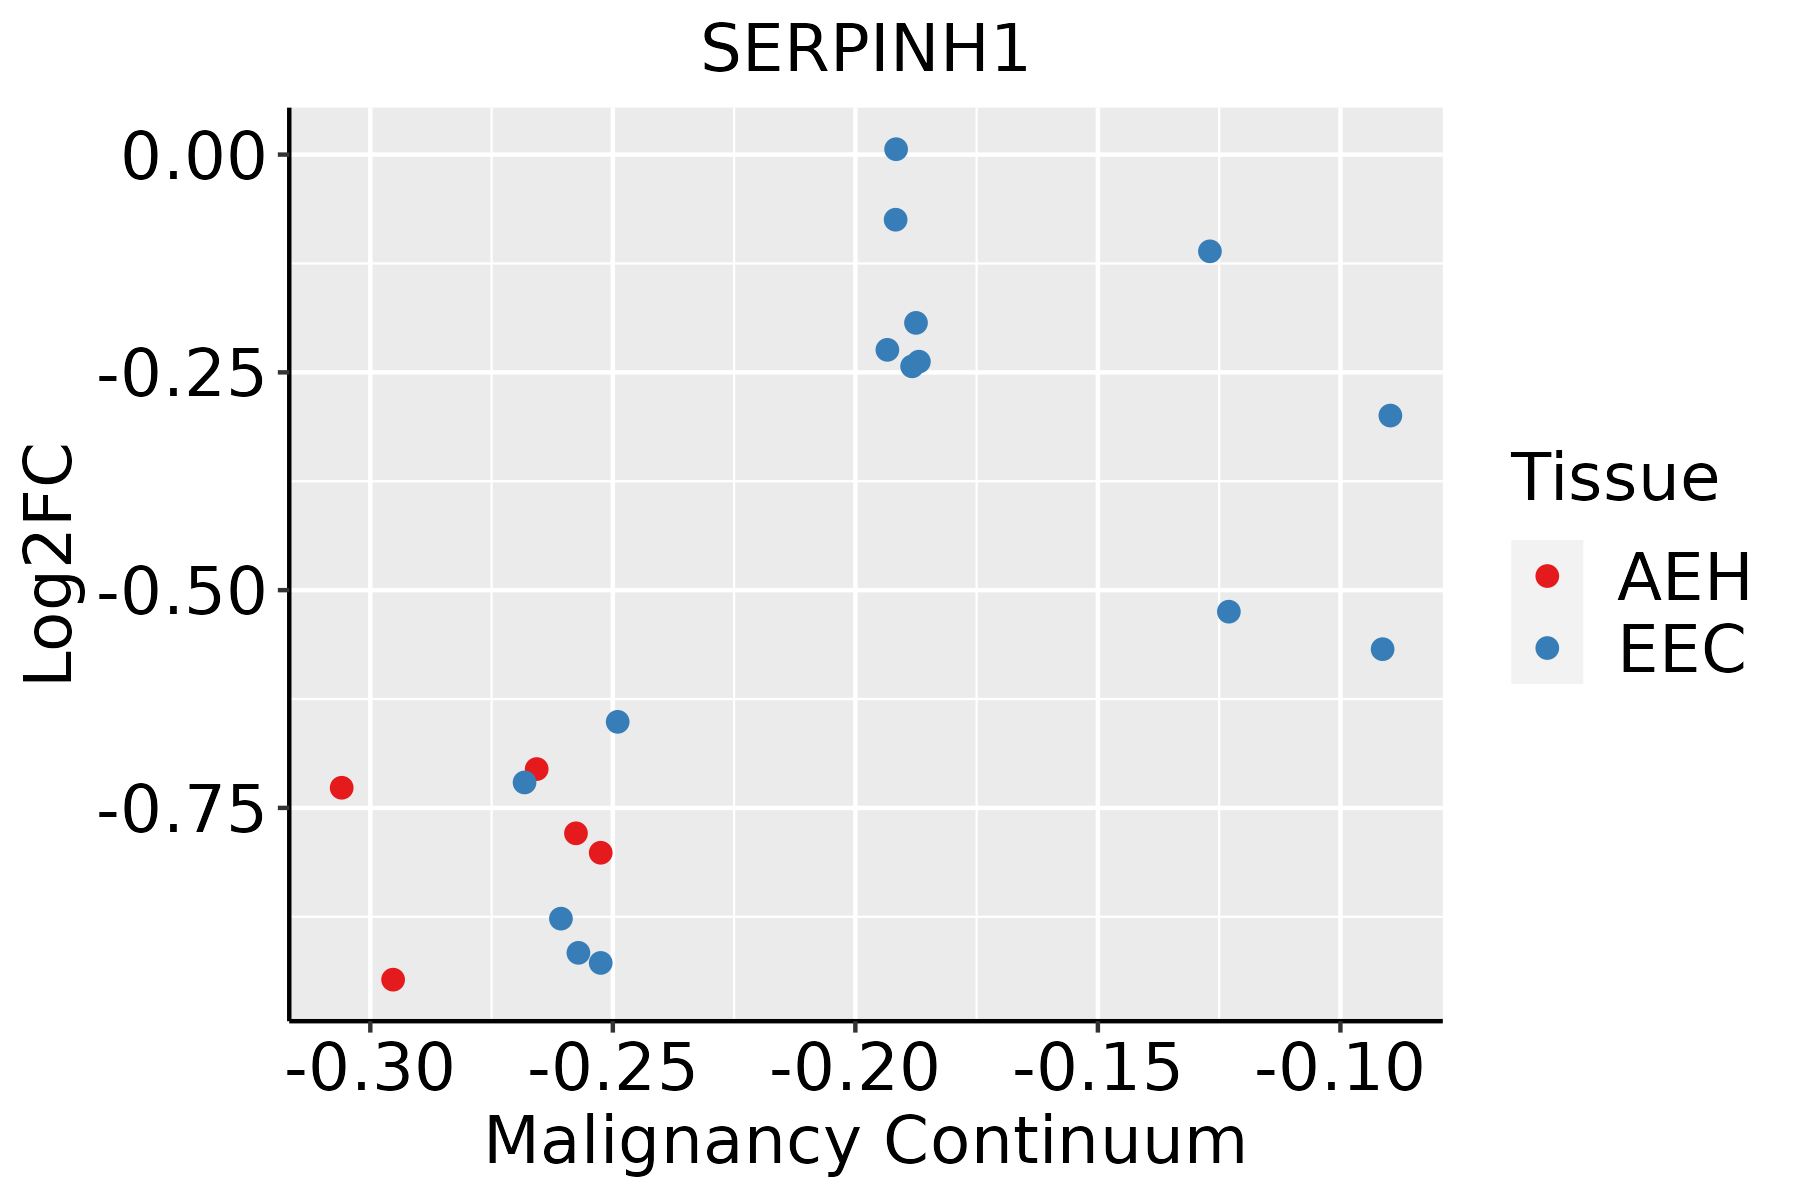 | AEH: Atypical endometrial hyperplasia |
| EEC: Endometrioid Cancer | ||
| Esophagus | 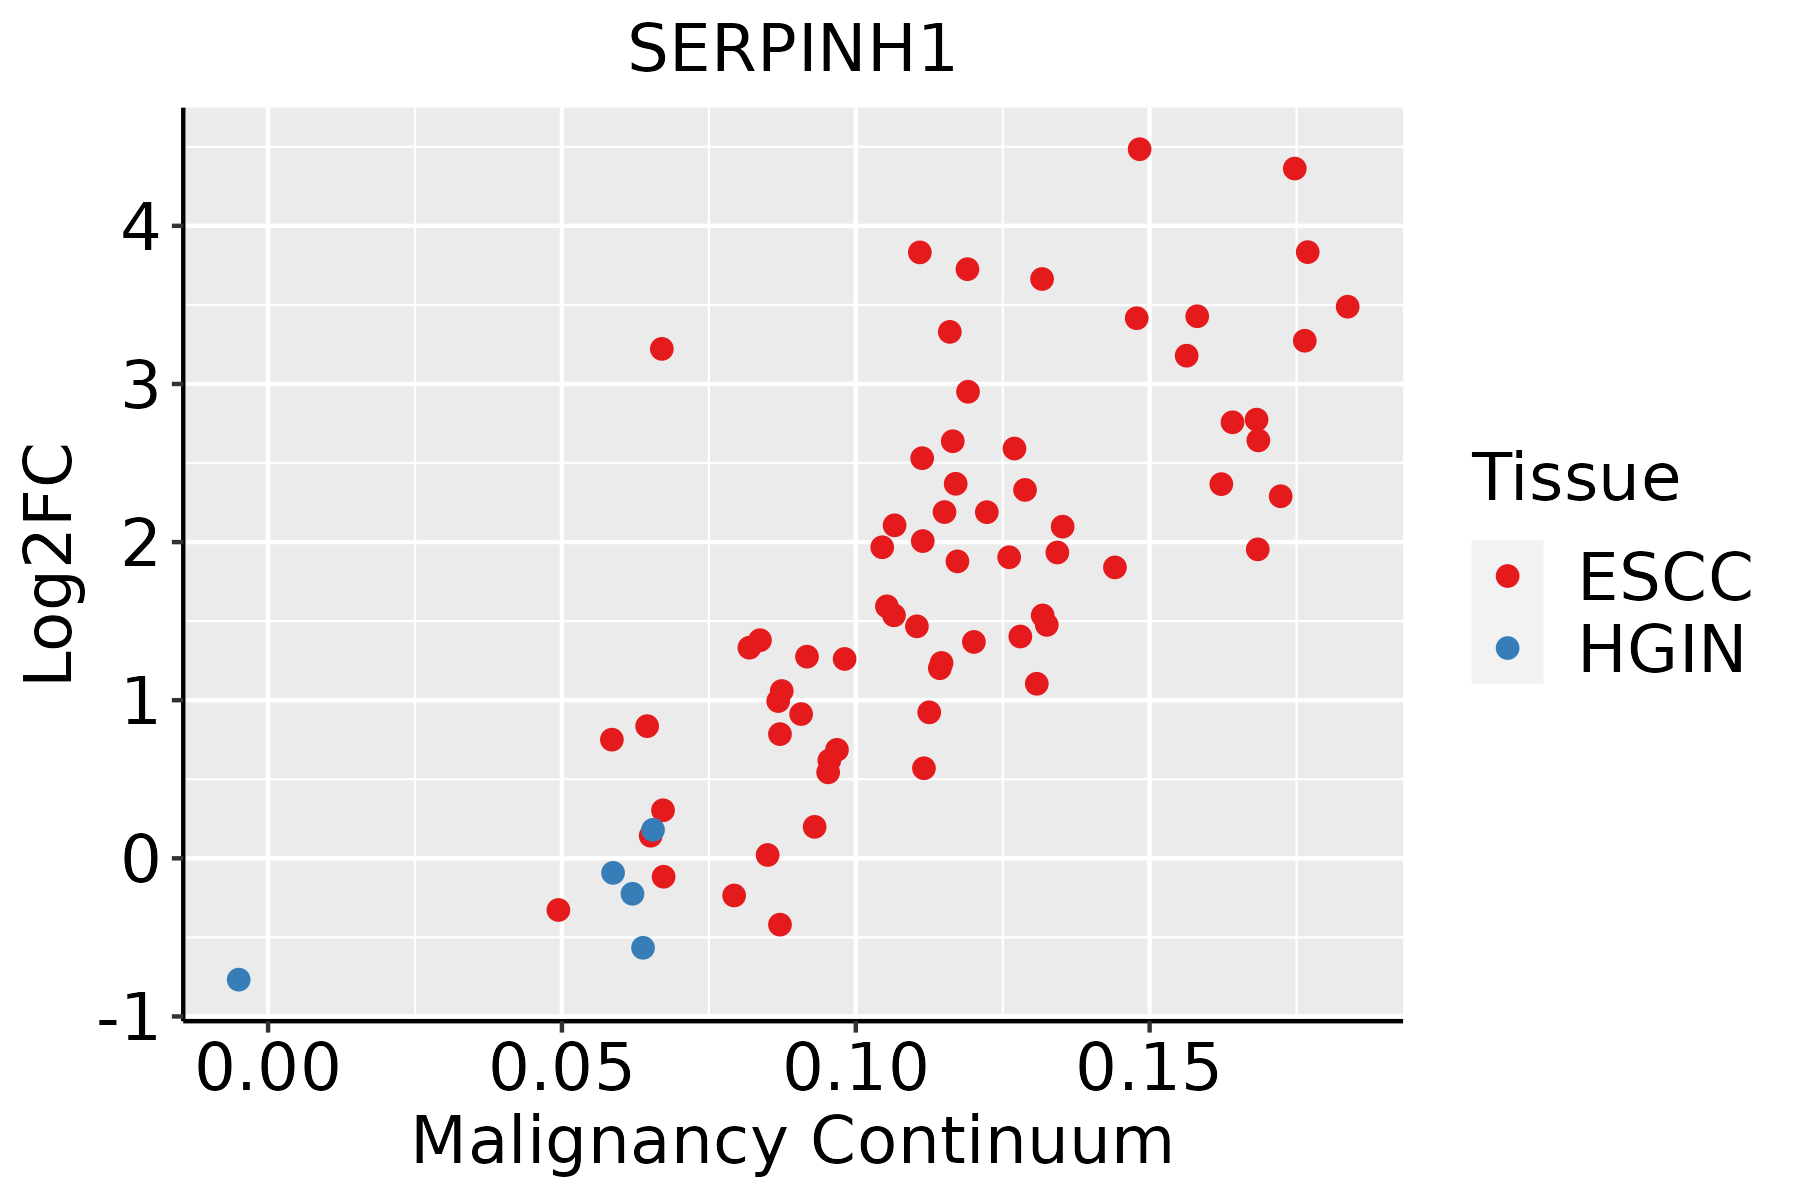 | ESCC: Esophageal squamous cell carcinoma |
| HGIN: High-grade intraepithelial neoplasias | ||
| LGIN: Low-grade intraepithelial neoplasias | ||
| GC | 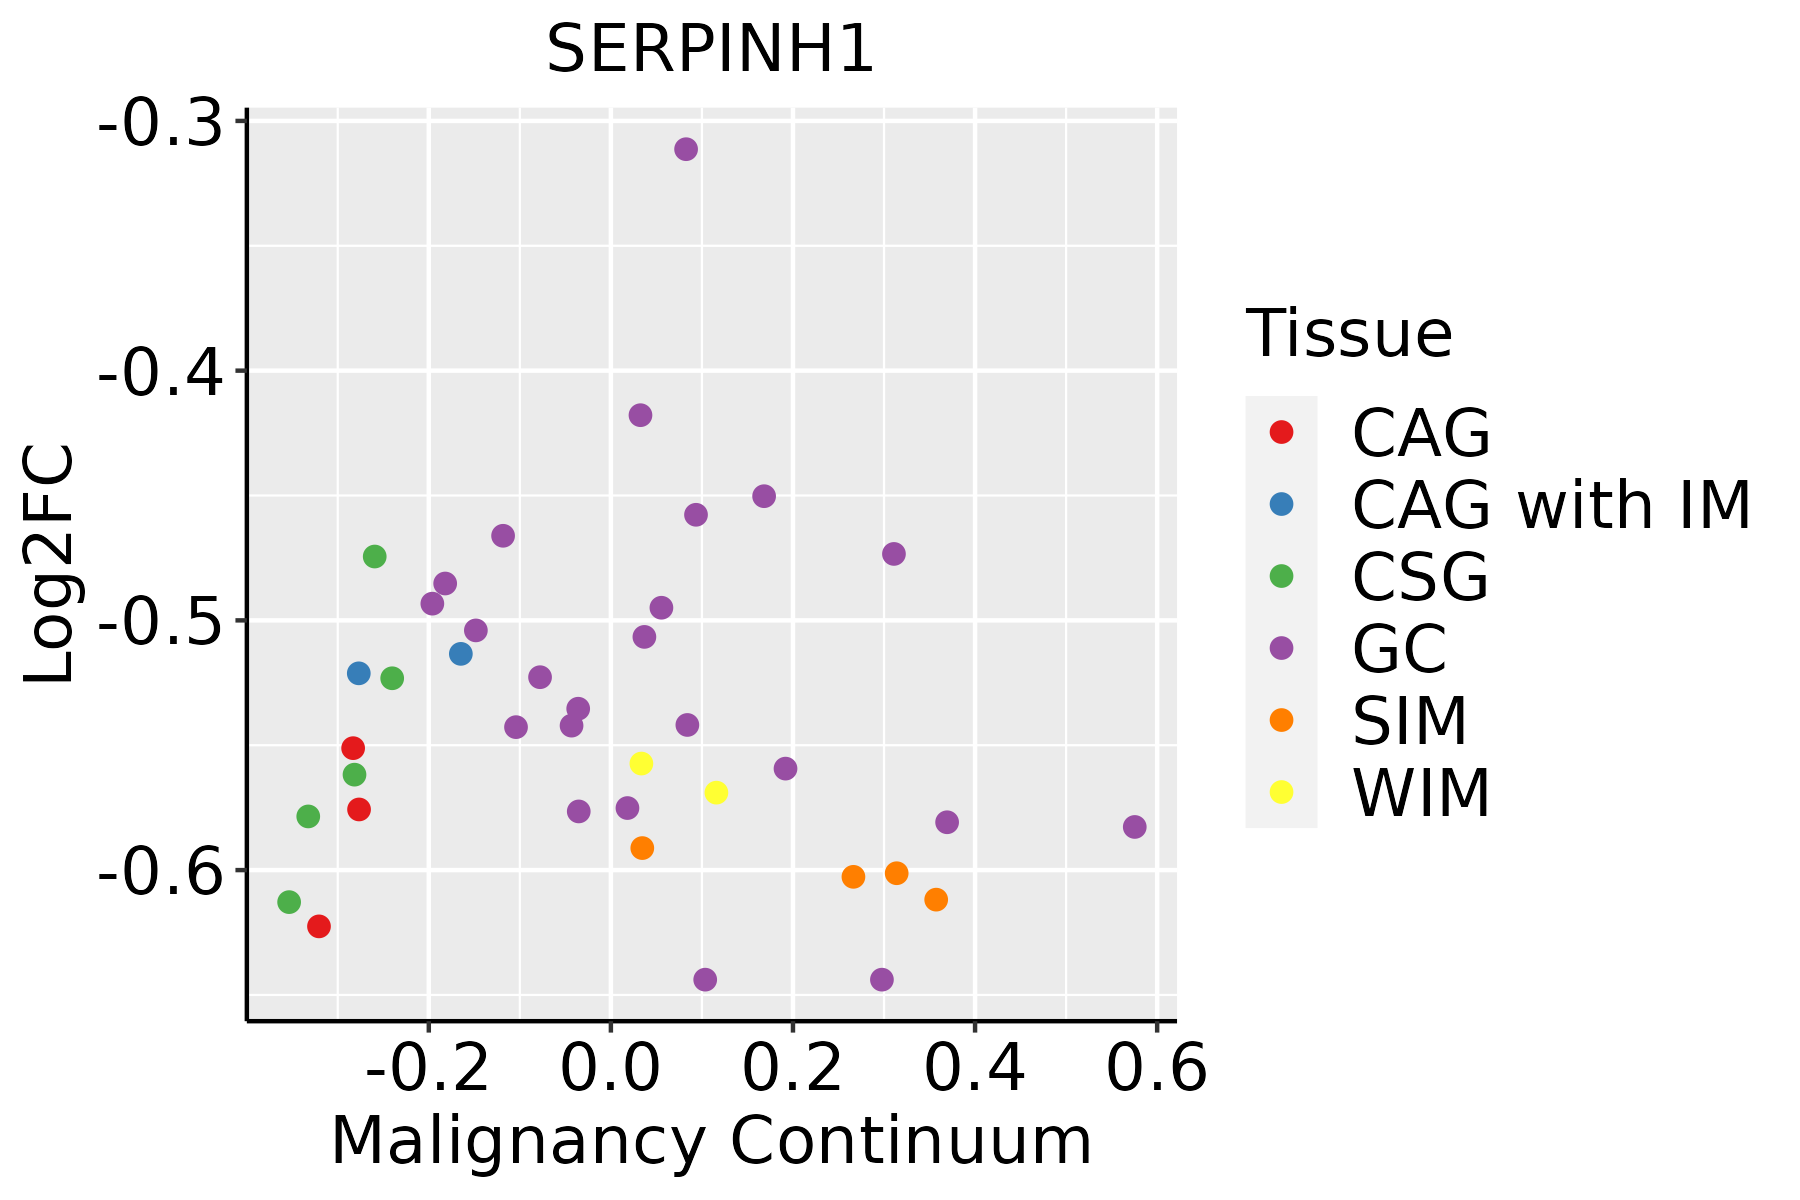 | CAG: Chronic atrophic gastritis |
| CAG with IM: Chronic atrophic gastritis with intestinal metaplasia | ||
| CSG: Chronic superficial gastritis | ||
| GC: Gastric cancer | ||
| SIM: Severe intestinal metaplasia | ||
| WIM: Wild intestinal metaplasia | ||
| Liver |  | HCC: Hepatocellular carcinoma |
| NAFLD: Non-alcoholic fatty liver disease | ||
| Oral Cavity |  | EOLP: Erosive Oral lichen planus |
| LP: leukoplakia | ||
| NEOLP: Non-erosive oral lichen planus | ||
| OSCC: Oral squamous cell carcinoma | ||
| Prostate |  | BPH: Benign Prostatic Hyperplasia |
| Skin | 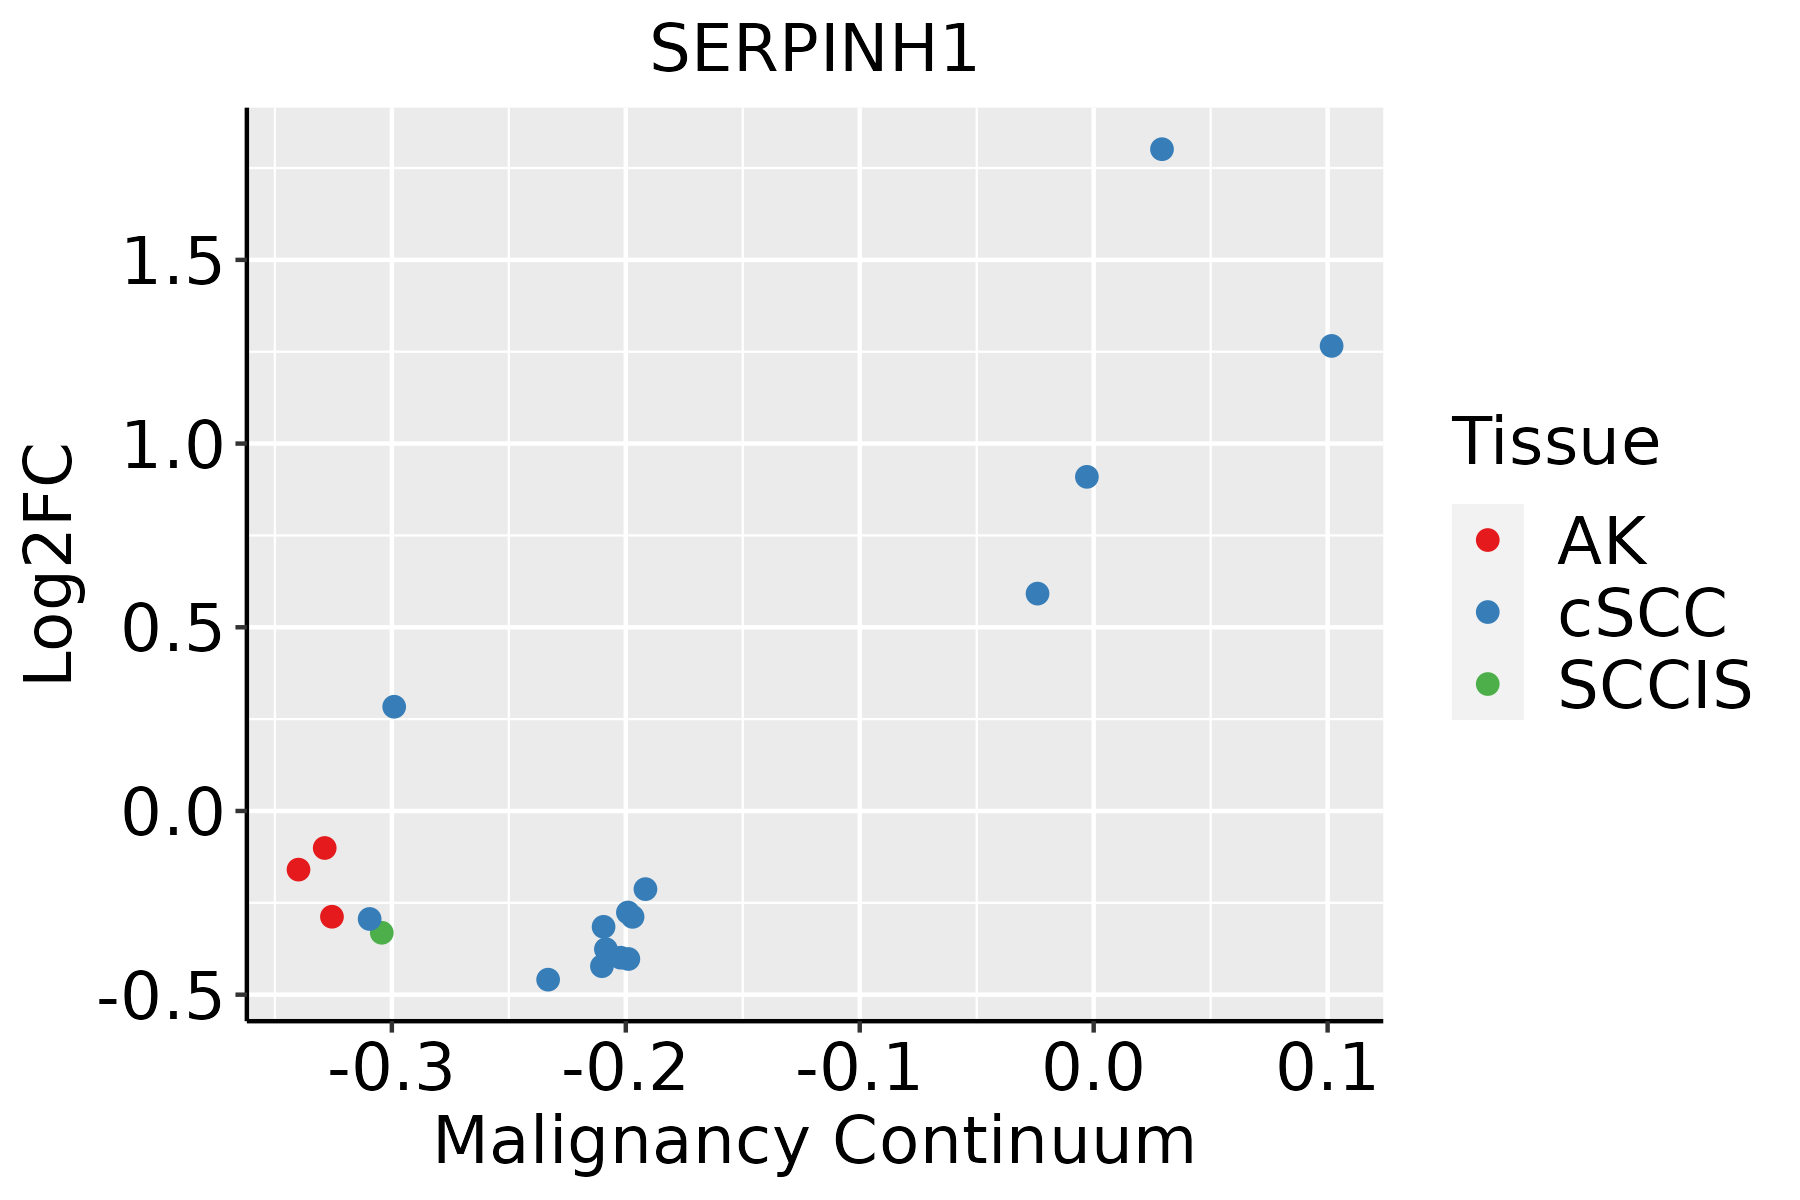 | AK: Actinic keratosis |
| cSCC: Cutaneous squamous cell carcinoma | ||
| SCCIS:squamous cell carcinoma in situ | ||
| Thyroid | 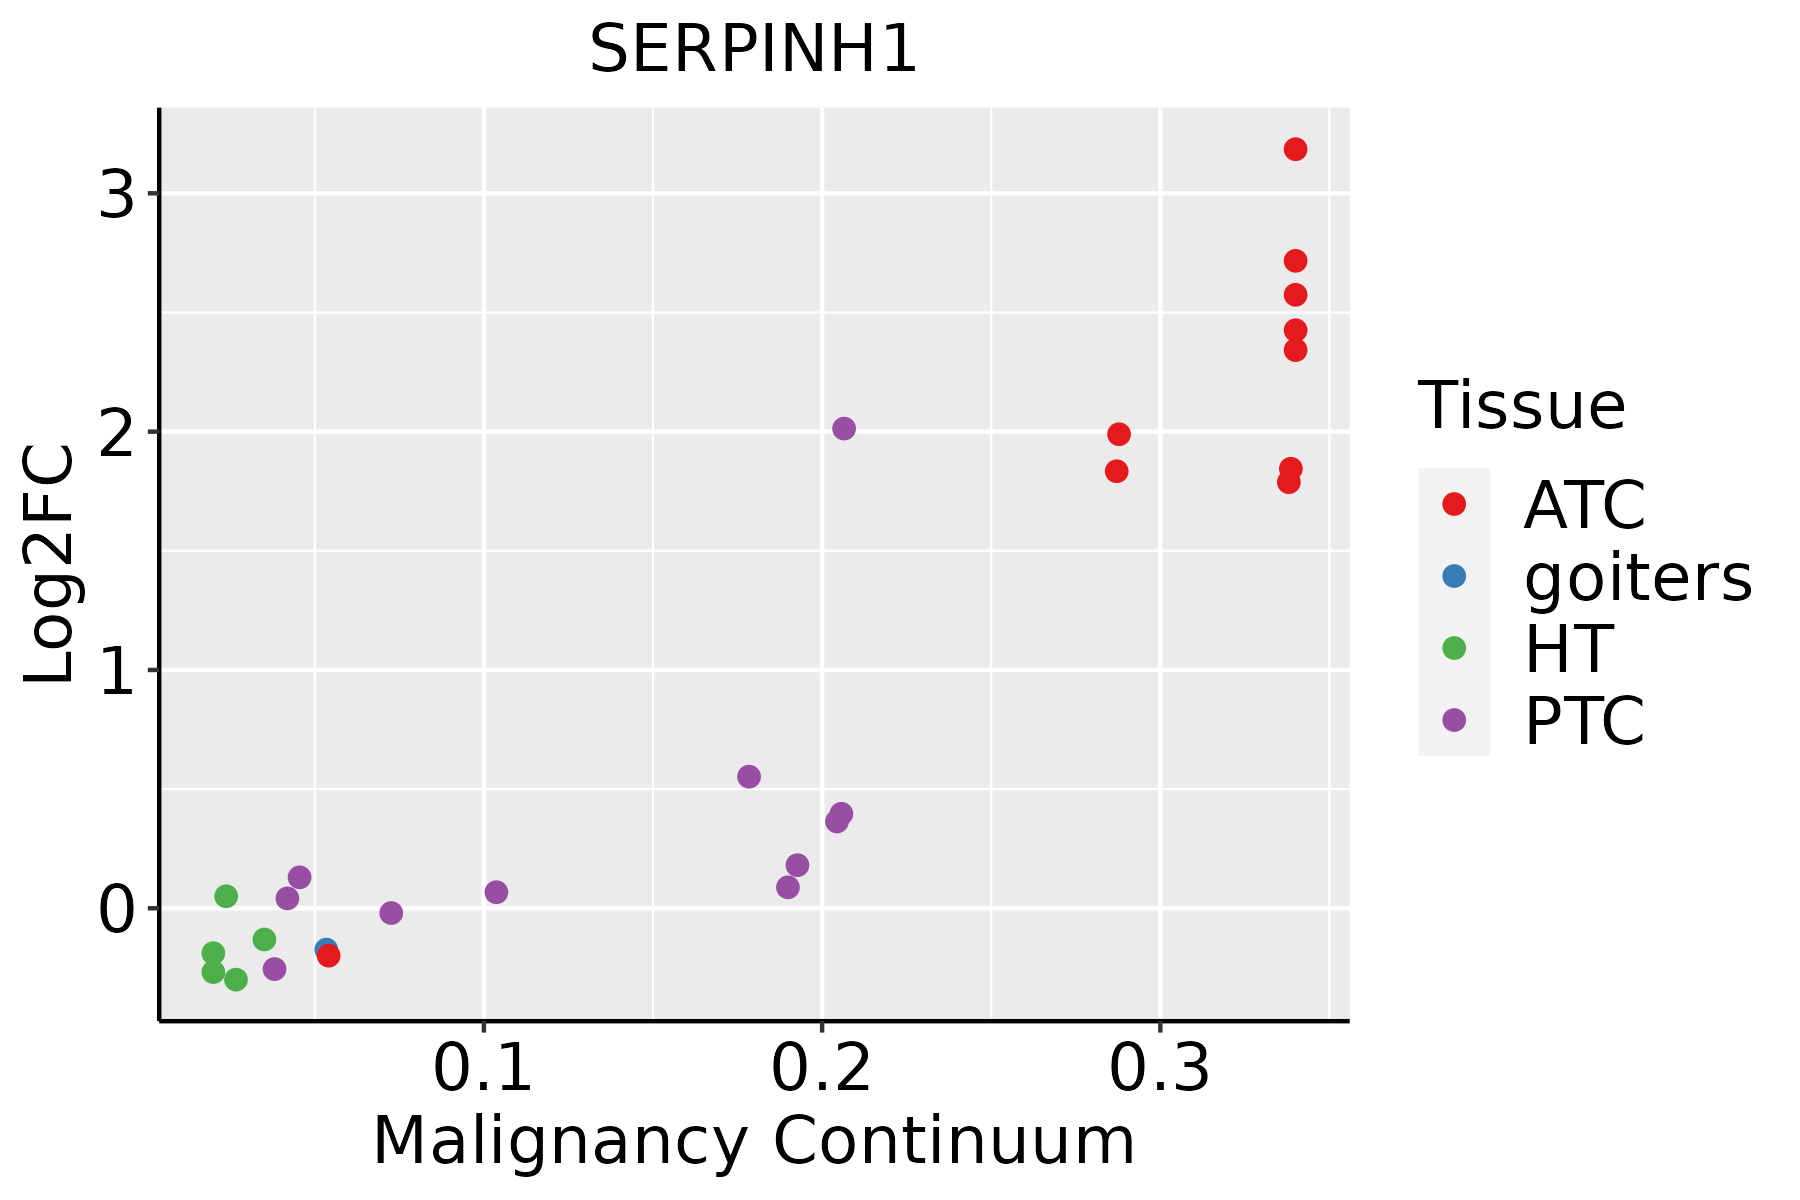 | ATC: Anaplastic thyroid cancer |
| HT: Hashimoto's thyroiditis | ||
| PTC: Papillary thyroid cancer |
| ∗log2FC in expression of this searched gene in stem-like cells from each diseased tissue sample relative to stem-like cells in normal samples in each tissue plotted against the malignancy continuum. Samples are colored based on if they are from different disease stage. |
Top |
Malignant transformation related pathway analysis |
| Find out the enriched GO biological processes and KEGG pathways involved in transition from healthy to precancer to cancer |
| Tissue | Disease Stage | Enriched GO biological Processes |
| Colorectum | AD |  |
| Colorectum | SER |  |
| Colorectum | MSS |  |
| Colorectum | MSI-H |  |
| Colorectum | FAP |  |
| ∗Top 15 enriched GO BP terms are showed in the bar plot of each disease state in each tissue. Each row represents a significant GO biological process which is colored according to the -log10(p.adjust). |
| Page: 1 2 3 4 5 6 7 8 9 |
| GO ID | Tissue | Disease Stage | Description | Gene Ratio | Bg Ratio | pvalue | p.adjust | Count |
| GO:005254710 | Cervix | CC | regulation of peptidase activity | 112/2311 | 461/18723 | 6.70e-13 | 3.08e-10 | 112 |
| GO:005254810 | Cervix | CC | regulation of endopeptidase activity | 103/2311 | 432/18723 | 1.89e-11 | 5.14e-09 | 103 |
| GO:004586110 | Cervix | CC | negative regulation of proteolysis | 80/2311 | 351/18723 | 2.88e-08 | 1.98e-06 | 80 |
| GO:00513469 | Cervix | CC | negative regulation of hydrolase activity | 81/2311 | 379/18723 | 4.27e-07 | 1.67e-05 | 81 |
| GO:00104669 | Cervix | CC | negative regulation of peptidase activity | 60/2311 | 262/18723 | 1.27e-06 | 4.34e-05 | 60 |
| GO:000698610 | Cervix | CC | response to unfolded protein | 36/2311 | 137/18723 | 6.83e-06 | 1.63e-04 | 36 |
| GO:001095110 | Cervix | CC | negative regulation of endopeptidase activity | 56/2311 | 252/18723 | 7.43e-06 | 1.74e-04 | 56 |
| GO:003596610 | Cervix | CC | response to topologically incorrect protein | 39/2311 | 159/18723 | 1.68e-05 | 3.22e-04 | 39 |
| GO:00516048 | Cervix | CC | protein maturation | 56/2311 | 294/18723 | 5.90e-04 | 5.59e-03 | 56 |
| GO:0030198 | Cervix | CC | extracellular matrix organization | 52/2311 | 301/18723 | 7.43e-03 | 3.98e-02 | 52 |
| GO:0043062 | Cervix | CC | extracellular structure organization | 52/2311 | 302/18723 | 7.92e-03 | 4.17e-02 | 52 |
| GO:0045229 | Cervix | CC | external encapsulating structure organization | 52/2311 | 304/18723 | 9.00e-03 | 4.57e-02 | 52 |
| GO:0052547 | Colorectum | AD | regulation of peptidase activity | 137/3918 | 461/18723 | 4.12e-06 | 1.12e-04 | 137 |
| GO:0045861 | Colorectum | AD | negative regulation of proteolysis | 106/3918 | 351/18723 | 2.33e-05 | 4.57e-04 | 106 |
| GO:0052548 | Colorectum | AD | regulation of endopeptidase activity | 124/3918 | 432/18723 | 6.58e-05 | 1.07e-03 | 124 |
| GO:0035966 | Colorectum | AD | response to topologically incorrect protein | 54/3918 | 159/18723 | 8.85e-05 | 1.36e-03 | 54 |
| GO:0051604 | Colorectum | AD | protein maturation | 85/3918 | 294/18723 | 6.73e-04 | 6.91e-03 | 85 |
| GO:0006986 | Colorectum | AD | response to unfolded protein | 45/3918 | 137/18723 | 7.43e-04 | 7.48e-03 | 45 |
| GO:00525471 | Colorectum | SER | regulation of peptidase activity | 114/2897 | 461/18723 | 1.18e-07 | 7.17e-06 | 114 |
| GO:00458611 | Colorectum | SER | negative regulation of proteolysis | 88/2897 | 351/18723 | 1.74e-06 | 7.50e-05 | 88 |
| Page: 1 2 3 4 5 6 7 8 9 10 11 12 13 14 |
| Pathway ID | Tissue | Disease Stage | Description | Gene Ratio | Bg Ratio | pvalue | p.adjust | qvalue | Count |
| Page: 1 |
Top |
Cell-cell communication analysis |
| Identification of potential cell-cell interactions between two cell types and their ligand-receptor pairs for different disease states |
| Ligand | Receptor | LRpair | Pathway | Tissue | Disease Stage |
| Page: 1 |
Top |
Single-cell gene regulatory network inference analysis |
| Find out the significant the regulons (TFs) and the target genes of each regulon across cell types for different disease states |
| TF | Cell Type | Tissue | Disease Stage | Target Gene | RSS | Regulon Activity |
| ∗The dot plots of a searched regulon are shown for all cell subpopulations in each disease state of each tissue based on the regulon specific score inferred using pySCENIC and by calculating the average expression. |
| Page: 1 |
Top |
Somatic mutation of malignant transformation related genes |
| Annotation of somatic variants for genes involved in malignant transformation |
| Hugo Symbol | Variant Class | Variant Classification | dbSNP RS | HGVSc | HGVSp | HGVSp Short | SWISSPROT | BIOTYPE | SIFT | PolyPhen | Tumor Sample Barcode | Tissue | Histology | Sex | Age | Stage | Therapy Types | Drugs | Outcome |
| SERPINH1 | SNV | Missense_Mutation | rs755143041 | c.533C>T | p.Ala178Val | p.A178V | P50454 | protein_coding | tolerated(0.06) | possibly_damaging(0.771) | TCGA-EA-A3HS-01 | Cervix | cervical & endocervical cancer | Female | <65 | I/II | Unknown | Unknown | SD |
| SERPINH1 | SNV | Missense_Mutation | c.1057N>A | p.His353Asn | p.H353N | P50454 | protein_coding | deleterious(0) | probably_damaging(0.99) | TCGA-CM-4743-01 | Colorectum | colon adenocarcinoma | Male | >=65 | I/II | Chemotherapy | capecitabine | SD | |
| SERPINH1 | SNV | Missense_Mutation | rs750157727 | c.716N>A | p.Arg239Gln | p.R239Q | P50454 | protein_coding | tolerated(0.44) | benign(0.243) | TCGA-F4-6703-01 | Colorectum | colon adenocarcinoma | Male | <65 | I/II | Unknown | Unknown | SD |
| SERPINH1 | SNV | Missense_Mutation | c.745N>A | p.Glu249Lys | p.E249K | P50454 | protein_coding | tolerated(0.77) | benign(0.022) | TCGA-G4-6317-01 | Colorectum | colon adenocarcinoma | Female | <65 | III/IV | Chemotherapy | fluorouracil | PD | |
| SERPINH1 | SNV | Missense_Mutation | c.443N>A | p.Arg148His | p.R148H | P50454 | protein_coding | deleterious(0.01) | possibly_damaging(0.537) | TCGA-NH-A5IV-01 | Colorectum | colon adenocarcinoma | Female | >=65 | I/II | Unknown | Unknown | SD | |
| SERPINH1 | SNV | Missense_Mutation | rs766813083 | c.523G>A | p.Glu175Lys | p.E175K | P50454 | protein_coding | tolerated(0.12) | possibly_damaging(0.794) | TCGA-F5-6814-01 | Colorectum | rectum adenocarcinoma | Male | <65 | I/II | Unknown | Unknown | SD |
| SERPINH1 | SNV | Missense_Mutation | novel | c.722G>A | p.Gly241Asp | p.G241D | P50454 | protein_coding | tolerated(0.07) | probably_damaging(0.999) | TCGA-A5-A0G1-01 | Endometrium | uterine corpus endometrioid carcinoma | Female | >=65 | I/II | Unknown | Unknown | SD |
| SERPINH1 | SNV | Missense_Mutation | novel | c.610N>G | p.Met204Val | p.M204V | P50454 | protein_coding | deleterious(0.03) | benign(0.157) | TCGA-A5-A0G2-01 | Endometrium | uterine corpus endometrioid carcinoma | Female | <65 | III/IV | Unknown | Unknown | SD |
| SERPINH1 | SNV | Missense_Mutation | novel | c.841N>A | p.Leu281Ile | p.L281I | P50454 | protein_coding | tolerated(0.16) | possibly_damaging(0.651) | TCGA-A5-A1OF-01 | Endometrium | uterine corpus endometrioid carcinoma | Female | <65 | I/II | Unknown | Unknown | SD |
| SERPINH1 | SNV | Missense_Mutation | c.376N>A | p.Val126Met | p.V126M | P50454 | protein_coding | tolerated(0.14) | possibly_damaging(0.862) | TCGA-AP-A056-01 | Endometrium | uterine corpus endometrioid carcinoma | Female | <65 | I/II | Unknown | Unknown | SD |
| Page: 1 2 3 4 |
Top |
Related drugs of malignant transformation related genes |
| Identification of chemicals and drugs interact with genes involved in malignant transfromation |
| (DGIdb 4.0) |
| Entrez ID | Symbol | Category | Interaction Types | Drug Claim Name | Drug Name | PMIDs |
| 871 | SERPINH1 | PROTEASE INHIBITOR, DRUGGABLE GENOME | ANTISENSE OLIGONUCLEOTIDES | 9714184 | ||
| 871 | SERPINH1 | PROTEASE INHIBITOR, DRUGGABLE GENOME | 11D10 | 8567753 |
| Page: 1 |

Copyright 2023-Present -The University of Texas Health Science Center at Houston |