
|
|||||
|
 | |
| |
| |
| |
| |
| |
|
Gene: SERPING1 |
Gene summary for SERPING1 |
| Gene information | Species | Human | Gene symbol | SERPING1 | Gene ID | 710 |
| Gene name | serpin family G member 1 | |
| Gene Alias | C1IN | |
| Cytomap | 11q12.1 | |
| Gene Type | protein-coding | GO ID | GO:0001867 | UniProtAcc | E9KL26 |
Top |
Malignant transformation analysis |
| Identification of the aberrant gene expression in precancerous and cancerous lesions by comparing the gene expression of stem-like cells in diseased tissues with normal stem cells |
| Entrez ID | Symbol | Replicates | Species | Organ | Tissue | Adj P-value | Log2FC | Malignancy |
| 710 | SERPING1 | CA_HPV_1 | Human | Cervix | CC | 4.65e-02 | 1.64e-01 | 0.0264 |
| 710 | SERPING1 | Tumor | Human | Cervix | CC | 6.20e-07 | 3.04e-01 | 0.1241 |
| 710 | SERPING1 | sample1 | Human | Cervix | CC | 2.40e-12 | 6.90e-01 | 0.0959 |
| 710 | SERPING1 | sample3 | Human | Cervix | CC | 4.27e-17 | 3.44e-01 | 0.1387 |
| 710 | SERPING1 | L1 | Human | Cervix | CC | 1.13e-02 | -2.56e-01 | 0.0802 |
| 710 | SERPING1 | T1 | Human | Cervix | CC | 1.21e-26 | 7.54e-01 | 0.0918 |
| 710 | SERPING1 | T3 | Human | Cervix | CC | 1.18e-10 | 2.98e-01 | 0.1389 |
| 710 | SERPING1 | AEH-subject2 | Human | Endometrium | AEH | 4.17e-02 | -2.55e-01 | -0.2525 |
| 710 | SERPING1 | AEH-subject3 | Human | Endometrium | AEH | 8.69e-11 | -2.98e-01 | -0.2576 |
| 710 | SERPING1 | AEH-subject4 | Human | Endometrium | AEH | 2.39e-06 | -3.41e-01 | -0.2657 |
| 710 | SERPING1 | AEH-subject5 | Human | Endometrium | AEH | 2.71e-15 | -4.49e-01 | -0.2953 |
| 710 | SERPING1 | EEC-subject1 | Human | Endometrium | EEC | 2.92e-16 | -4.13e-01 | -0.2682 |
| 710 | SERPING1 | EEC-subject2 | Human | Endometrium | EEC | 2.03e-23 | -4.73e-01 | -0.2607 |
| 710 | SERPING1 | EEC-subject3 | Human | Endometrium | EEC | 1.92e-35 | -2.97e-01 | -0.2525 |
| 710 | SERPING1 | EEC-subject4 | Human | Endometrium | EEC | 1.88e-09 | -3.37e-01 | -0.2571 |
| 710 | SERPING1 | EEC-subject5 | Human | Endometrium | EEC | 7.96e-13 | -3.70e-01 | -0.249 |
| 710 | SERPING1 | GSM5276935 | Human | Endometrium | EEC | 4.43e-18 | -4.69e-01 | -0.123 |
| 710 | SERPING1 | GSM5276937 | Human | Endometrium | EEC | 4.10e-03 | -3.15e-01 | -0.0897 |
| 710 | SERPING1 | GSM6177620_NYU_UCEC1_lib1_lib1 | Human | Endometrium | EEC | 3.31e-18 | 5.54e-03 | -0.1869 |
| 710 | SERPING1 | GSM6177620_NYU_UCEC1_lib2_lib2 | Human | Endometrium | EEC | 3.09e-20 | -1.38e-02 | -0.1875 |
| Page: 1 2 3 4 5 6 7 |
| Tissue | Expression Dynamics | Abbreviation |
| Cervix | 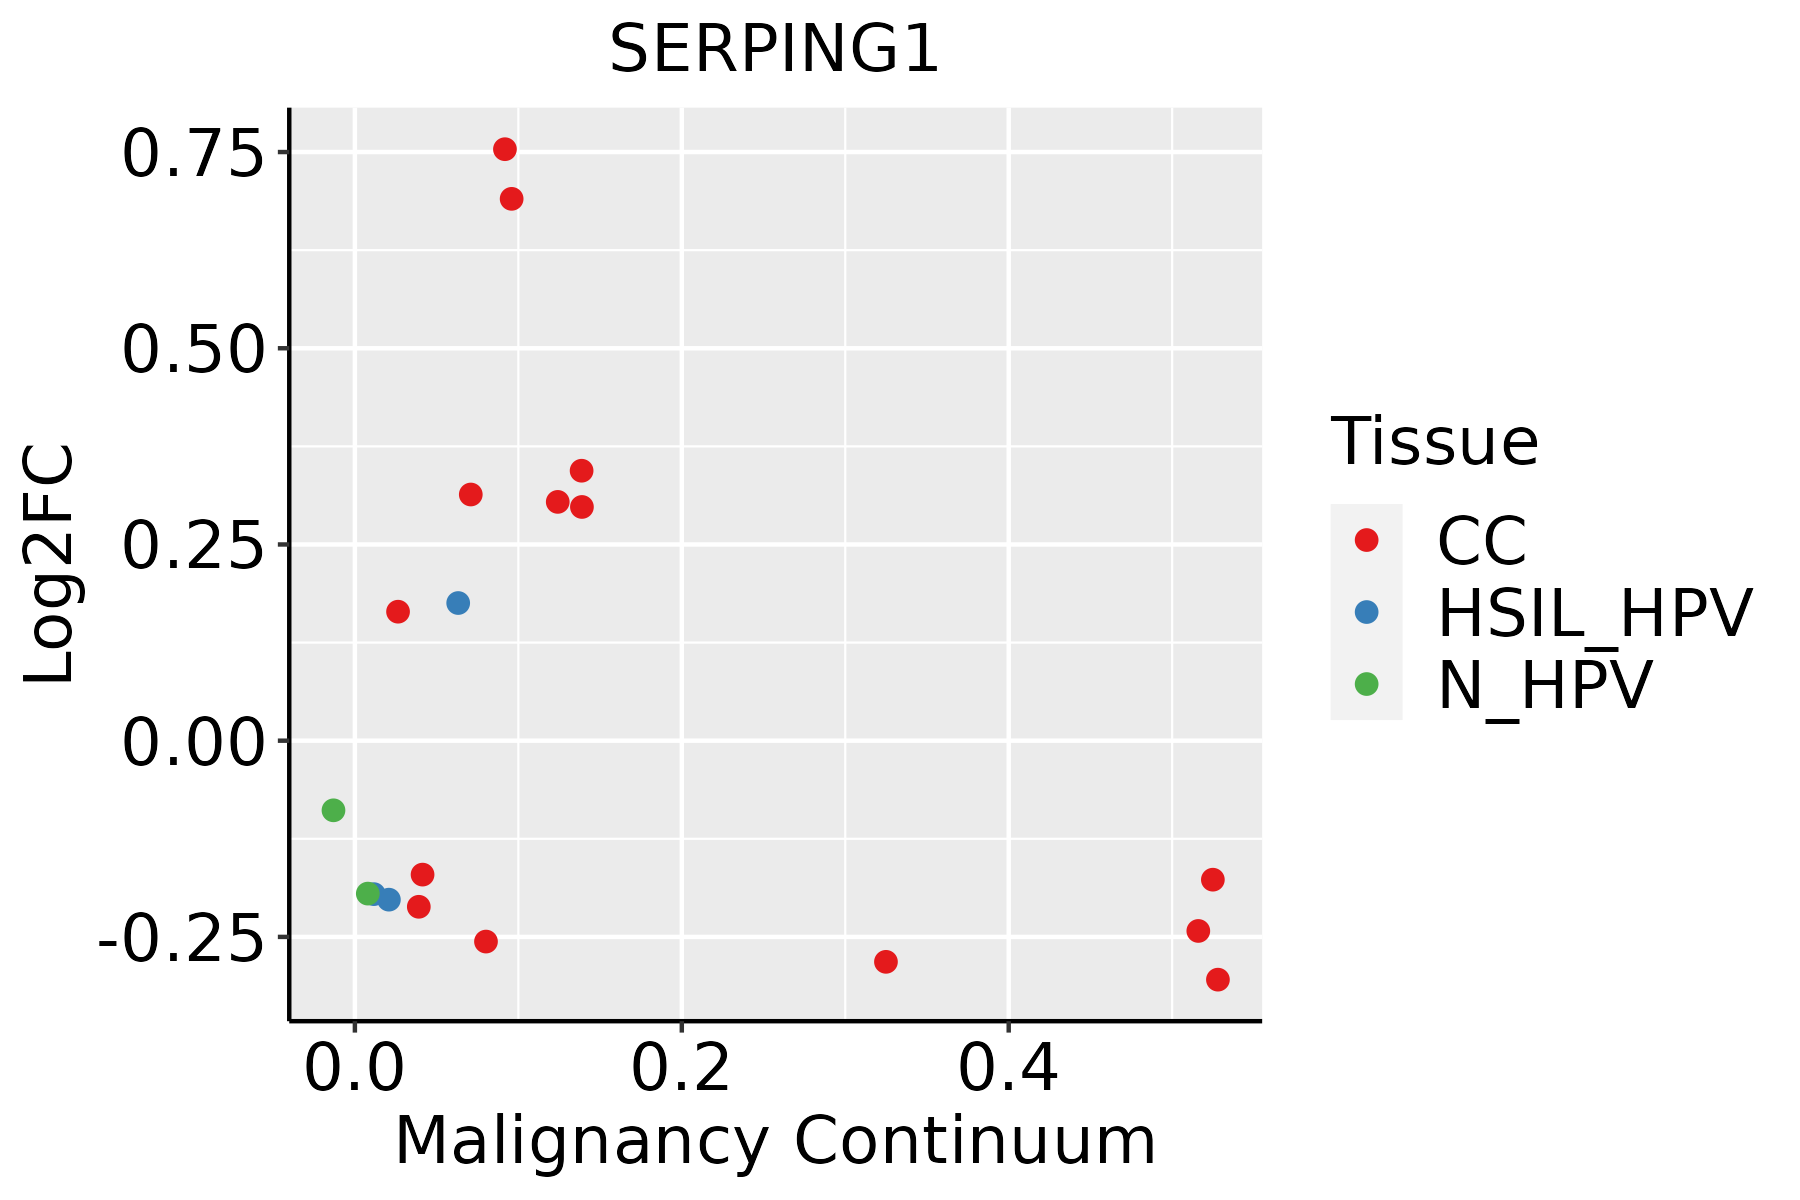 | CC: Cervix cancer |
| HSIL_HPV: HPV-infected high-grade squamous intraepithelial lesions | ||
| N_HPV: HPV-infected normal cervix | ||
| Endometrium | 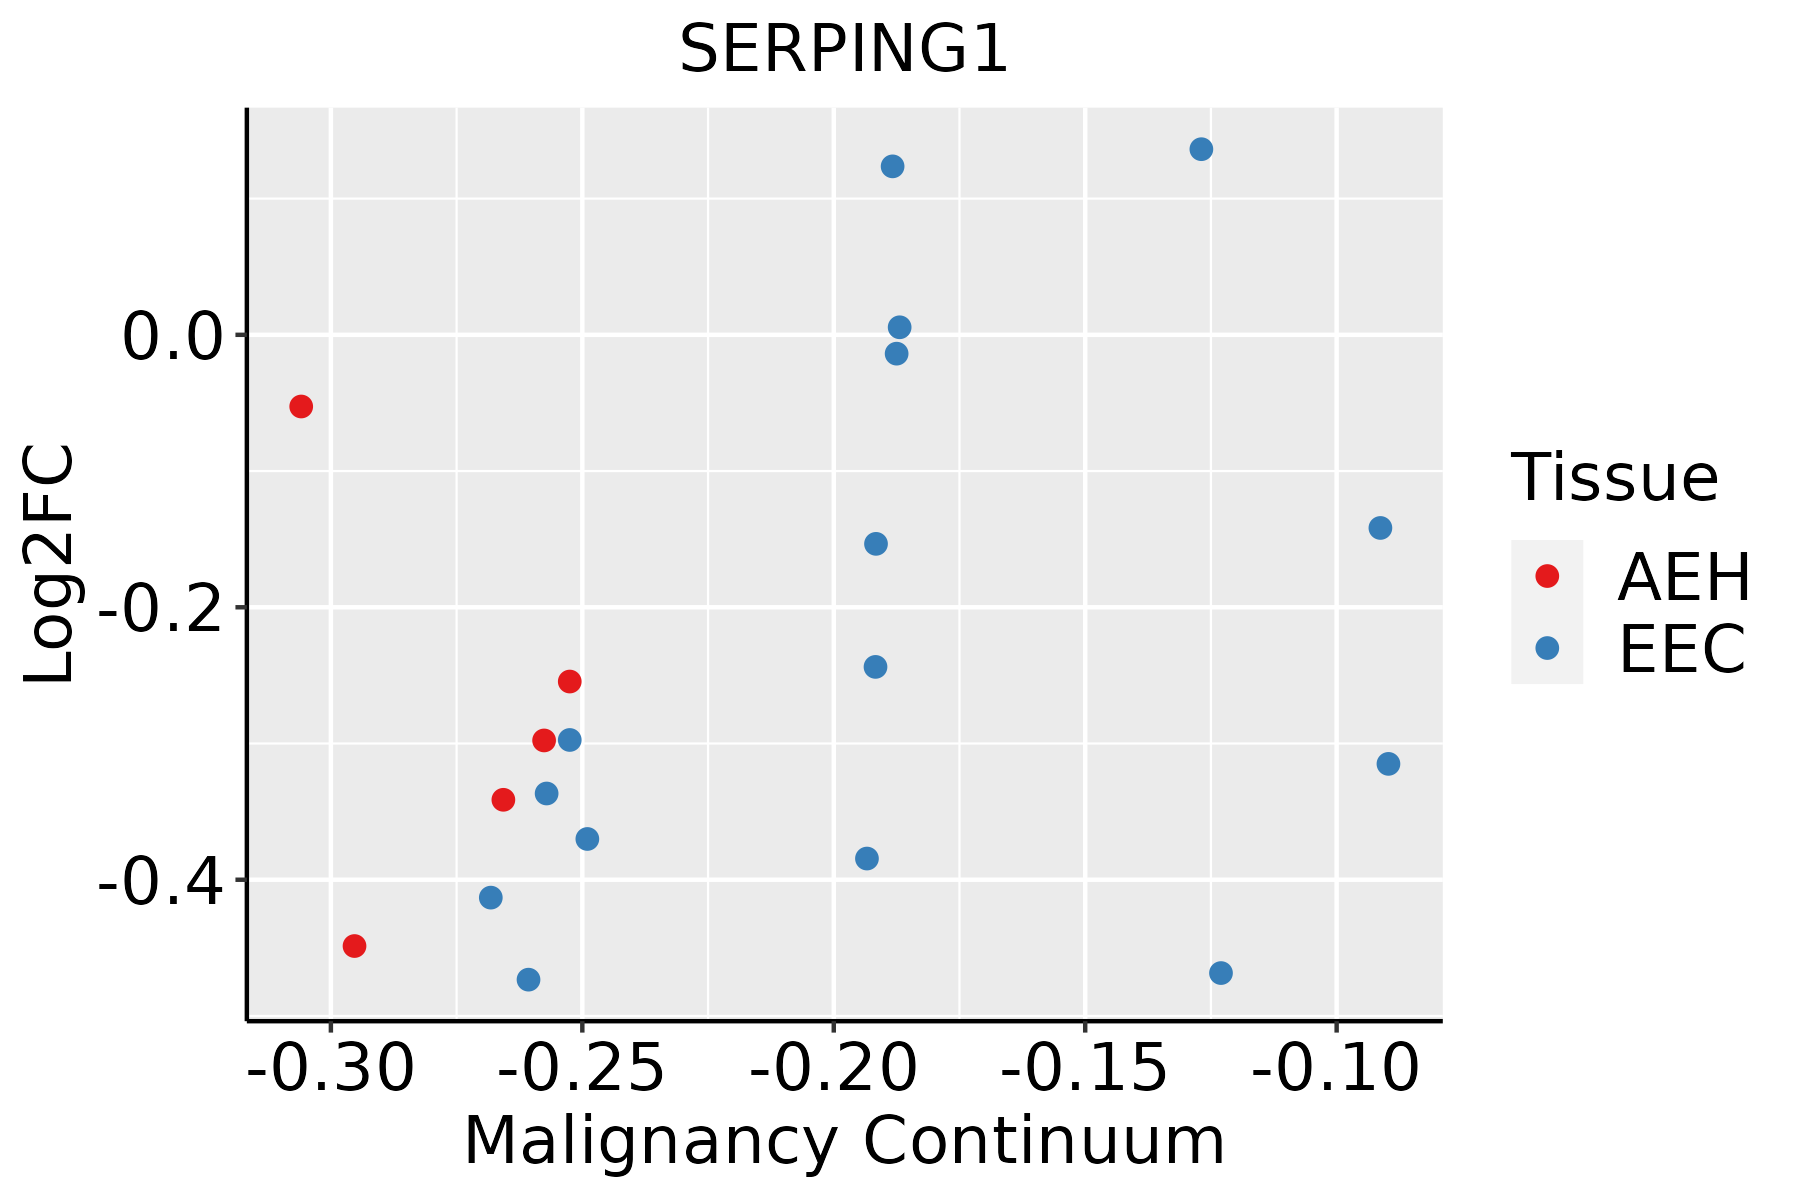 | AEH: Atypical endometrial hyperplasia |
| EEC: Endometrioid Cancer | ||
| Esophagus | 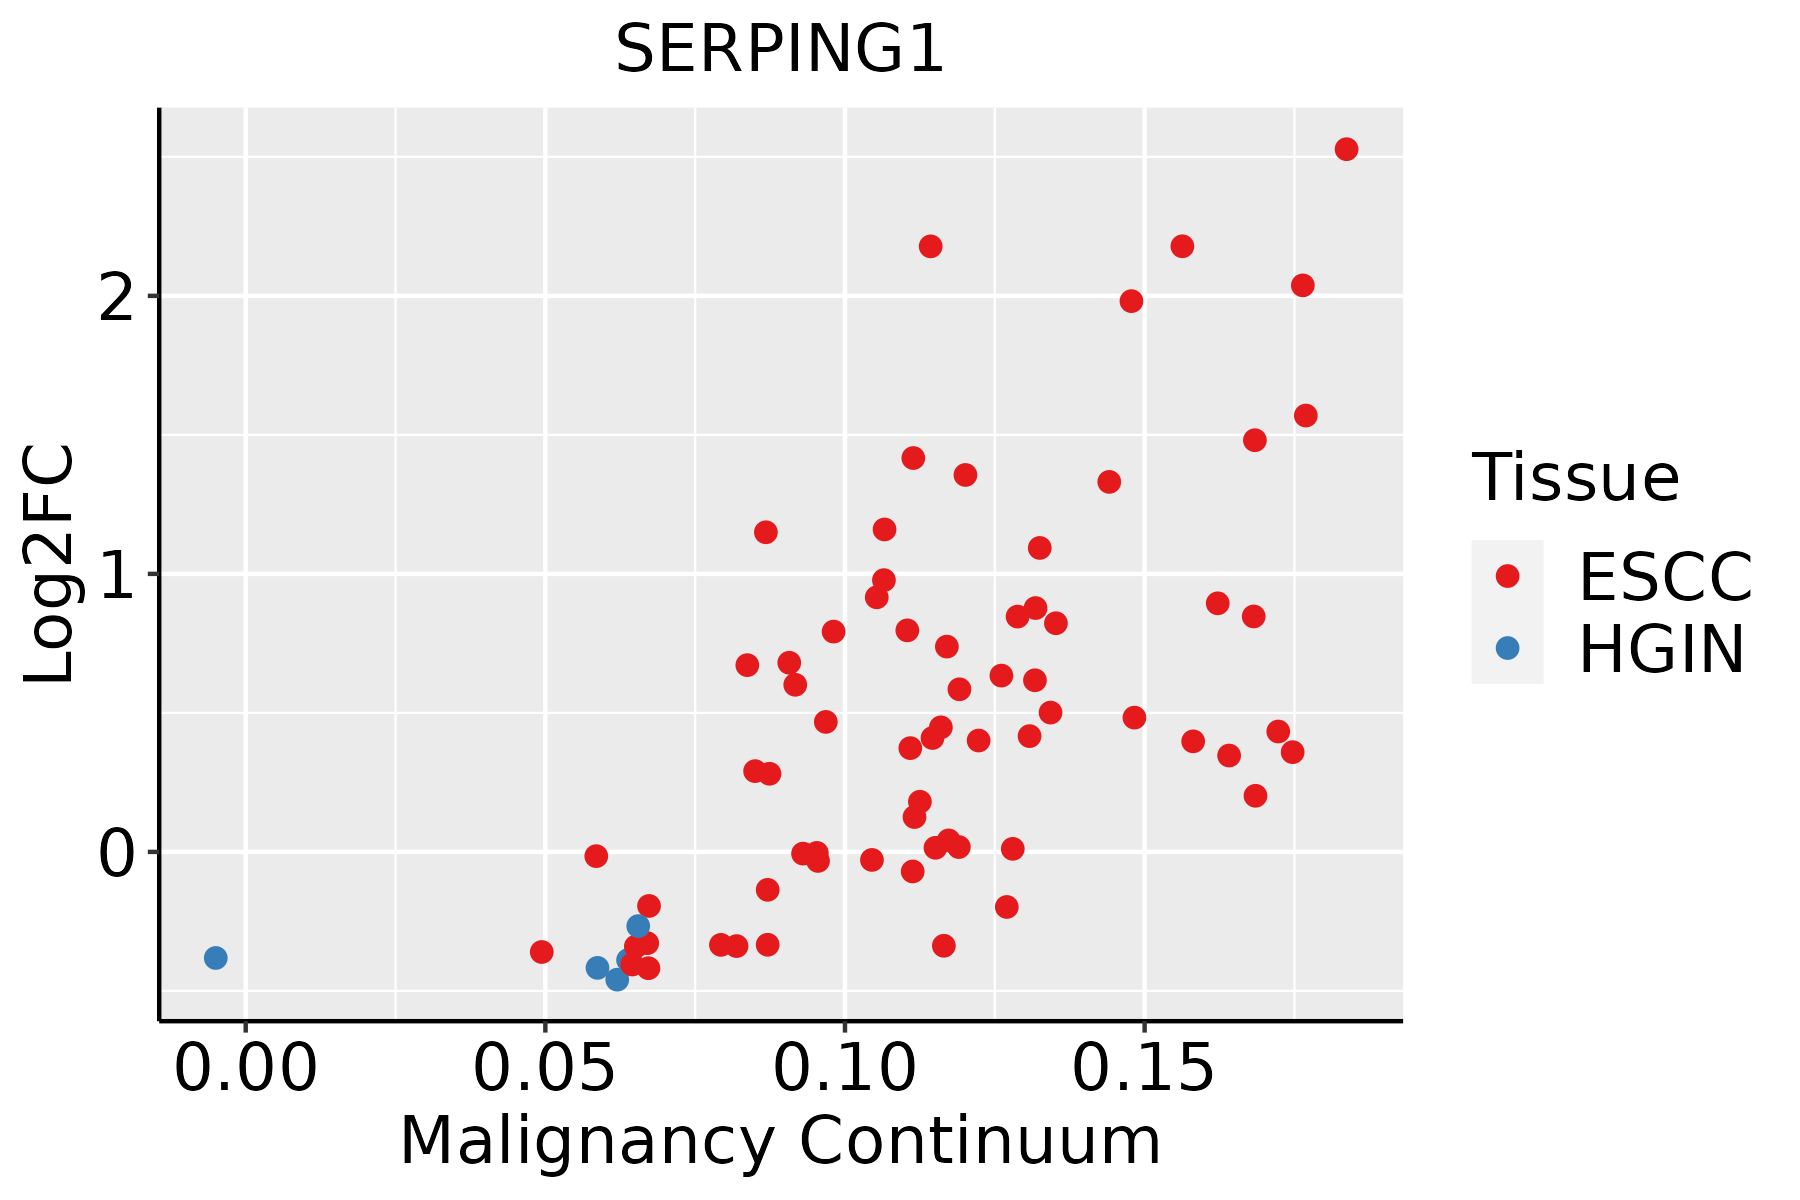 | ESCC: Esophageal squamous cell carcinoma |
| HGIN: High-grade intraepithelial neoplasias | ||
| LGIN: Low-grade intraepithelial neoplasias | ||
| Liver | 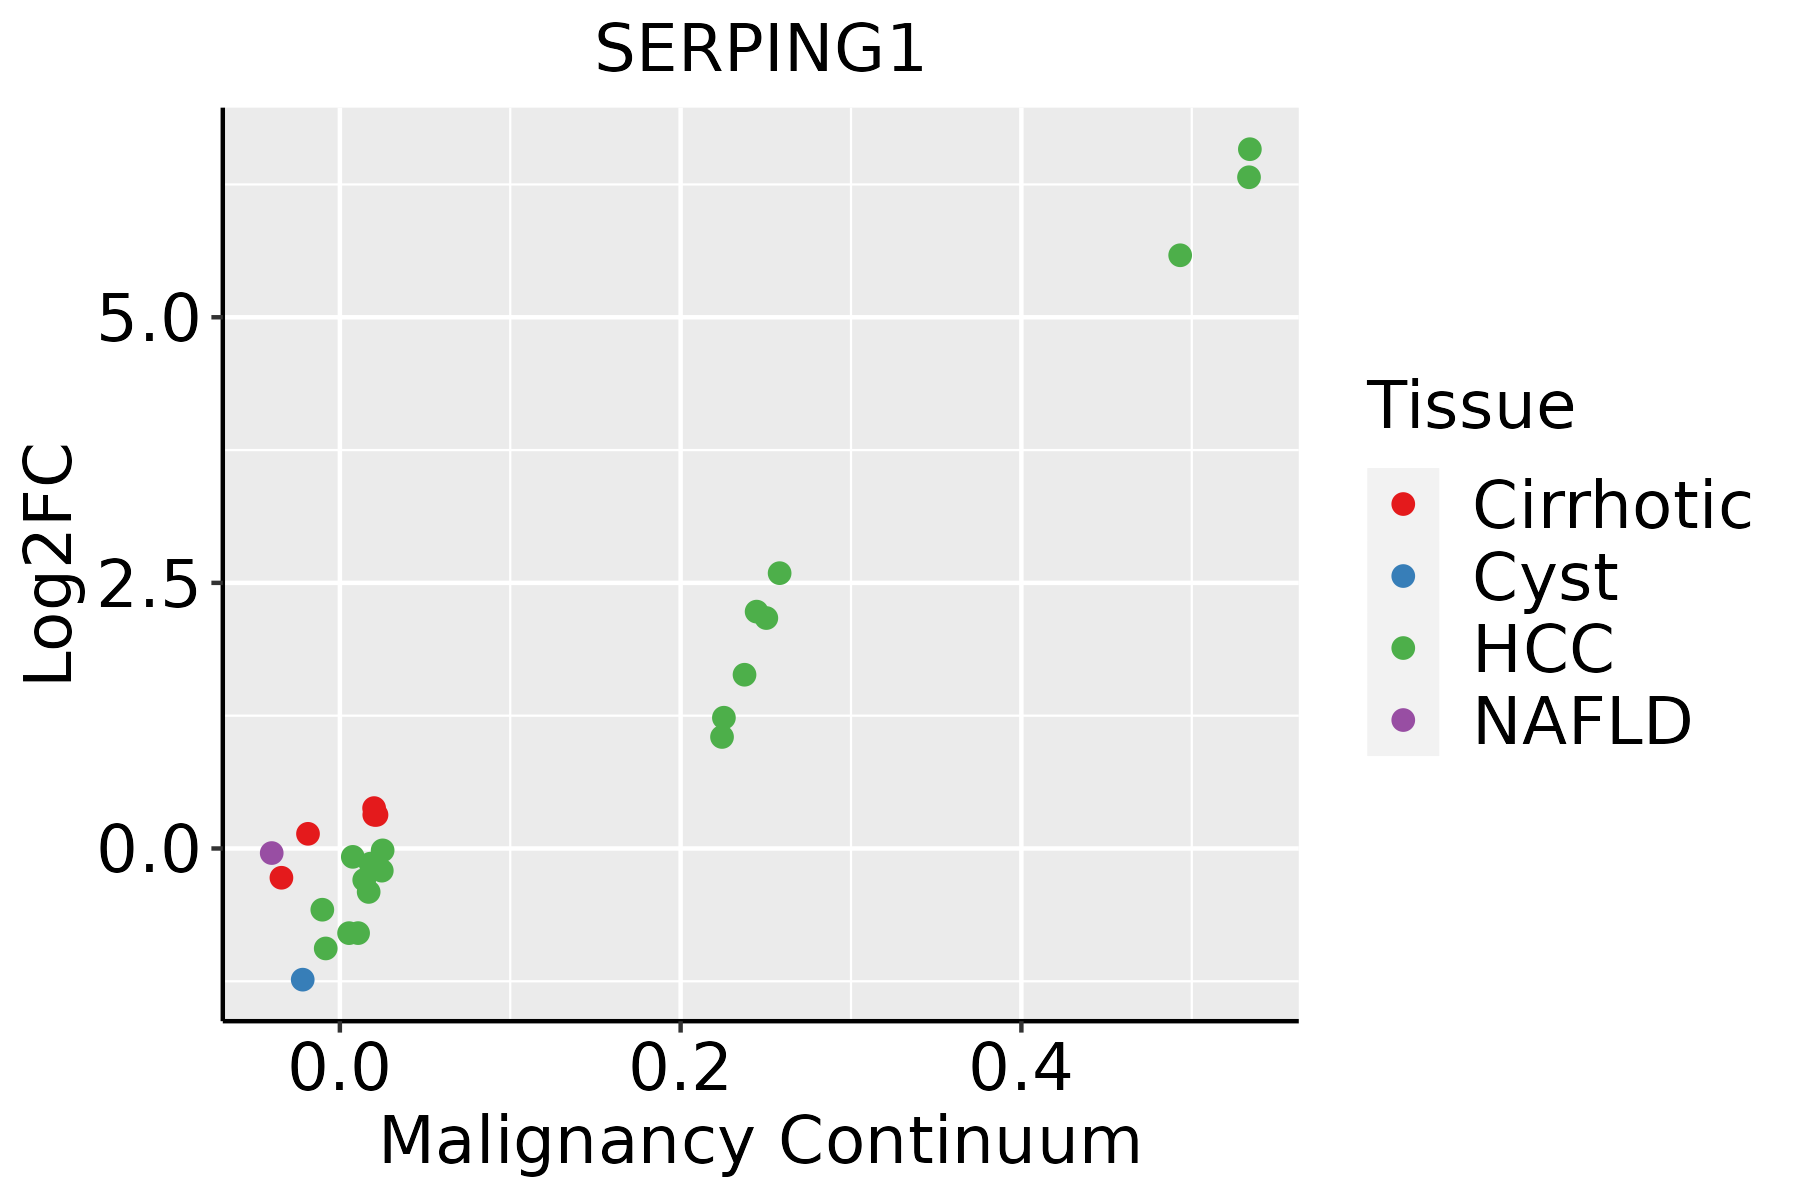 | HCC: Hepatocellular carcinoma |
| NAFLD: Non-alcoholic fatty liver disease | ||
| Oral Cavity | 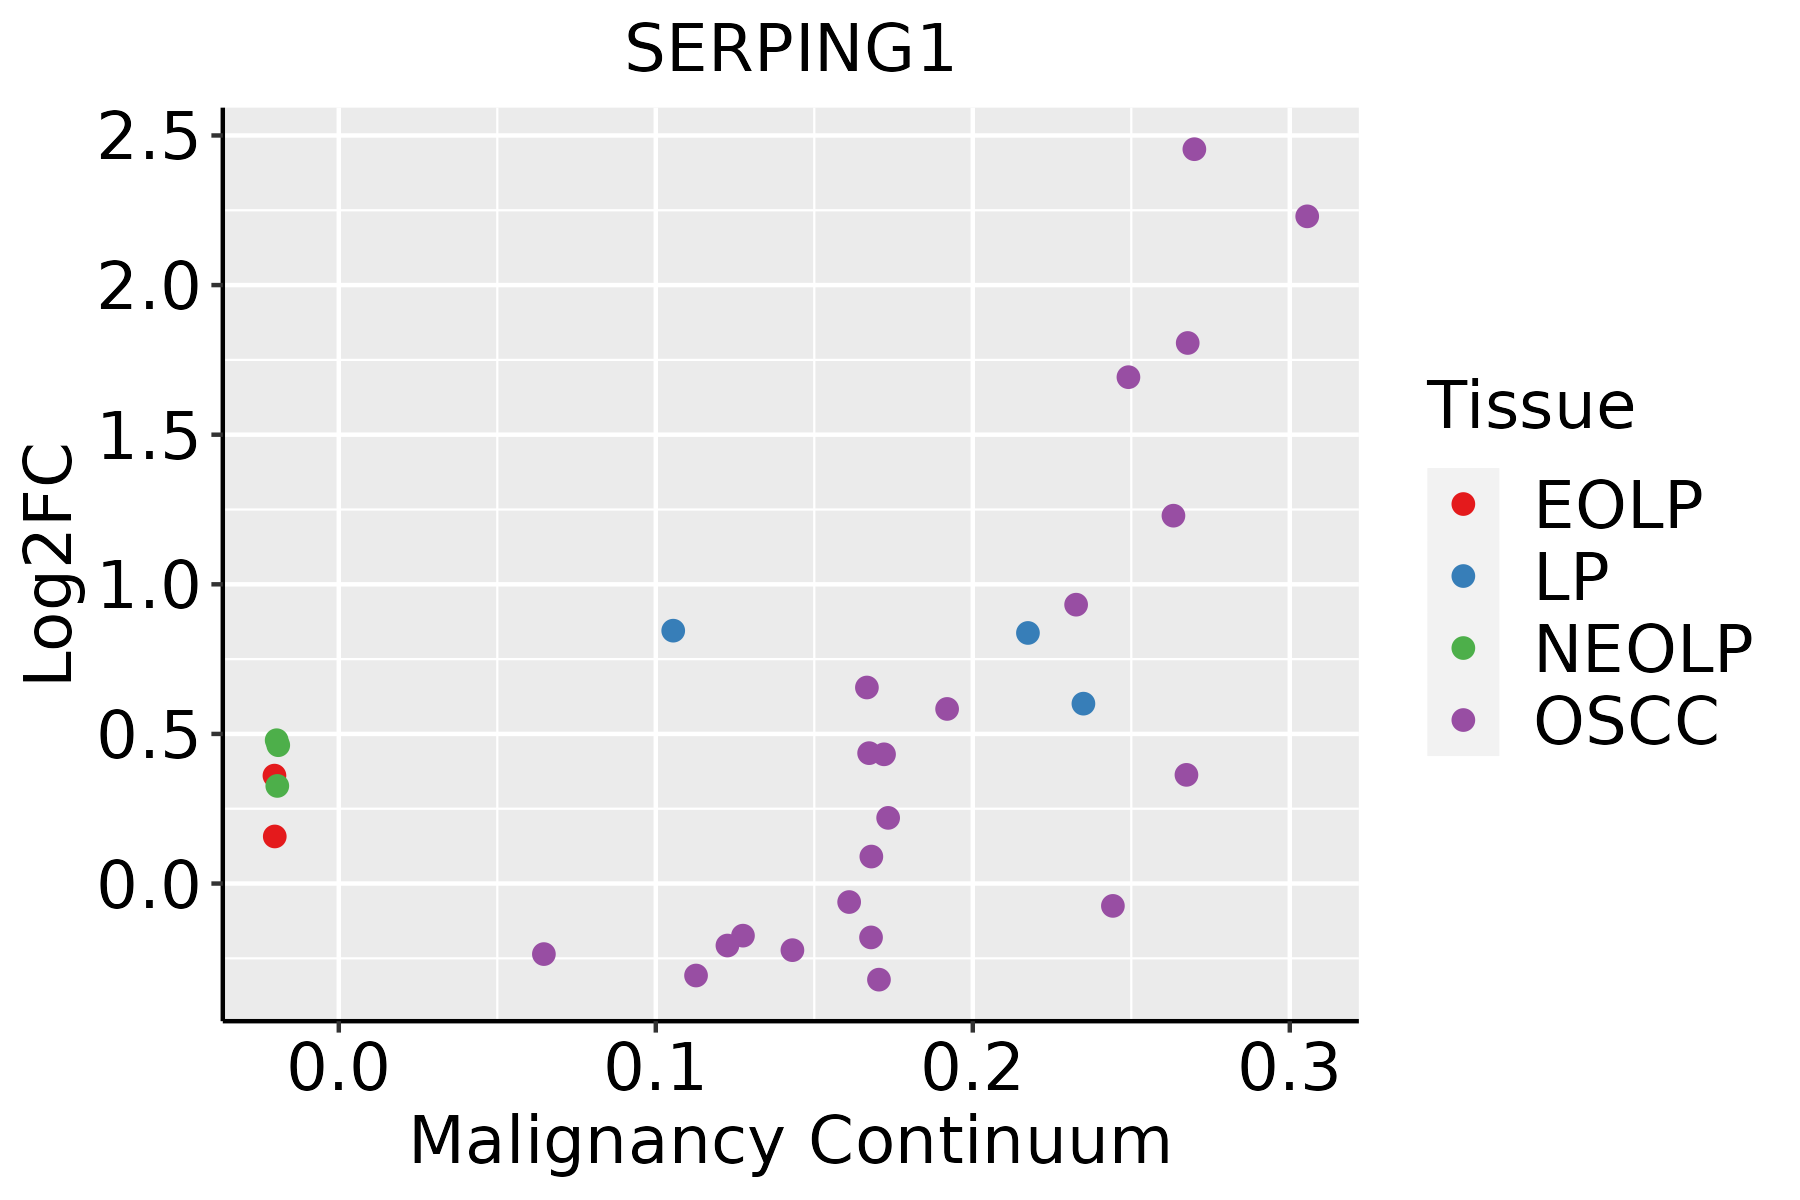 | EOLP: Erosive Oral lichen planus |
| LP: leukoplakia | ||
| NEOLP: Non-erosive oral lichen planus | ||
| OSCC: Oral squamous cell carcinoma | ||
| Skin | 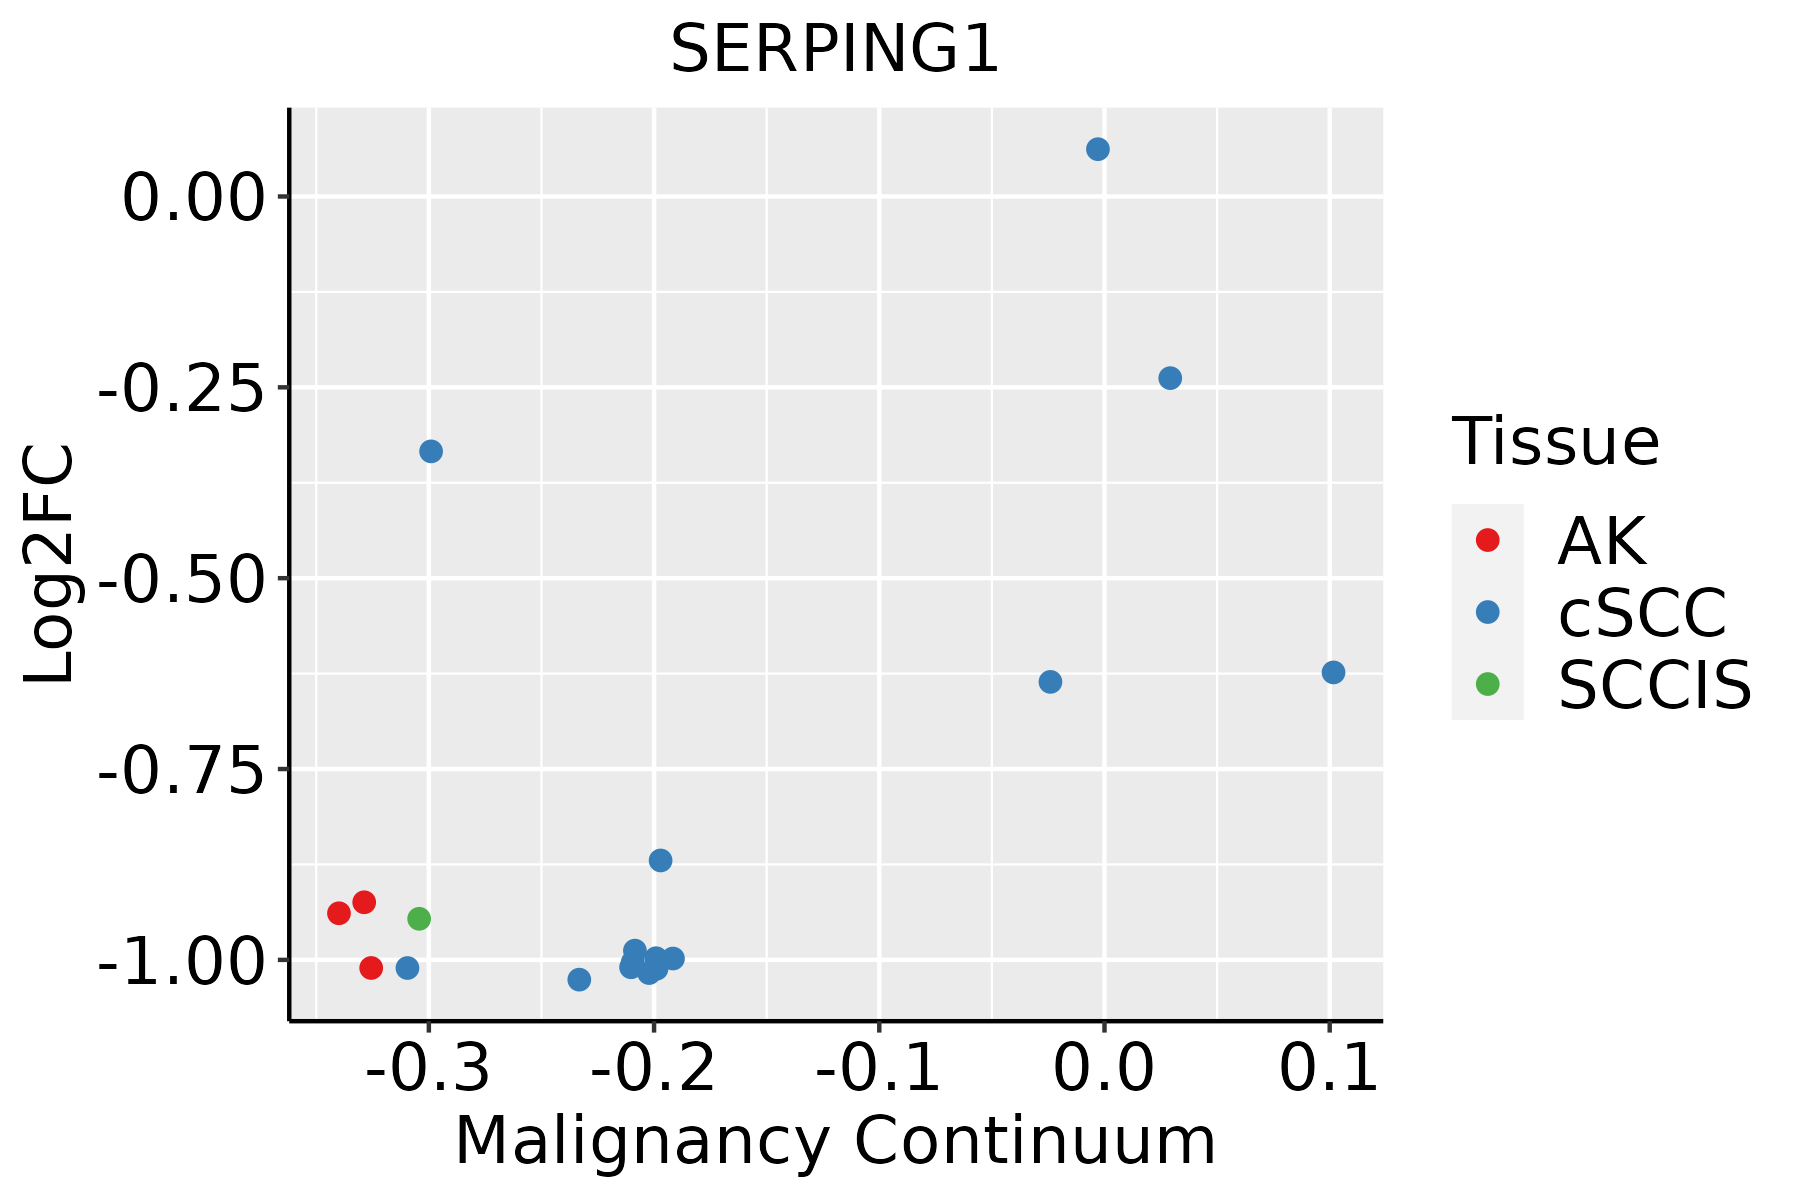 | AK: Actinic keratosis |
| cSCC: Cutaneous squamous cell carcinoma | ||
| SCCIS:squamous cell carcinoma in situ | ||
| Thyroid |  | ATC: Anaplastic thyroid cancer |
| HT: Hashimoto's thyroiditis | ||
| PTC: Papillary thyroid cancer |
| ∗log2FC in expression of this searched gene in stem-like cells from each diseased tissue sample relative to stem-like cells in normal samples in each tissue plotted against the malignancy continuum. Samples are colored based on if they are from different disease stage. |
Top |
Malignant transformation related pathway analysis |
| Find out the enriched GO biological processes and KEGG pathways involved in transition from healthy to precancer to cancer |
| Tissue | Disease Stage | Enriched GO biological Processes |
| Colorectum | AD |  |
| Colorectum | SER |  |
| Colorectum | MSS |  |
| Colorectum | MSI-H |  |
| Colorectum | FAP |  |
| ∗Top 15 enriched GO BP terms are showed in the bar plot of each disease state in each tissue. Each row represents a significant GO biological process which is colored according to the -log10(p.adjust). |
| Page: 1 2 3 4 5 6 7 8 9 |
| GO ID | Tissue | Disease Stage | Description | Gene Ratio | Bg Ratio | pvalue | p.adjust | Count |
| GO:004206010 | Cervix | CC | wound healing | 109/2311 | 422/18723 | 1.84e-14 | 1.57e-11 | 109 |
| GO:005254710 | Cervix | CC | regulation of peptidase activity | 112/2311 | 461/18723 | 6.70e-13 | 3.08e-10 | 112 |
| GO:005254810 | Cervix | CC | regulation of endopeptidase activity | 103/2311 | 432/18723 | 1.89e-11 | 5.14e-09 | 103 |
| GO:00026837 | Cervix | CC | negative regulation of immune system process | 94/2311 | 434/18723 | 2.63e-08 | 1.87e-06 | 94 |
| GO:004586110 | Cervix | CC | negative regulation of proteolysis | 80/2311 | 351/18723 | 2.88e-08 | 1.98e-06 | 80 |
| GO:00075689 | Cervix | CC | aging | 75/2311 | 339/18723 | 2.75e-07 | 1.13e-05 | 75 |
| GO:00513469 | Cervix | CC | negative regulation of hydrolase activity | 81/2311 | 379/18723 | 4.27e-07 | 1.67e-05 | 81 |
| GO:19030349 | Cervix | CC | regulation of response to wounding | 44/2311 | 167/18723 | 6.33e-07 | 2.31e-05 | 44 |
| GO:00104669 | Cervix | CC | negative regulation of peptidase activity | 60/2311 | 262/18723 | 1.27e-06 | 4.34e-05 | 60 |
| GO:005087810 | Cervix | CC | regulation of body fluid levels | 78/2311 | 379/18723 | 3.20e-06 | 8.77e-05 | 78 |
| GO:001095110 | Cervix | CC | negative regulation of endopeptidase activity | 56/2311 | 252/18723 | 7.43e-06 | 1.74e-04 | 56 |
| GO:00028315 | Cervix | CC | regulation of response to biotic stimulus | 67/2311 | 327/18723 | 1.79e-05 | 3.36e-04 | 67 |
| GO:00610418 | Cervix | CC | regulation of wound healing | 34/2311 | 134/18723 | 2.70e-05 | 4.52e-04 | 34 |
| GO:00022533 | Cervix | CC | activation of immune response | 72/2311 | 375/18723 | 8.26e-05 | 1.11e-03 | 72 |
| GO:00028322 | Cervix | CC | negative regulation of response to biotic stimulus | 27/2311 | 108/18723 | 2.27e-04 | 2.55e-03 | 27 |
| GO:00507773 | Cervix | CC | negative regulation of immune response | 41/2311 | 194/18723 | 3.63e-04 | 3.76e-03 | 41 |
| GO:00508176 | Cervix | CC | coagulation | 45/2311 | 222/18723 | 5.08e-04 | 4.94e-03 | 45 |
| GO:00075966 | Cervix | CC | blood coagulation | 44/2311 | 217/18723 | 5.78e-04 | 5.52e-03 | 44 |
| GO:00321022 | Cervix | CC | negative regulation of response to external stimulus | 75/2311 | 420/18723 | 5.96e-04 | 5.61e-03 | 75 |
| GO:00450882 | Cervix | CC | regulation of innate immune response | 44/2311 | 218/18723 | 6.40e-04 | 5.97e-03 | 44 |
| Page: 1 2 3 4 5 6 7 8 9 10 11 12 13 14 15 |
| Pathway ID | Tissue | Disease Stage | Description | Gene Ratio | Bg Ratio | pvalue | p.adjust | qvalue | Count |
| hsa051337 | Cervix | CC | Pertussis | 21/1267 | 76/8465 | 3.08e-03 | 1.19e-02 | 7.03e-03 | 21 |
| hsa0513312 | Cervix | CC | Pertussis | 21/1267 | 76/8465 | 3.08e-03 | 1.19e-02 | 7.03e-03 | 21 |
| hsa051339 | Esophagus | ESCC | Pertussis | 48/4205 | 76/8465 | 1.21e-02 | 2.77e-02 | 1.42e-02 | 48 |
| hsa0513314 | Esophagus | ESCC | Pertussis | 48/4205 | 76/8465 | 1.21e-02 | 2.77e-02 | 1.42e-02 | 48 |
| hsa04610 | Liver | NAFLD | Complement and coagulation cascades | 35/1043 | 86/8465 | 2.48e-11 | 2.04e-09 | 1.64e-09 | 35 |
| hsa046101 | Liver | NAFLD | Complement and coagulation cascades | 35/1043 | 86/8465 | 2.48e-11 | 2.04e-09 | 1.64e-09 | 35 |
| hsa046102 | Liver | Cirrhotic | Complement and coagulation cascades | 48/2530 | 86/8465 | 4.41e-07 | 5.44e-06 | 3.35e-06 | 48 |
| hsa05133 | Liver | Cirrhotic | Pertussis | 37/2530 | 76/8465 | 4.17e-04 | 2.57e-03 | 1.58e-03 | 37 |
| hsa046103 | Liver | Cirrhotic | Complement and coagulation cascades | 48/2530 | 86/8465 | 4.41e-07 | 5.44e-06 | 3.35e-06 | 48 |
| hsa051331 | Liver | Cirrhotic | Pertussis | 37/2530 | 76/8465 | 4.17e-04 | 2.57e-03 | 1.58e-03 | 37 |
| hsa046104 | Liver | HCC | Complement and coagulation cascades | 57/4020 | 86/8465 | 3.19e-04 | 1.45e-03 | 8.04e-04 | 57 |
| hsa051332 | Liver | HCC | Pertussis | 48/4020 | 76/8465 | 4.17e-03 | 1.27e-02 | 7.06e-03 | 48 |
| hsa046105 | Liver | HCC | Complement and coagulation cascades | 57/4020 | 86/8465 | 3.19e-04 | 1.45e-03 | 8.04e-04 | 57 |
| hsa051333 | Liver | HCC | Pertussis | 48/4020 | 76/8465 | 4.17e-03 | 1.27e-02 | 7.06e-03 | 48 |
| hsa051334 | Liver | Cyst | Pertussis | 11/339 | 76/8465 | 2.00e-04 | 2.51e-03 | 2.07e-03 | 11 |
| hsa051335 | Liver | Cyst | Pertussis | 11/339 | 76/8465 | 2.00e-04 | 2.51e-03 | 2.07e-03 | 11 |
| hsa051338 | Oral cavity | OSCC | Pertussis | 50/3704 | 76/8465 | 8.34e-05 | 3.04e-04 | 1.55e-04 | 50 |
| hsa0513313 | Oral cavity | OSCC | Pertussis | 50/3704 | 76/8465 | 8.34e-05 | 3.04e-04 | 1.55e-04 | 50 |
| Page: 1 |
Top |
Cell-cell communication analysis |
| Identification of potential cell-cell interactions between two cell types and their ligand-receptor pairs for different disease states |
| Ligand | Receptor | LRpair | Pathway | Tissue | Disease Stage |
| Page: 1 |
Top |
Single-cell gene regulatory network inference analysis |
| Find out the significant the regulons (TFs) and the target genes of each regulon across cell types for different disease states |
| TF | Cell Type | Tissue | Disease Stage | Target Gene | RSS | Regulon Activity |
| ∗The dot plots of a searched regulon are shown for all cell subpopulations in each disease state of each tissue based on the regulon specific score inferred using pySCENIC and by calculating the average expression. |
| Page: 1 |
Top |
Somatic mutation of malignant transformation related genes |
| Annotation of somatic variants for genes involved in malignant transformation |
| Hugo Symbol | Variant Class | Variant Classification | dbSNP RS | HGVSc | HGVSp | HGVSp Short | SWISSPROT | BIOTYPE | SIFT | PolyPhen | Tumor Sample Barcode | Tissue | Histology | Sex | Age | Stage | Therapy Types | Drugs | Outcome |
| SERPING1 | SNV | Missense_Mutation | rs778221680 | c.940N>T | p.His314Tyr | p.H314Y | P05155 | protein_coding | tolerated(1) | benign(0.02) | TCGA-B6-A40B-01 | Breast | breast invasive carcinoma | Female | >=65 | I/II | Unknown | Unknown | SD |
| SERPING1 | SNV | Missense_Mutation | c.433G>A | p.Ala145Thr | p.A145T | P05155 | protein_coding | deleterious(0) | probably_damaging(0.925) | TCGA-D8-A1XY-01 | Breast | breast invasive carcinoma | Female | >=65 | I/II | Chemotherapy | tamoxiphen | SD | |
| SERPING1 | SNV | Missense_Mutation | rs548701651 | c.827N>A | p.Arg276Gln | p.R276Q | P05155 | protein_coding | tolerated(1) | benign(0) | TCGA-D8-A1Y1-01 | Breast | breast invasive carcinoma | Female | >=65 | III/IV | Hormone Therapy | tamoxiphen | PD |
| SERPING1 | SNV | Missense_Mutation | c.913N>T | p.Pro305Ser | p.P305S | P05155 | protein_coding | tolerated(0.78) | benign(0.087) | TCGA-E2-A1LH-01 | Breast | breast invasive carcinoma | Female | <65 | I/II | Chemotherapy | adriamycin | SD | |
| SERPING1 | SNV | Missense_Mutation | c.659N>T | p.Ser220Leu | p.S220L | P05155 | protein_coding | deleterious(0) | benign(0.189) | TCGA-C5-A1BK-01 | Cervix | cervical & endocervical cancer | Female | <65 | I/II | Unknown | Unknown | SD | |
| SERPING1 | SNV | Missense_Mutation | c.1057N>G | p.Leu353Val | p.L353V | P05155 | protein_coding | deleterious(0.02) | benign(0.088) | TCGA-C5-A1BQ-01 | Cervix | cervical & endocervical cancer | Female | >=65 | III/IV | Chemotherapy | cisplatin | CR | |
| SERPING1 | SNV | Missense_Mutation | c.881A>G | p.Tyr294Cys | p.Y294C | P05155 | protein_coding | tolerated(0.06) | probably_damaging(0.951) | TCGA-AA-3864-01 | Colorectum | colon adenocarcinoma | Male | >=65 | I/II | Unknown | Unknown | SD | |
| SERPING1 | SNV | Missense_Mutation | novel | c.1261N>G | p.Phe421Val | p.F421V | P05155 | protein_coding | deleterious(0) | benign(0.289) | TCGA-AA-3984-01 | Colorectum | colon adenocarcinoma | Female | <65 | I/II | Unknown | Unknown | SD |
| SERPING1 | SNV | Missense_Mutation | rs139035354 | c.466G>A | p.Ala156Thr | p.A156T | P05155 | protein_coding | tolerated(0.2) | benign(0.139) | TCGA-AA-A00N-01 | Colorectum | colon adenocarcinoma | Male | >=65 | I/II | Unknown | Unknown | PD |
| SERPING1 | SNV | Missense_Mutation | c.338N>A | p.Ser113Tyr | p.S113Y | P05155 | protein_coding | tolerated(0.07) | benign(0.059) | TCGA-AA-A010-01 | Colorectum | colon adenocarcinoma | Female | <65 | I/II | Chemotherapy | folinic | CR |
| Page: 1 2 3 4 5 6 |
Top |
Related drugs of malignant transformation related genes |
| Identification of chemicals and drugs interact with genes involved in malignant transfromation |
| (DGIdb 4.0) |
| Entrez ID | Symbol | Category | Interaction Types | Drug Claim Name | Drug Name | PMIDs |
| 710 | SERPING1 | DRUGGABLE GENOME, PROTEASE INHIBITOR | Rhucin | RHUCIN | ||
| 710 | SERPING1 | DRUGGABLE GENOME, PROTEASE INHIBITOR | C1-INH | |||
| 710 | SERPING1 | DRUGGABLE GENOME, PROTEASE INHIBITOR | RECOMBINANT HUMAN C1 ESTERASE INHIBITOR | |||
| 710 | SERPING1 | DRUGGABLE GENOME, PROTEASE INHIBITOR | Cinryze | CINRYZE |
| Page: 1 |

Copyright 2023-Present -The University of Texas Health Science Center at Houston |