
|
|||||
|
 | |
| |
| |
| |
| |
| |
|
Gene: SERPINF1 |
Gene summary for SERPINF1 |
| Gene information | Species | Human | Gene symbol | SERPINF1 | Gene ID | 5176 |
| Gene name | serpin family F member 1 | |
| Gene Alias | EPC-1 | |
| Cytomap | 17p13.3 | |
| Gene Type | protein-coding | GO ID | GO:0000003 | UniProtAcc | A0A140VKF3 |
Top |
Malignant transformation analysis |
| Identification of the aberrant gene expression in precancerous and cancerous lesions by comparing the gene expression of stem-like cells in diseased tissues with normal stem cells |
| Entrez ID | Symbol | Replicates | Species | Organ | Tissue | Adj P-value | Log2FC | Malignancy |
| 5176 | SERPINF1 | AEH-subject1 | Human | Endometrium | AEH | 2.14e-27 | -8.02e-01 | -0.3059 |
| 5176 | SERPINF1 | AEH-subject2 | Human | Endometrium | AEH | 3.89e-36 | -8.76e-01 | -0.2525 |
| 5176 | SERPINF1 | AEH-subject3 | Human | Endometrium | AEH | 1.42e-27 | -7.63e-01 | -0.2576 |
| 5176 | SERPINF1 | AEH-subject4 | Human | Endometrium | AEH | 1.30e-21 | -8.05e-01 | -0.2657 |
| 5176 | SERPINF1 | AEH-subject5 | Human | Endometrium | AEH | 1.37e-41 | -8.84e-01 | -0.2953 |
| 5176 | SERPINF1 | EEC-subject1 | Human | Endometrium | EEC | 3.66e-42 | -8.67e-01 | -0.2682 |
| 5176 | SERPINF1 | EEC-subject2 | Human | Endometrium | EEC | 1.29e-38 | -8.66e-01 | -0.2607 |
| 5176 | SERPINF1 | EEC-subject3 | Human | Endometrium | EEC | 1.43e-41 | -8.43e-01 | -0.2525 |
| 5176 | SERPINF1 | EEC-subject4 | Human | Endometrium | EEC | 6.89e-26 | -7.33e-01 | -0.2571 |
| 5176 | SERPINF1 | EEC-subject5 | Human | Endometrium | EEC | 8.07e-27 | -7.72e-01 | -0.249 |
| 5176 | SERPINF1 | GSM5276935 | Human | Endometrium | EEC | 5.63e-17 | -6.25e-01 | -0.123 |
| 5176 | SERPINF1 | GSM6177620_NYU_UCEC1_lib1_lib1 | Human | Endometrium | EEC | 1.25e-29 | -8.58e-01 | -0.1869 |
| 5176 | SERPINF1 | GSM6177620_NYU_UCEC1_lib2_lib2 | Human | Endometrium | EEC | 2.64e-27 | -8.63e-01 | -0.1875 |
| 5176 | SERPINF1 | GSM6177620_NYU_UCEC1_lib3_lib3 | Human | Endometrium | EEC | 3.13e-31 | -8.51e-01 | -0.1883 |
| 5176 | SERPINF1 | GSM6177621_NYU_UCEC2_lib1_lib1 | Human | Endometrium | EEC | 2.59e-25 | -7.02e-01 | -0.1934 |
| 5176 | SERPINF1 | GSM6177622_NYU_UCEC3_lib1_lib1 | Human | Endometrium | EEC | 1.42e-32 | -7.44e-01 | -0.1917 |
| 5176 | SERPINF1 | GSM6177622_NYU_UCEC3_lib2_lib2 | Human | Endometrium | EEC | 4.53e-32 | -7.76e-01 | -0.1916 |
| 5176 | SERPINF1 | LZE2T | Human | Esophagus | ESCC | 1.68e-15 | 1.31e+00 | 0.082 |
| 5176 | SERPINF1 | LZE4T | Human | Esophagus | ESCC | 1.90e-08 | 5.25e-01 | 0.0811 |
| 5176 | SERPINF1 | P1T-E | Human | Esophagus | ESCC | 9.43e-03 | 4.78e-01 | 0.0875 |
| Page: 1 2 3 4 5 6 7 |
| Tissue | Expression Dynamics | Abbreviation |
| Endometrium |  | AEH: Atypical endometrial hyperplasia |
| EEC: Endometrioid Cancer | ||
| Esophagus | 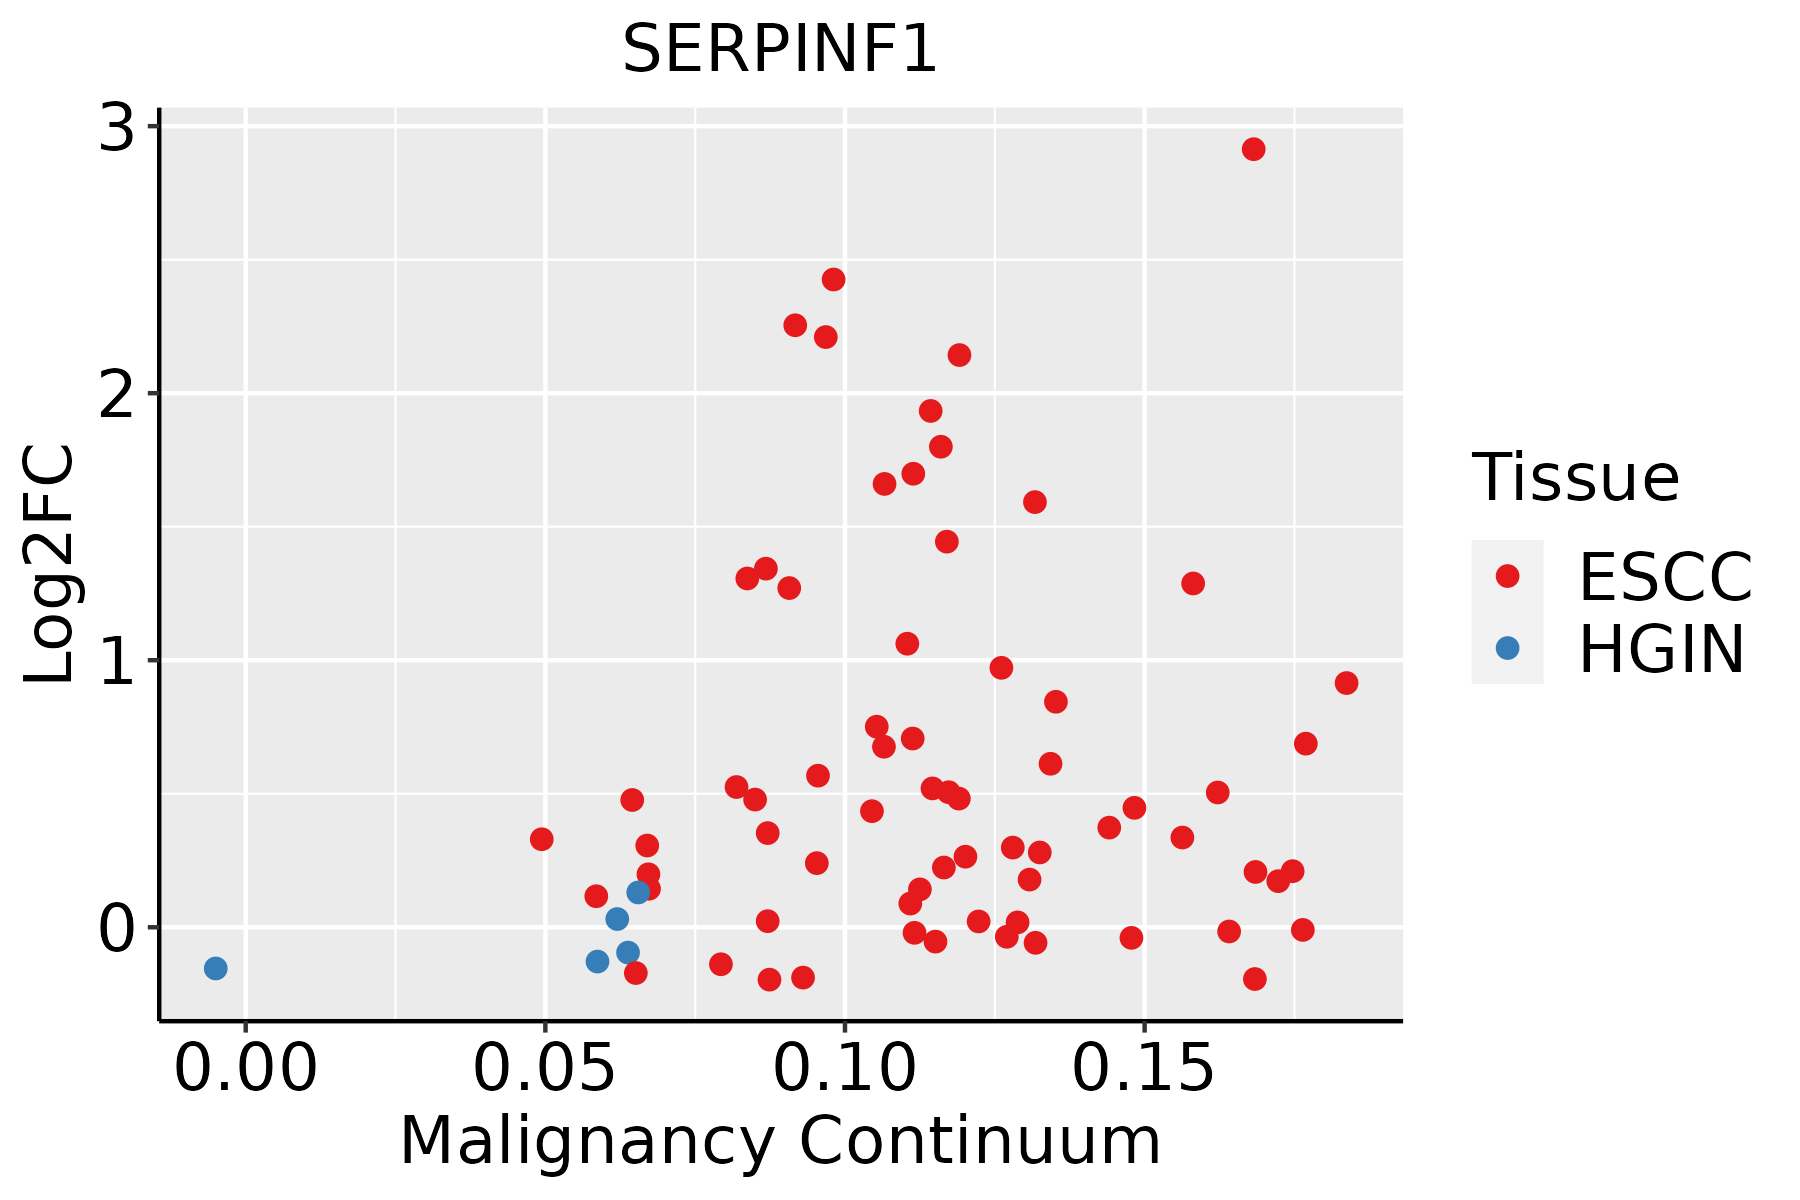 | ESCC: Esophageal squamous cell carcinoma |
| HGIN: High-grade intraepithelial neoplasias | ||
| LGIN: Low-grade intraepithelial neoplasias | ||
| Liver | 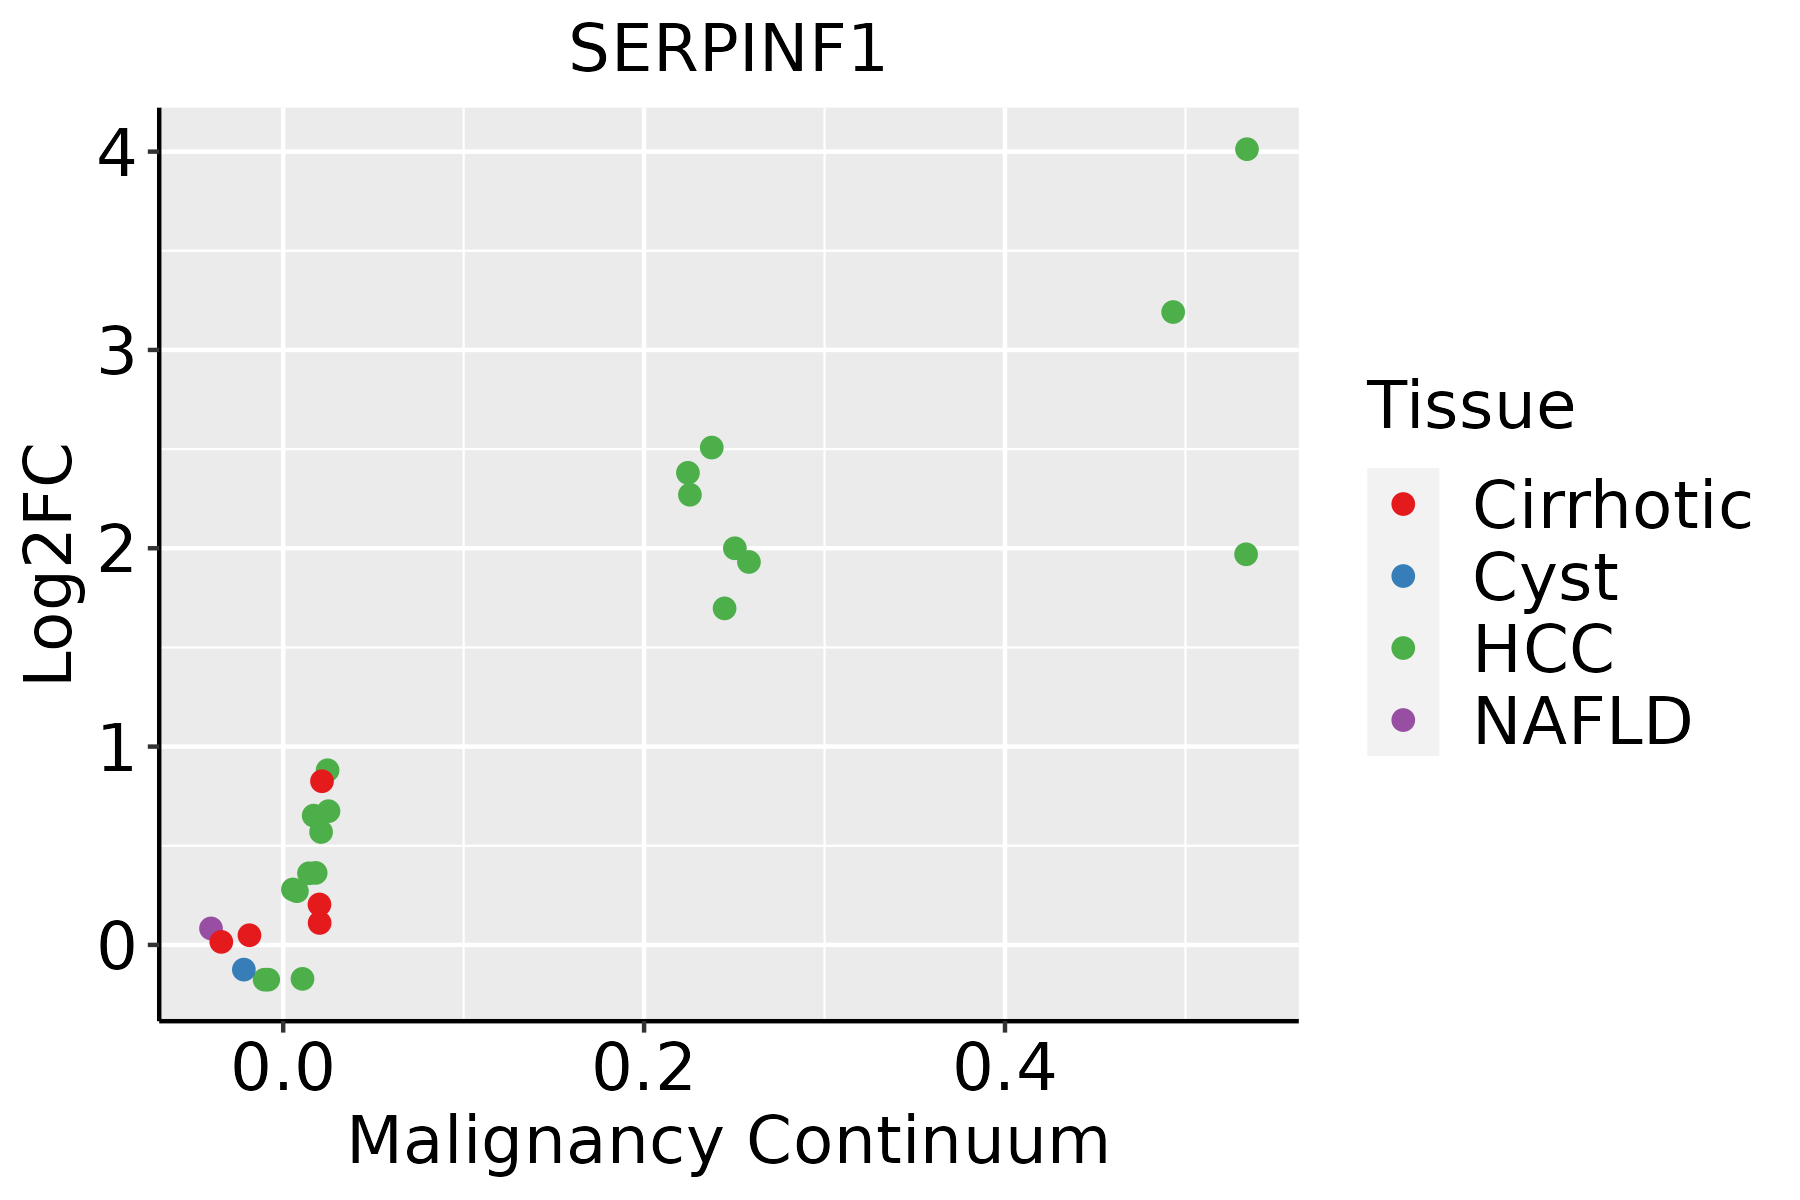 | HCC: Hepatocellular carcinoma |
| NAFLD: Non-alcoholic fatty liver disease | ||
| Oral Cavity | 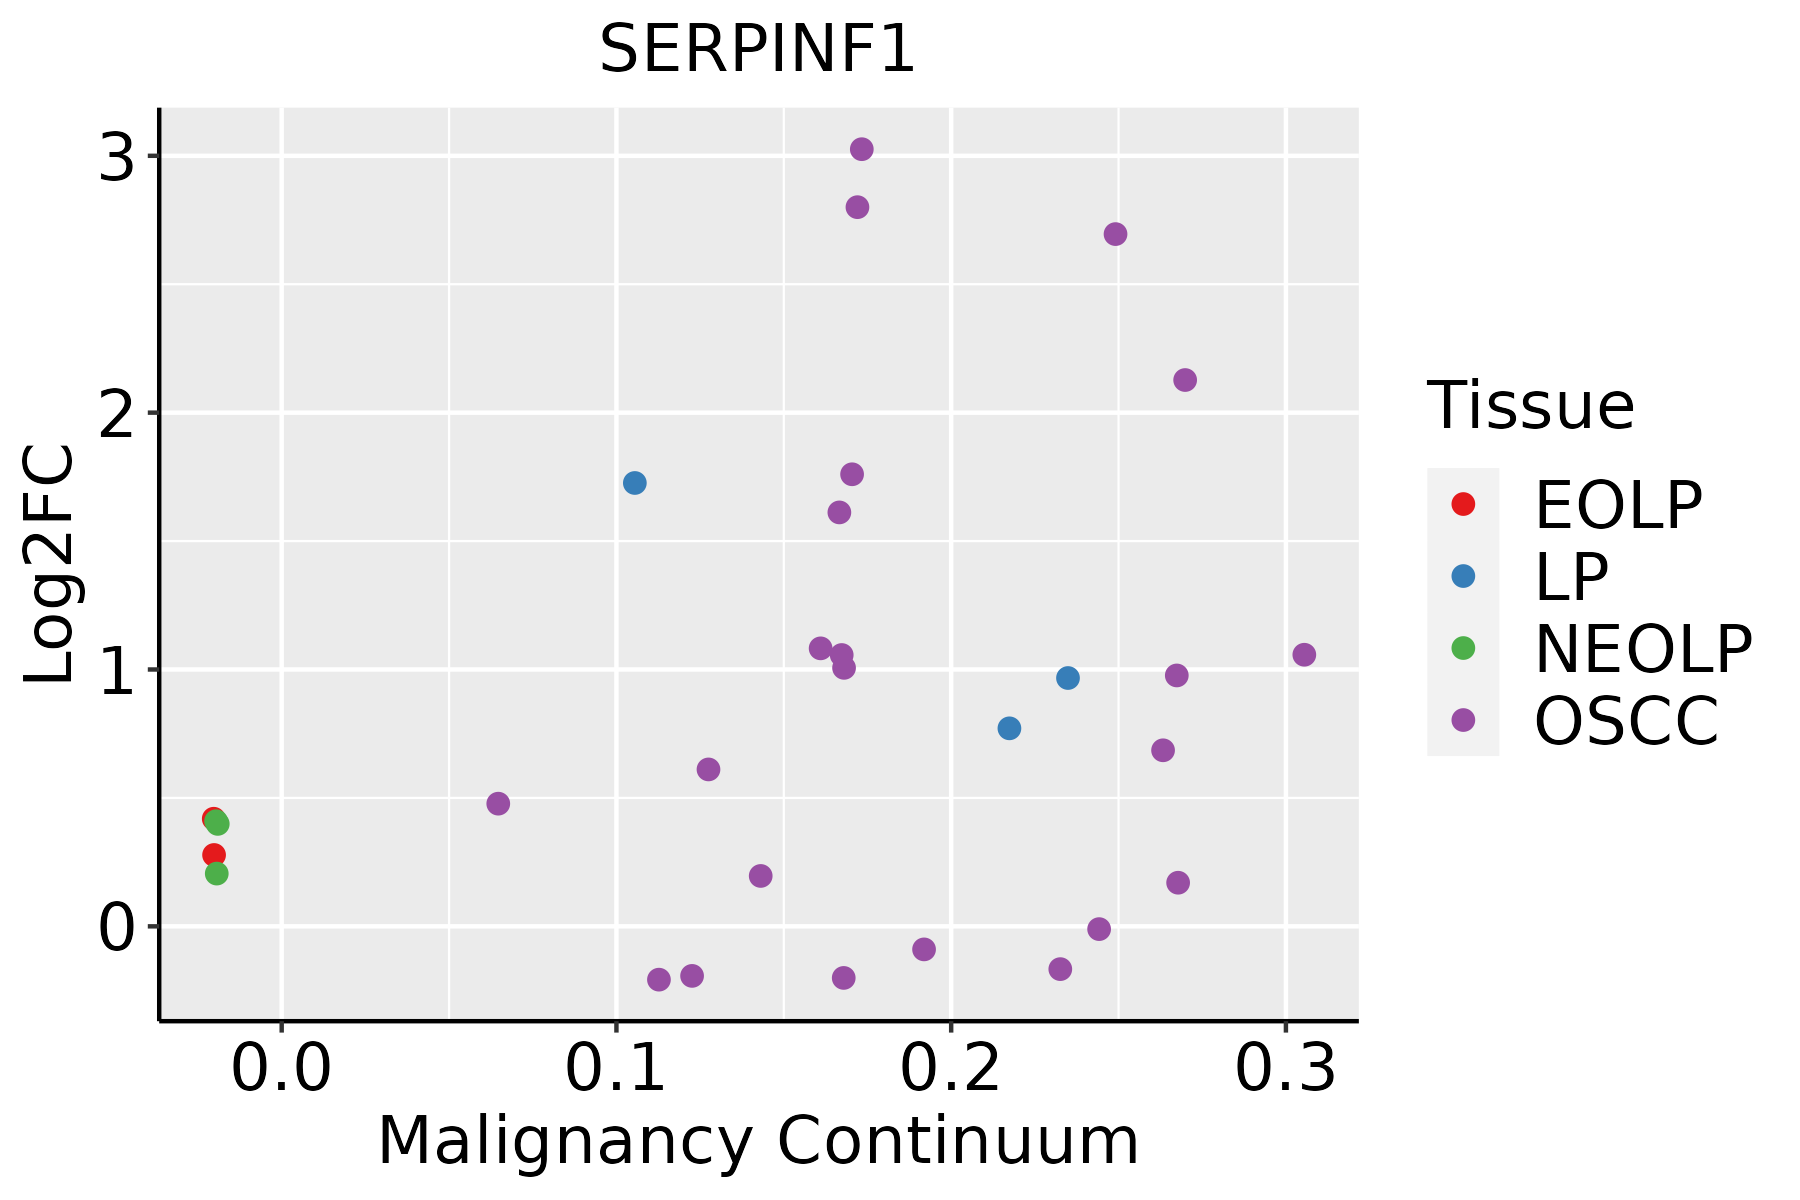 | EOLP: Erosive Oral lichen planus |
| LP: leukoplakia | ||
| NEOLP: Non-erosive oral lichen planus | ||
| OSCC: Oral squamous cell carcinoma | ||
| Prostate | 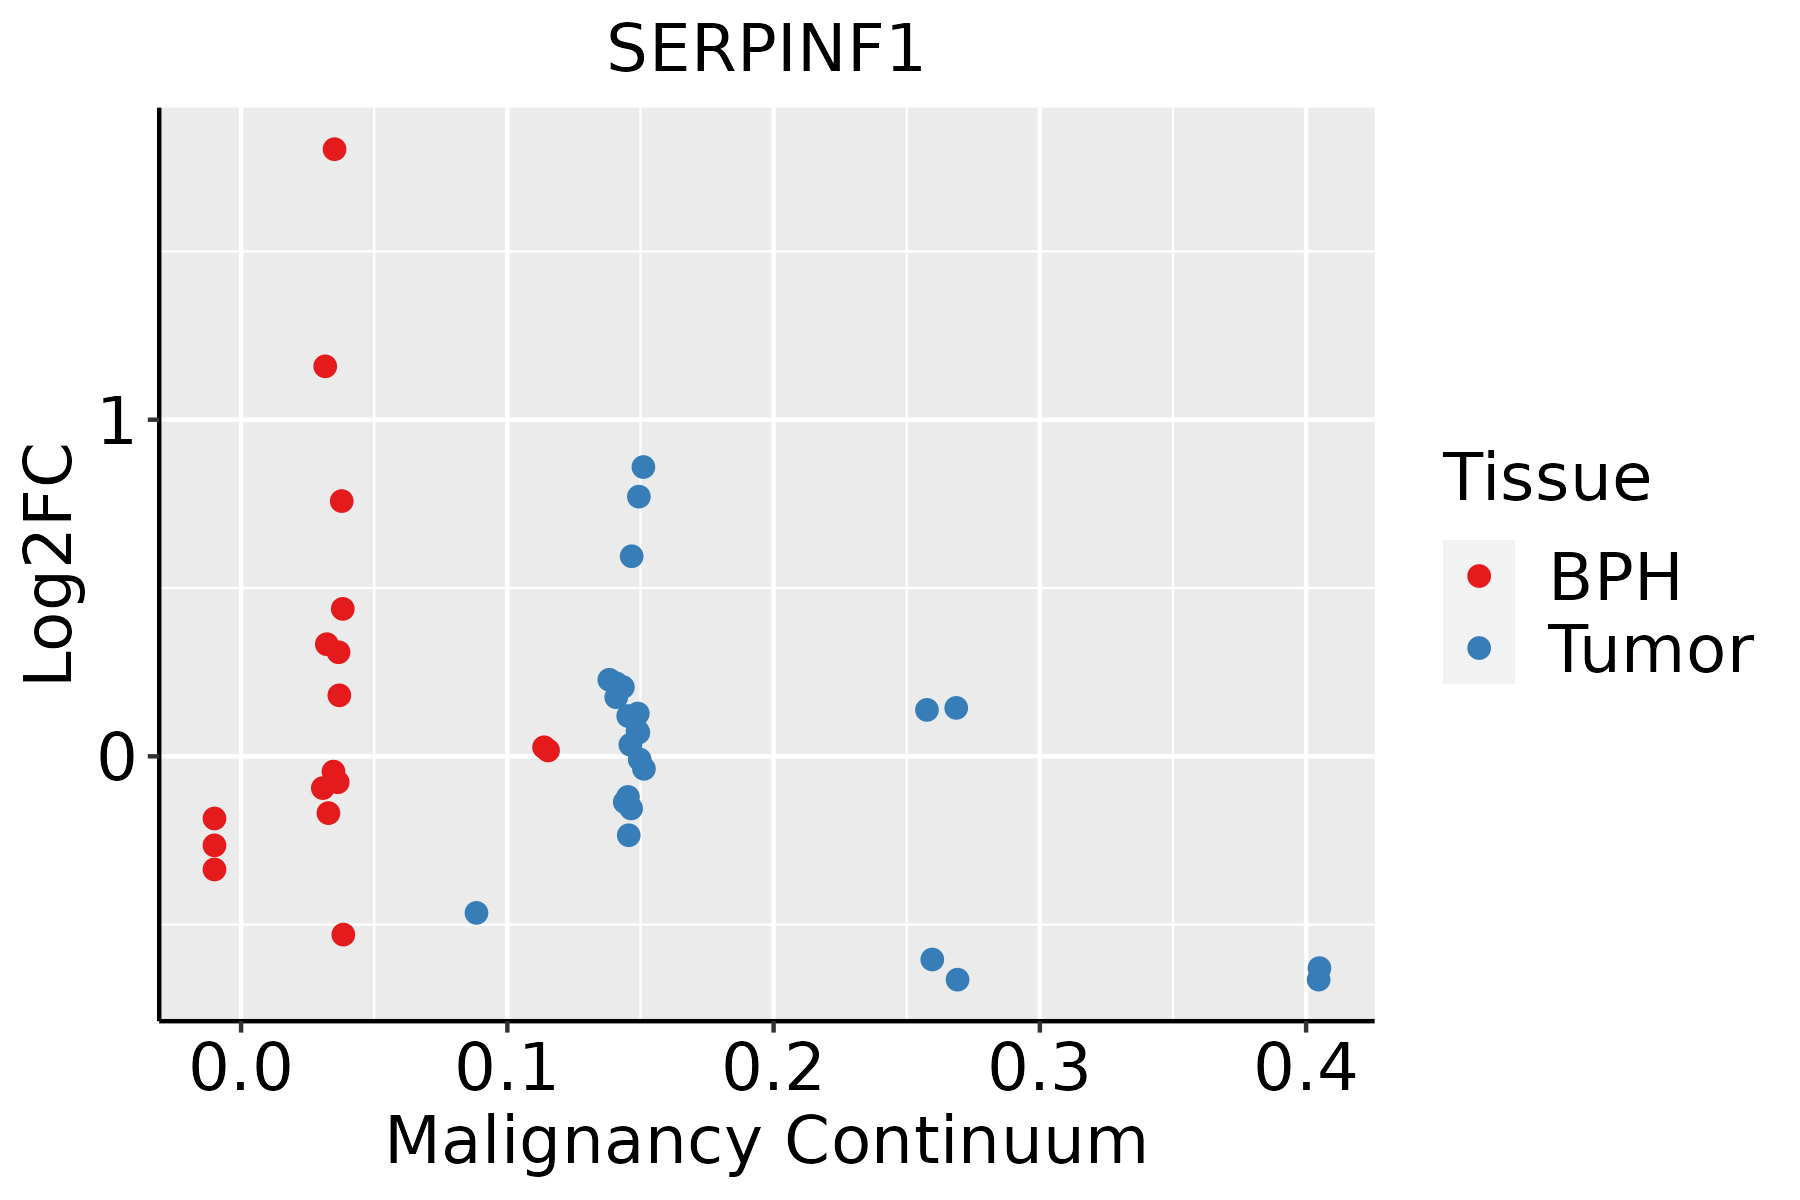 | BPH: Benign Prostatic Hyperplasia |
| Skin | 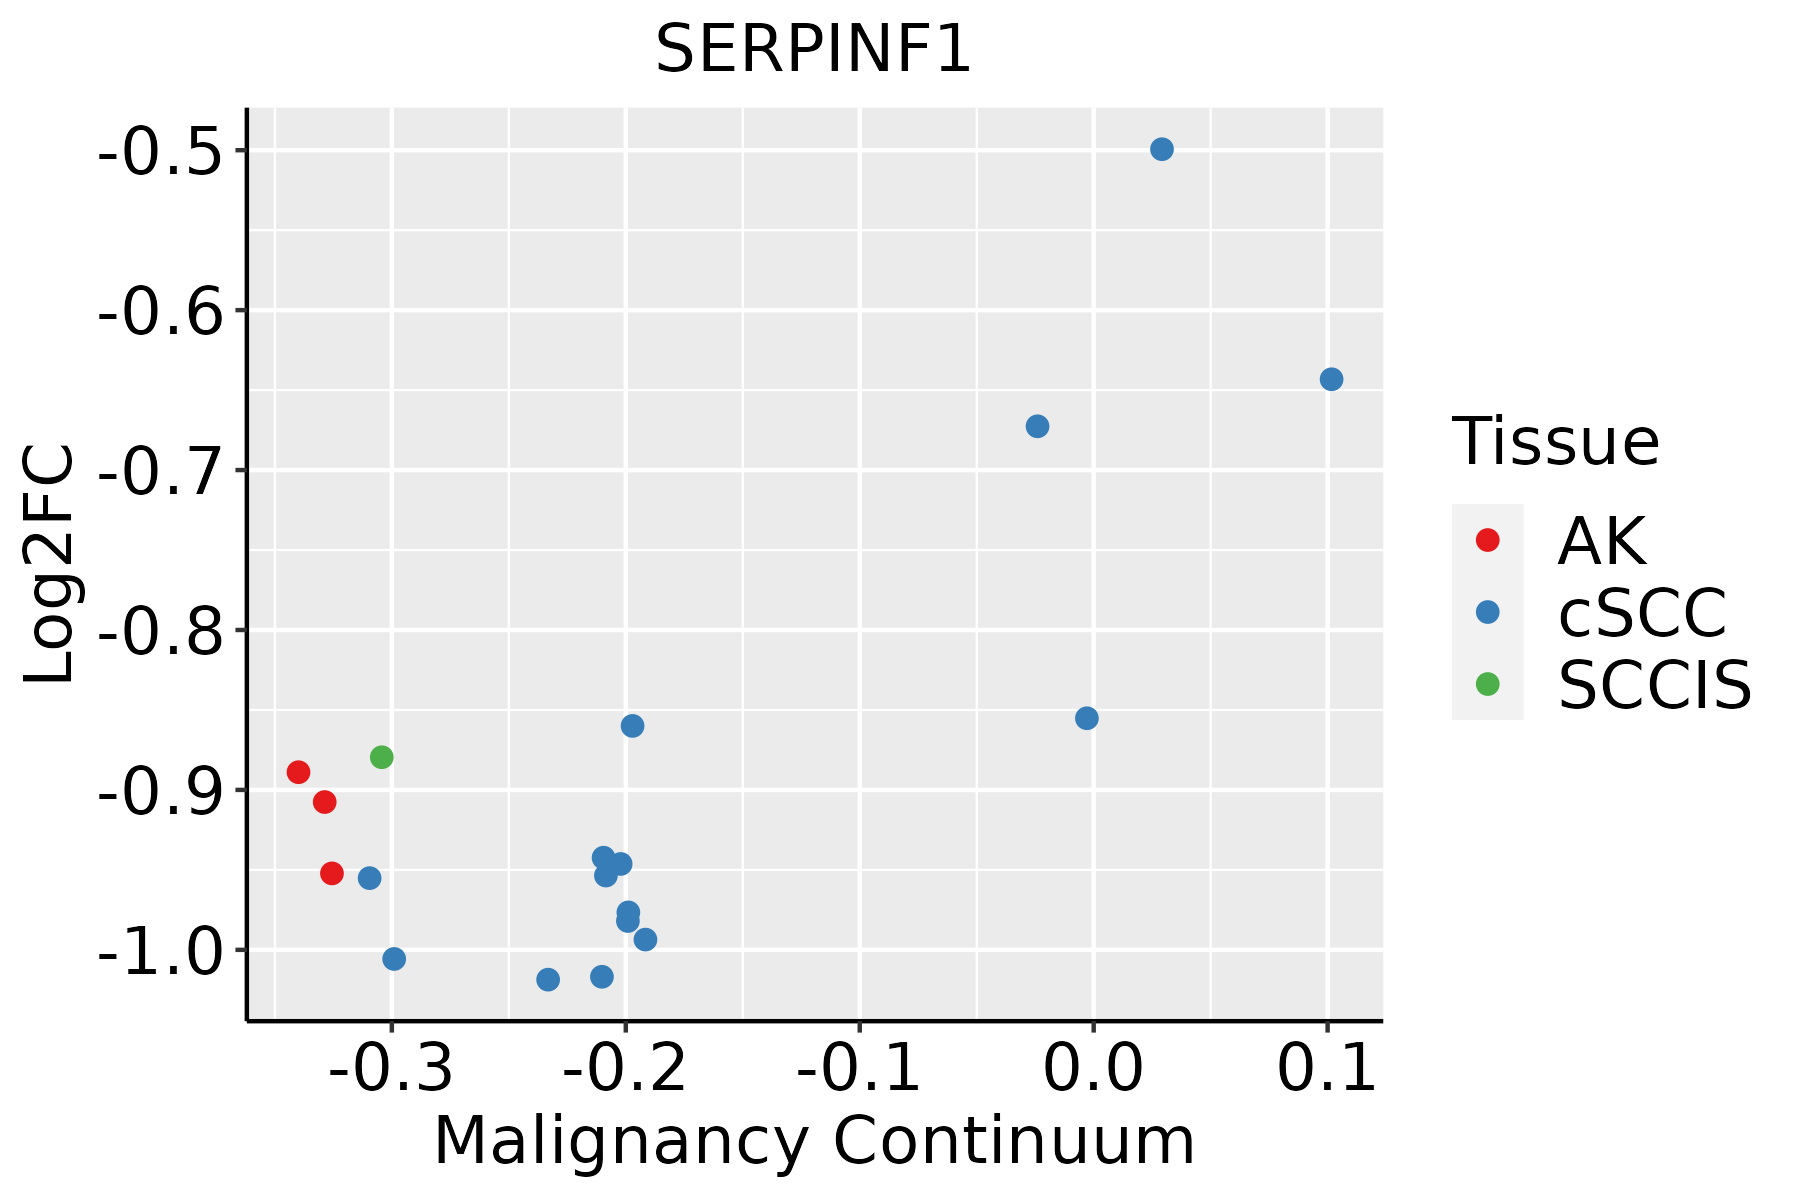 | AK: Actinic keratosis |
| cSCC: Cutaneous squamous cell carcinoma | ||
| SCCIS:squamous cell carcinoma in situ | ||
| Thyroid |  | ATC: Anaplastic thyroid cancer |
| HT: Hashimoto's thyroiditis | ||
| PTC: Papillary thyroid cancer |
| ∗log2FC in expression of this searched gene in stem-like cells from each diseased tissue sample relative to stem-like cells in normal samples in each tissue plotted against the malignancy continuum. Samples are colored based on if they are from different disease stage. |
Top |
Malignant transformation related pathway analysis |
| Find out the enriched GO biological processes and KEGG pathways involved in transition from healthy to precancer to cancer |
| Tissue | Disease Stage | Enriched GO biological Processes |
| Colorectum | AD |  |
| Colorectum | SER |  |
| Colorectum | MSS |  |
| Colorectum | MSI-H |  |
| Colorectum | FAP |  |
| ∗Top 15 enriched GO BP terms are showed in the bar plot of each disease state in each tissue. Each row represents a significant GO biological process which is colored according to the -log10(p.adjust). |
| Page: 1 2 3 4 5 6 7 8 9 |
| GO ID | Tissue | Disease Stage | Description | Gene Ratio | Bg Ratio | pvalue | p.adjust | Count |
| GO:000974316 | Endometrium | AEH | response to carbohydrate | 62/2100 | 253/18723 | 1.76e-09 | 1.51e-07 | 62 |
| GO:003428416 | Endometrium | AEH | response to monosaccharide | 57/2100 | 225/18723 | 2.13e-09 | 1.77e-07 | 57 |
| GO:004854516 | Endometrium | AEH | response to steroid hormone | 76/2100 | 339/18723 | 2.15e-09 | 1.77e-07 | 76 |
| GO:00614589 | Endometrium | AEH | reproductive system development | 88/2100 | 427/18723 | 9.50e-09 | 6.41e-07 | 88 |
| GO:00486089 | Endometrium | AEH | reproductive structure development | 87/2100 | 424/18723 | 1.43e-08 | 9.12e-07 | 87 |
| GO:000974615 | Endometrium | AEH | response to hexose | 54/2100 | 219/18723 | 1.54e-08 | 9.72e-07 | 54 |
| GO:00485119 | Endometrium | AEH | rhythmic process | 67/2100 | 298/18723 | 1.69e-08 | 1.04e-06 | 67 |
| GO:000974910 | Endometrium | AEH | response to glucose | 52/2100 | 212/18723 | 3.40e-08 | 1.91e-06 | 52 |
| GO:00016789 | Endometrium | AEH | cellular glucose homeostasis | 44/2100 | 172/18723 | 1.04e-07 | 5.07e-06 | 44 |
| GO:000166710 | Endometrium | AEH | ameboidal-type cell migration | 90/2100 | 475/18723 | 3.73e-07 | 1.57e-05 | 90 |
| GO:007132210 | Endometrium | AEH | cellular response to carbohydrate stimulus | 41/2100 | 163/18723 | 4.55e-07 | 1.87e-05 | 41 |
| GO:00506738 | Endometrium | AEH | epithelial cell proliferation | 84/2100 | 437/18723 | 4.88e-07 | 1.94e-05 | 84 |
| GO:009013014 | Endometrium | AEH | tissue migration | 73/2100 | 365/18723 | 5.79e-07 | 2.20e-05 | 73 |
| GO:009013214 | Endometrium | AEH | epithelium migration | 72/2100 | 360/18723 | 6.90e-07 | 2.55e-05 | 72 |
| GO:004873216 | Endometrium | AEH | gland development | 83/2100 | 436/18723 | 8.62e-07 | 3.11e-05 | 83 |
| GO:001063114 | Endometrium | AEH | epithelial cell migration | 71/2100 | 357/18723 | 1.02e-06 | 3.52e-05 | 71 |
| GO:00713339 | Endometrium | AEH | cellular response to glucose stimulus | 38/2100 | 151/18723 | 1.17e-06 | 3.82e-05 | 38 |
| GO:190165415 | Endometrium | AEH | response to ketone | 45/2100 | 194/18723 | 1.48e-06 | 4.69e-05 | 45 |
| GO:00713319 | Endometrium | AEH | cellular response to hexose stimulus | 38/2100 | 153/18723 | 1.65e-06 | 5.13e-05 | 38 |
| GO:004259310 | Endometrium | AEH | glucose homeostasis | 55/2100 | 258/18723 | 1.87e-06 | 5.74e-05 | 55 |
| Page: 1 2 3 4 5 6 7 8 9 10 11 12 13 14 15 16 17 18 19 20 21 22 23 24 25 26 27 28 29 30 31 32 33 34 35 36 37 38 39 40 |
| Pathway ID | Tissue | Disease Stage | Description | Gene Ratio | Bg Ratio | pvalue | p.adjust | qvalue | Count |
| hsa0431010 | Endometrium | AEH | Wnt signaling pathway | 37/1197 | 171/8465 | 4.68e-03 | 2.53e-02 | 1.86e-02 | 37 |
| hsa0431013 | Endometrium | AEH | Wnt signaling pathway | 37/1197 | 171/8465 | 4.68e-03 | 2.53e-02 | 1.86e-02 | 37 |
| hsa0431022 | Endometrium | EEC | Wnt signaling pathway | 40/1237 | 171/8465 | 1.37e-03 | 8.99e-03 | 6.70e-03 | 40 |
| hsa0431032 | Endometrium | EEC | Wnt signaling pathway | 40/1237 | 171/8465 | 1.37e-03 | 8.99e-03 | 6.70e-03 | 40 |
| hsa0431016 | Oral cavity | EOLP | Wnt signaling pathway | 37/1218 | 171/8465 | 6.23e-03 | 1.83e-02 | 1.08e-02 | 37 |
| hsa0431017 | Oral cavity | EOLP | Wnt signaling pathway | 37/1218 | 171/8465 | 6.23e-03 | 1.83e-02 | 1.08e-02 | 37 |
| hsa0431024 | Oral cavity | NEOLP | Wnt signaling pathway | 34/1112 | 171/8465 | 8.05e-03 | 2.88e-02 | 1.81e-02 | 34 |
| hsa0431034 | Oral cavity | NEOLP | Wnt signaling pathway | 34/1112 | 171/8465 | 8.05e-03 | 2.88e-02 | 1.81e-02 | 34 |
| hsa0431014 | Prostate | BPH | Wnt signaling pathway | 50/1718 | 171/8465 | 3.11e-03 | 1.15e-02 | 7.14e-03 | 50 |
| hsa0431015 | Prostate | BPH | Wnt signaling pathway | 50/1718 | 171/8465 | 3.11e-03 | 1.15e-02 | 7.14e-03 | 50 |
| hsa0431023 | Prostate | Tumor | Wnt signaling pathway | 50/1791 | 171/8465 | 7.32e-03 | 2.37e-02 | 1.47e-02 | 50 |
| hsa0431033 | Prostate | Tumor | Wnt signaling pathway | 50/1791 | 171/8465 | 7.32e-03 | 2.37e-02 | 1.47e-02 | 50 |
| Page: 1 |
Top |
Cell-cell communication analysis |
| Identification of potential cell-cell interactions between two cell types and their ligand-receptor pairs for different disease states |
| Ligand | Receptor | LRpair | Pathway | Tissue | Disease Stage |
| Page: 1 |
Top |
Single-cell gene regulatory network inference analysis |
| Find out the significant the regulons (TFs) and the target genes of each regulon across cell types for different disease states |
| TF | Cell Type | Tissue | Disease Stage | Target Gene | RSS | Regulon Activity |
| ∗The dot plots of a searched regulon are shown for all cell subpopulations in each disease state of each tissue based on the regulon specific score inferred using pySCENIC and by calculating the average expression. |
| Page: 1 |
Top |
Somatic mutation of malignant transformation related genes |
| Annotation of somatic variants for genes involved in malignant transformation |
| Hugo Symbol | Variant Class | Variant Classification | dbSNP RS | HGVSc | HGVSp | HGVSp Short | SWISSPROT | BIOTYPE | SIFT | PolyPhen | Tumor Sample Barcode | Tissue | Histology | Sex | Age | Stage | Therapy Types | Drugs | Outcome |
| SERPINF1 | SNV | Missense_Mutation | c.858N>C | p.Leu286Phe | p.L286F | P36955 | protein_coding | deleterious(0.04) | probably_damaging(0.985) | TCGA-A2-A0EQ-01 | Breast | breast invasive carcinoma | Female | <65 | I/II | Chemotherapy | adriamycin | SD | |
| SERPINF1 | SNV | Missense_Mutation | rs762257275 | c.296N>A | p.Arg99Gln | p.R99Q | P36955 | protein_coding | tolerated(0.24) | benign(0.063) | TCGA-AN-A046-01 | Breast | breast invasive carcinoma | Female | >=65 | I/II | Unknown | Unknown | SD |
| SERPINF1 | SNV | Missense_Mutation | c.451N>C | p.Lys151Gln | p.K151Q | P36955 | protein_coding | deleterious(0.01) | possibly_damaging(0.51) | TCGA-AO-A0JB-01 | Breast | breast invasive carcinoma | Female | <65 | III/IV | Chemotherapy | cyclophosphamide | SD | |
| SERPINF1 | insertion | Frame_Shift_Ins | c.324_325insCTCTCAGCAGACAAAAAAGATGAGTA | p.Tyr109LeufsTer13 | p.Y109Lfs*13 | P36955 | protein_coding | TCGA-AN-A0AL-01 | Breast | breast invasive carcinoma | Female | <65 | III/IV | Unknown | Unknown | SD | |||
| SERPINF1 | SNV | Missense_Mutation | c.341N>A | p.Ser114Asn | p.S114N | P36955 | protein_coding | tolerated(0.92) | benign(0) | TCGA-2W-A8YY-01 | Cervix | cervical & endocervical cancer | Female | <65 | I/II | Chemotherapy | cisplatin | CR | |
| SERPINF1 | SNV | Missense_Mutation | novel | c.668N>G | p.Ser223Cys | p.S223C | P36955 | protein_coding | deleterious(0.05) | possibly_damaging(0.797) | TCGA-MY-A913-01 | Cervix | cervical & endocervical cancer | Female | <65 | I/II | Chemotherapy | cisplatin | CR |
| SERPINF1 | SNV | Missense_Mutation | c.341G>A | p.Ser114Asn | p.S114N | P36955 | protein_coding | tolerated(0.92) | benign(0) | TCGA-AA-A010-01 | Colorectum | colon adenocarcinoma | Female | <65 | I/II | Chemotherapy | folinic | CR | |
| SERPINF1 | SNV | Missense_Mutation | c.852G>T | p.Gln284His | p.Q284H | P36955 | protein_coding | deleterious(0.02) | probably_damaging(0.966) | TCGA-AA-A010-01 | Colorectum | colon adenocarcinoma | Female | <65 | I/II | Chemotherapy | folinic | CR | |
| SERPINF1 | SNV | Missense_Mutation | novel | c.1216N>A | p.Leu406Ile | p.L406I | P36955 | protein_coding | deleterious(0.01) | probably_damaging(0.983) | TCGA-AA-A01D-01 | Colorectum | colon adenocarcinoma | Female | <65 | III/IV | Chemotherapy | capecitabine | PD |
| SERPINF1 | SNV | Missense_Mutation | c.262N>A | p.Ala88Thr | p.A88T | P36955 | protein_coding | deleterious(0.01) | probably_damaging(0.978) | TCGA-AZ-6598-01 | Colorectum | colon adenocarcinoma | Female | >=65 | I/II | Unknown | Unknown | SD |
| Page: 1 2 3 4 |
Top |
Related drugs of malignant transformation related genes |
| Identification of chemicals and drugs interact with genes involved in malignant transfromation |
| (DGIdb 4.0) |
| Entrez ID | Symbol | Category | Interaction Types | Drug Claim Name | Drug Name | PMIDs |
| 5176 | SERPINF1 | DRUGGABLE GENOME, PROTEASE INHIBITOR | AdPEDR | |||
| 5176 | SERPINF1 | DRUGGABLE GENOME, PROTEASE INHIBITOR | PEDF gene therapy |
| Page: 1 |

Copyright 2023-Present -The University of Texas Health Science Center at Houston |