
|
|||||
|
 | |
| |
| |
| |
| |
| |
|
Gene: SERPINE1 |
Gene summary for SERPINE1 |
| Gene information | Species | Human | Gene symbol | SERPINE1 | Gene ID | 5054 |
| Gene name | serpin family E member 1 | |
| Gene Alias | PAI | |
| Cytomap | 7q22.1 | |
| Gene Type | protein-coding | GO ID | GO:0001525 | UniProtAcc | A0A024QYT5 |
Top |
Malignant transformation analysis |
| Identification of the aberrant gene expression in precancerous and cancerous lesions by comparing the gene expression of stem-like cells in diseased tissues with normal stem cells |
| Entrez ID | Symbol | Replicates | Species | Organ | Tissue | Adj P-value | Log2FC | Malignancy |
| 5054 | SERPINE1 | GSM5276934 | Human | Endometrium | EEC | 2.94e-21 | 6.01e-01 | -0.0913 |
| 5054 | SERPINE1 | GSM5276937 | Human | Endometrium | EEC | 1.32e-59 | 1.25e+00 | -0.0897 |
| 5054 | SERPINE1 | LZE4T | Human | Esophagus | ESCC | 2.75e-05 | 6.59e-01 | 0.0811 |
| 5054 | SERPINE1 | P1T-E | Human | Esophagus | ESCC | 4.73e-04 | 1.47e+00 | 0.0875 |
| 5054 | SERPINE1 | P4T-E | Human | Esophagus | ESCC | 2.22e-16 | 1.28e+00 | 0.1323 |
| 5054 | SERPINE1 | P5T-E | Human | Esophagus | ESCC | 9.14e-29 | 1.43e+00 | 0.1327 |
| 5054 | SERPINE1 | P10T-E | Human | Esophagus | ESCC | 3.30e-09 | 6.07e-01 | 0.116 |
| 5054 | SERPINE1 | P11T-E | Human | Esophagus | ESCC | 1.01e-19 | 3.30e+00 | 0.1426 |
| 5054 | SERPINE1 | P15T-E | Human | Esophagus | ESCC | 1.72e-04 | 8.71e-01 | 0.1149 |
| 5054 | SERPINE1 | P17T-E | Human | Esophagus | ESCC | 6.05e-08 | 1.85e+00 | 0.1278 |
| 5054 | SERPINE1 | P20T-E | Human | Esophagus | ESCC | 7.56e-25 | 2.95e+00 | 0.1124 |
| 5054 | SERPINE1 | P21T-E | Human | Esophagus | ESCC | 4.42e-26 | 1.73e+00 | 0.1617 |
| 5054 | SERPINE1 | P22T-E | Human | Esophagus | ESCC | 3.29e-14 | 1.21e+00 | 0.1236 |
| 5054 | SERPINE1 | P23T-E | Human | Esophagus | ESCC | 1.88e-08 | 1.74e+00 | 0.108 |
| 5054 | SERPINE1 | P24T-E | Human | Esophagus | ESCC | 1.47e-09 | 1.30e+00 | 0.1287 |
| 5054 | SERPINE1 | P26T-E | Human | Esophagus | ESCC | 2.67e-13 | 7.26e-01 | 0.1276 |
| 5054 | SERPINE1 | P27T-E | Human | Esophagus | ESCC | 1.36e-23 | 2.12e+00 | 0.1055 |
| 5054 | SERPINE1 | P31T-E | Human | Esophagus | ESCC | 1.09e-09 | 1.10e+00 | 0.1251 |
| 5054 | SERPINE1 | P32T-E | Human | Esophagus | ESCC | 5.90e-54 | 2.56e+00 | 0.1666 |
| 5054 | SERPINE1 | P36T-E | Human | Esophagus | ESCC | 6.34e-05 | 1.50e+00 | 0.1187 |
| Page: 1 2 3 4 5 |
| Tissue | Expression Dynamics | Abbreviation |
| Endometrium | 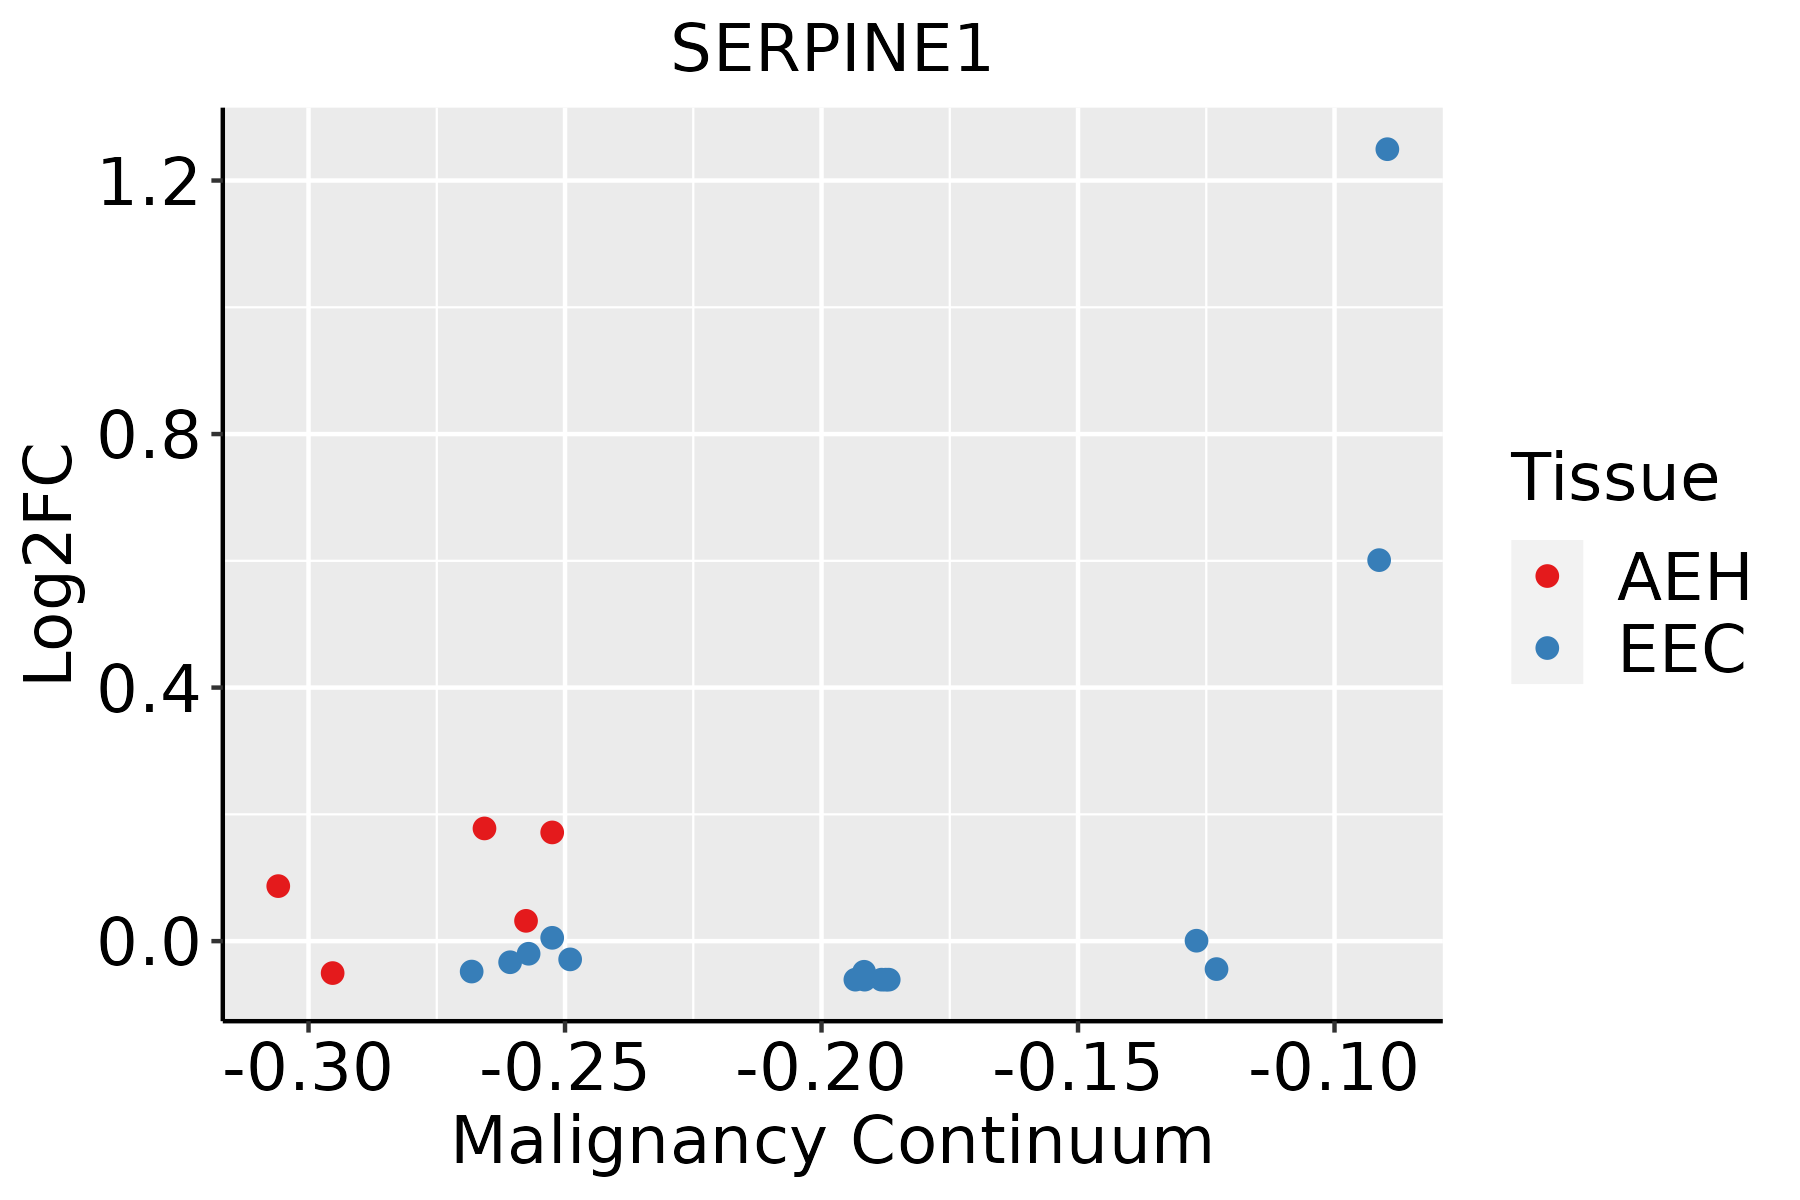 | AEH: Atypical endometrial hyperplasia |
| EEC: Endometrioid Cancer | ||
| Esophagus | 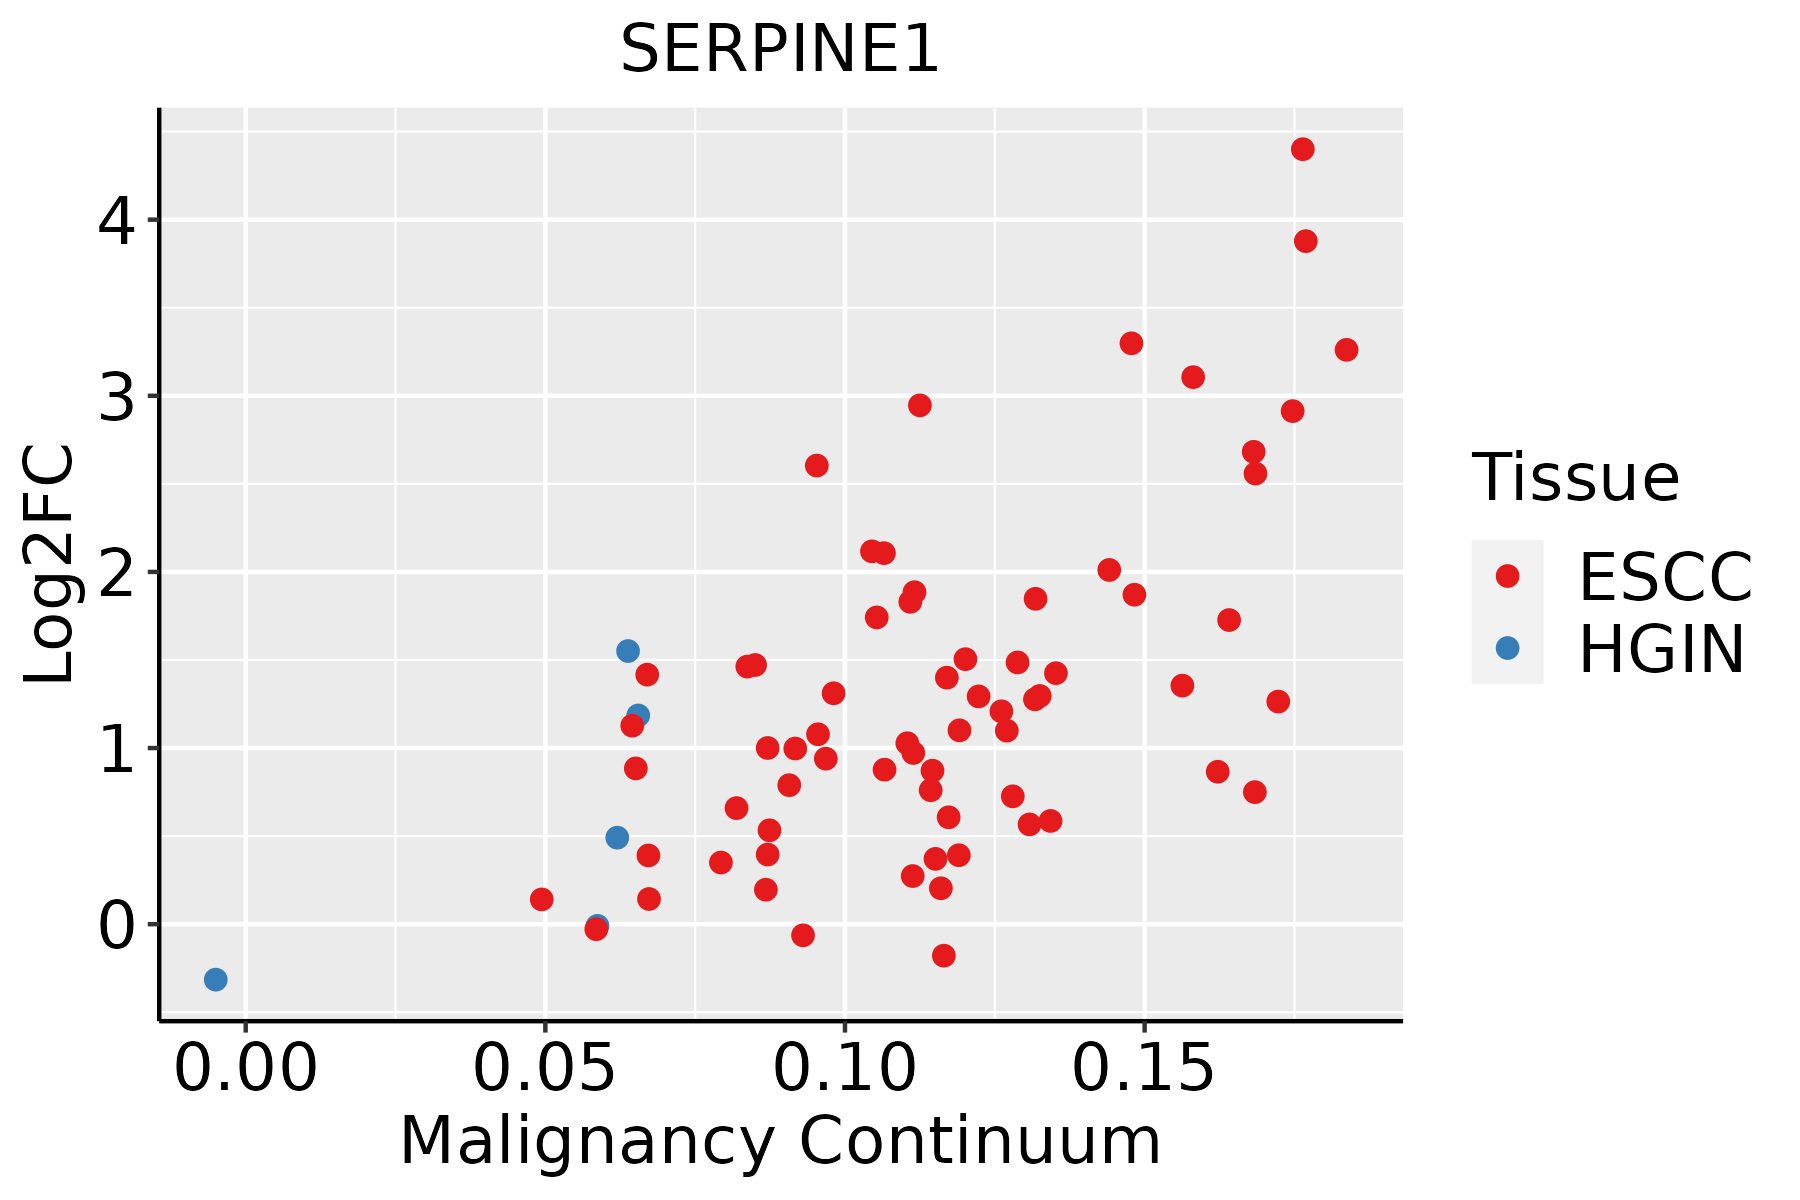 | ESCC: Esophageal squamous cell carcinoma |
| HGIN: High-grade intraepithelial neoplasias | ||
| LGIN: Low-grade intraepithelial neoplasias | ||
| Liver |  | HCC: Hepatocellular carcinoma |
| NAFLD: Non-alcoholic fatty liver disease | ||
| Oral Cavity | 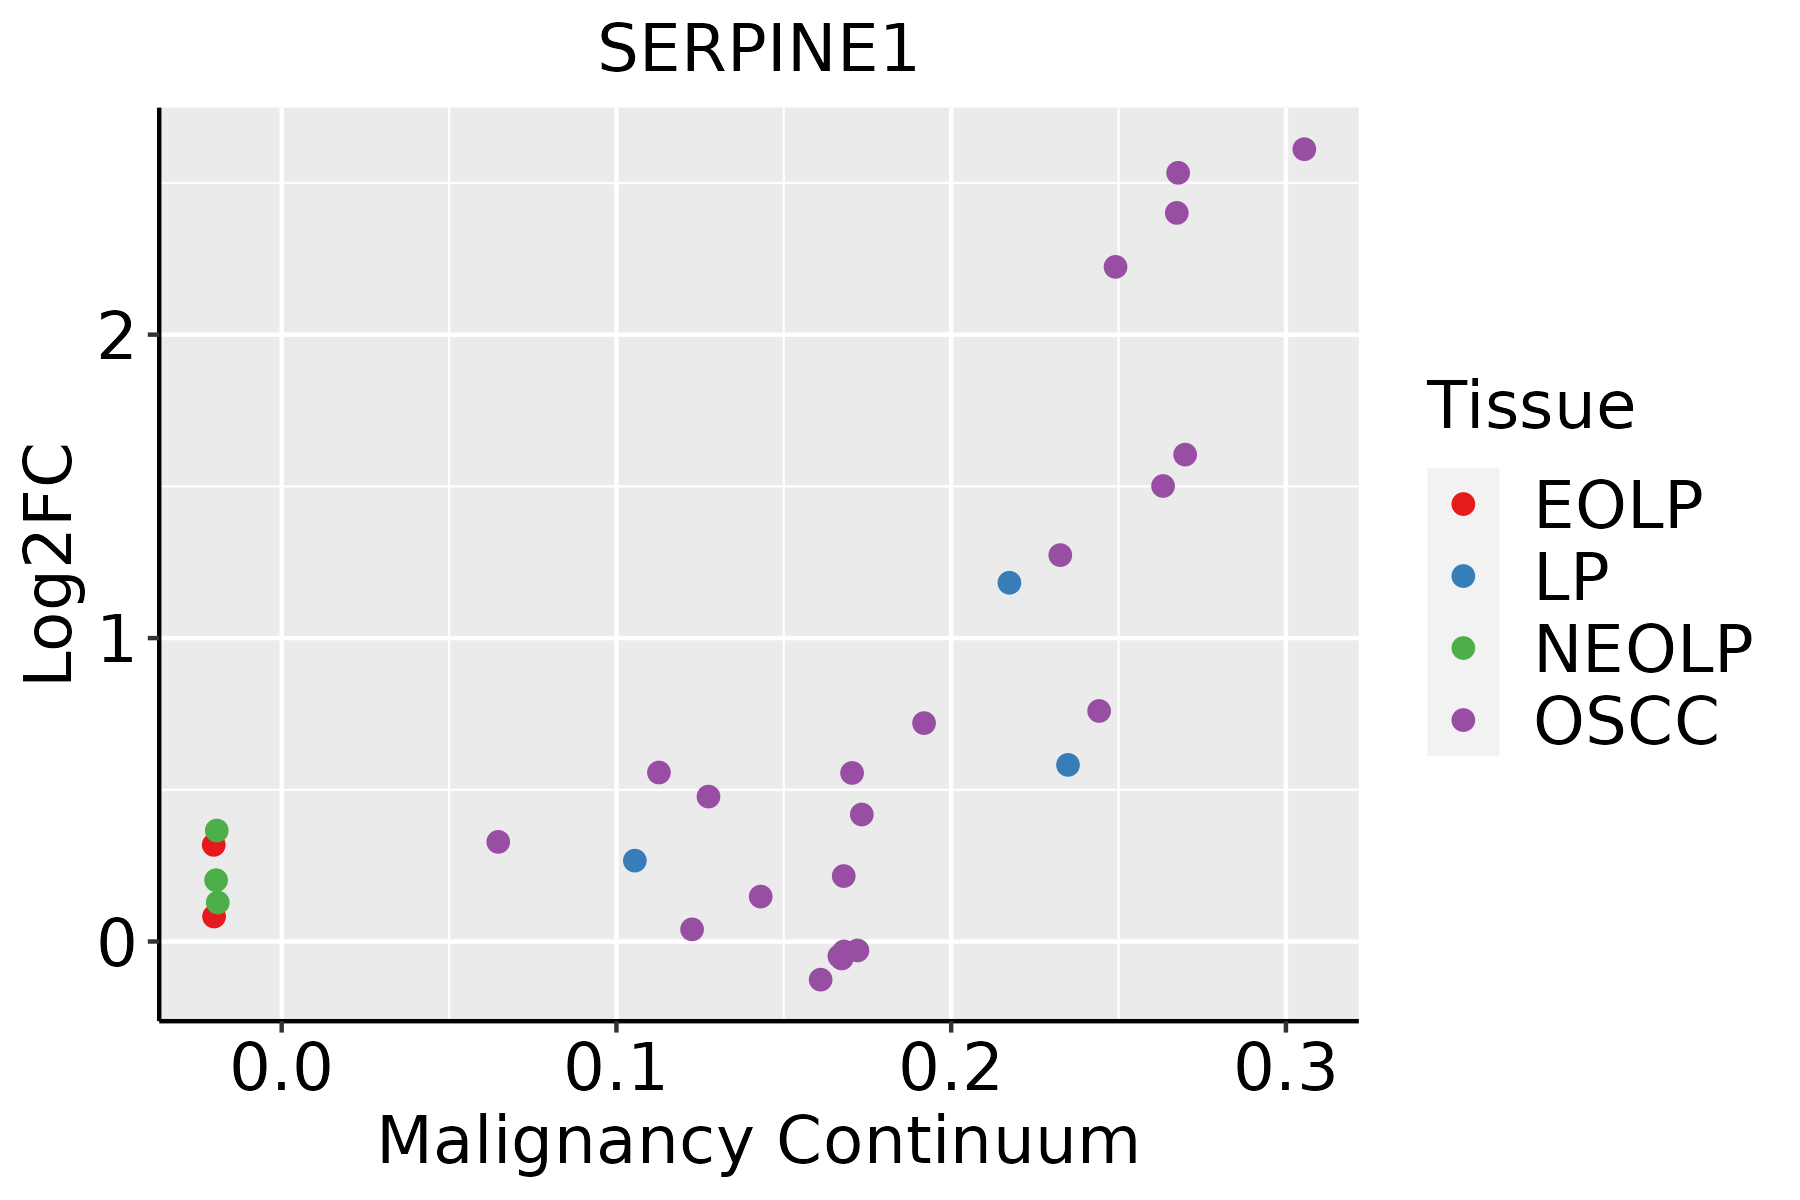 | EOLP: Erosive Oral lichen planus |
| LP: leukoplakia | ||
| NEOLP: Non-erosive oral lichen planus | ||
| OSCC: Oral squamous cell carcinoma | ||
| Skin |  | AK: Actinic keratosis |
| cSCC: Cutaneous squamous cell carcinoma | ||
| SCCIS:squamous cell carcinoma in situ | ||
| Thyroid | 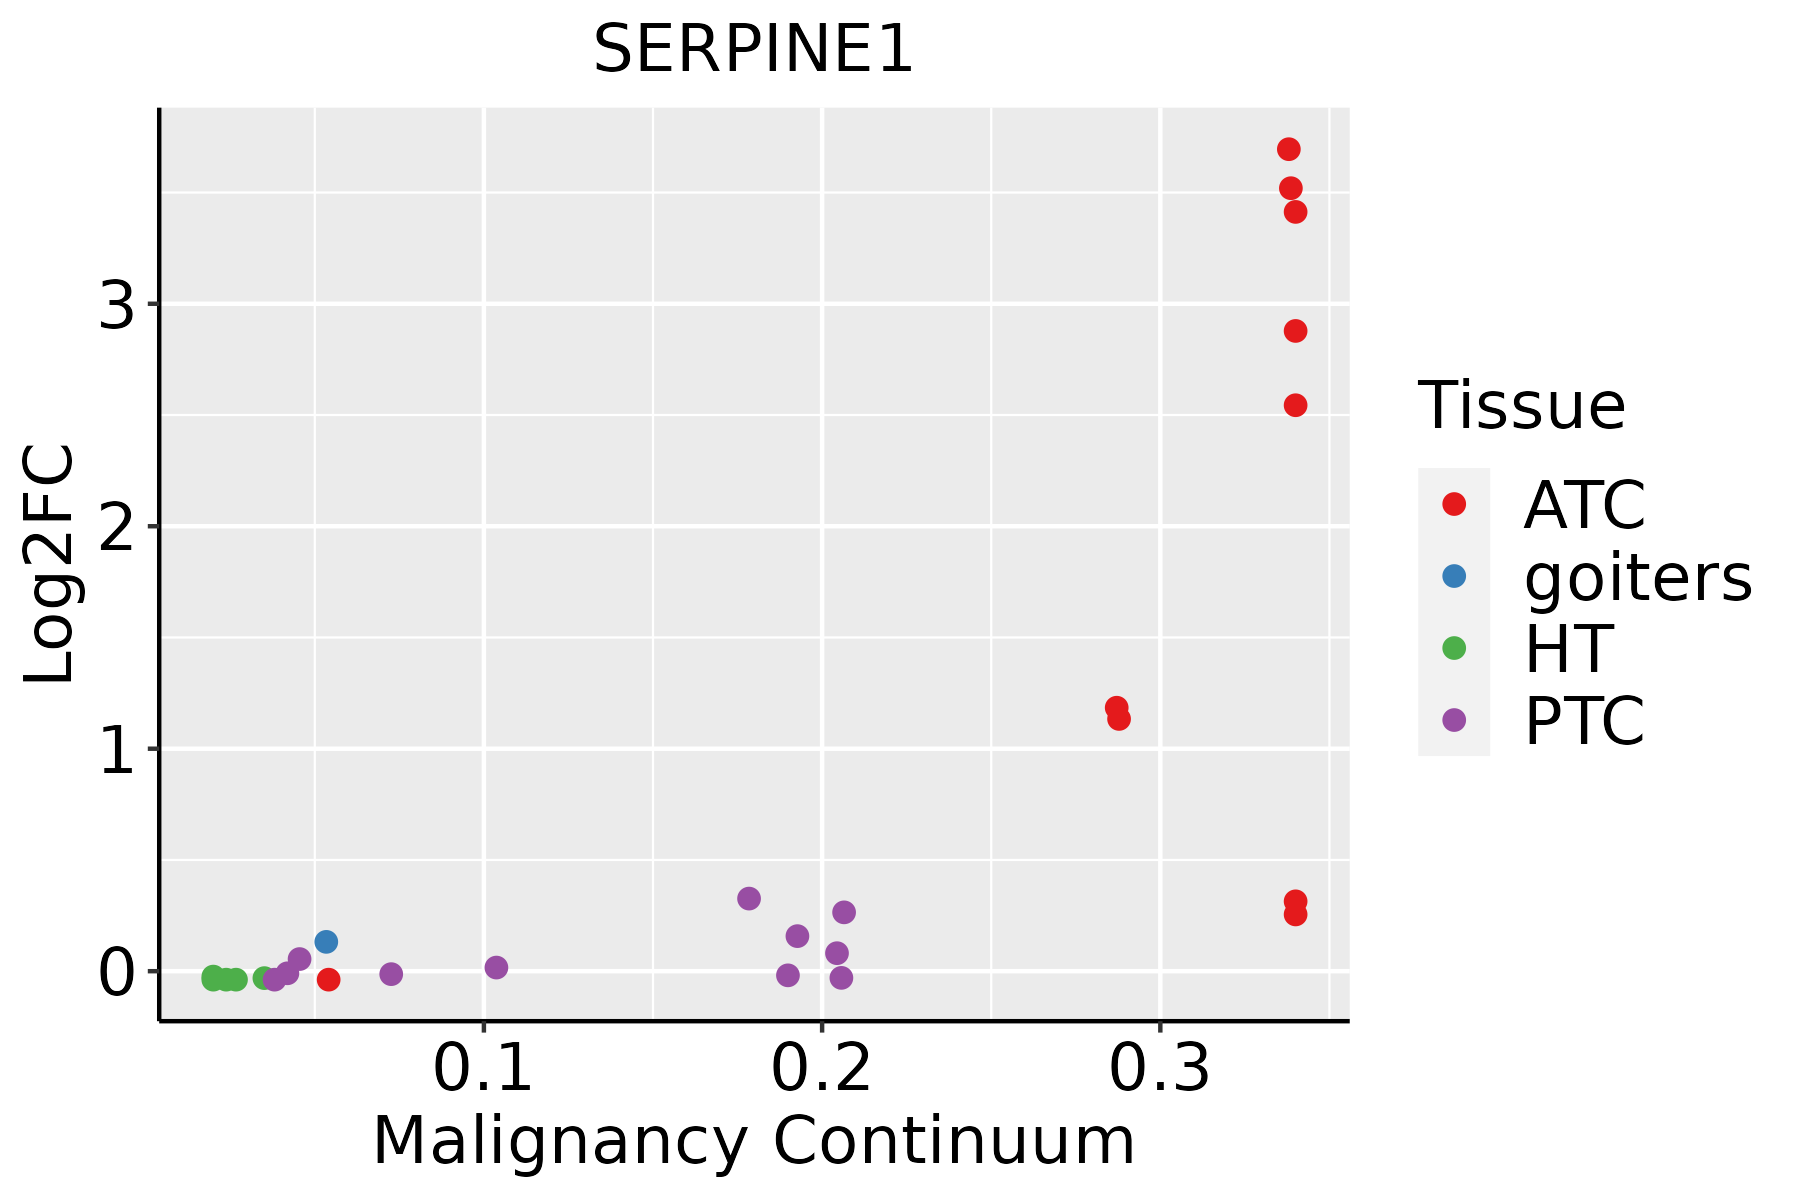 | ATC: Anaplastic thyroid cancer |
| HT: Hashimoto's thyroiditis | ||
| PTC: Papillary thyroid cancer |
| ∗log2FC in expression of this searched gene in stem-like cells from each diseased tissue sample relative to stem-like cells in normal samples in each tissue plotted against the malignancy continuum. Samples are colored based on if they are from different disease stage. |
Top |
Malignant transformation related pathway analysis |
| Find out the enriched GO biological processes and KEGG pathways involved in transition from healthy to precancer to cancer |
| Tissue | Disease Stage | Enriched GO biological Processes |
| Colorectum | AD |  |
| Colorectum | SER |  |
| Colorectum | MSS |  |
| Colorectum | MSI-H |  |
| Colorectum | FAP |  |
| ∗Top 15 enriched GO BP terms are showed in the bar plot of each disease state in each tissue. Each row represents a significant GO biological process which is colored according to the -log10(p.adjust). |
| Page: 1 2 3 4 5 6 7 8 9 |
| GO ID | Tissue | Disease Stage | Description | Gene Ratio | Bg Ratio | pvalue | p.adjust | Count |
| GO:200123317 | Endometrium | EEC | regulation of apoptotic signaling pathway | 91/2168 | 356/18723 | 1.31e-13 | 3.28e-11 | 91 |
| GO:001081016 | Endometrium | EEC | regulation of cell-substrate adhesion | 63/2168 | 221/18723 | 5.17e-12 | 8.85e-10 | 63 |
| GO:003158915 | Endometrium | EEC | cell-substrate adhesion | 87/2168 | 363/18723 | 1.95e-11 | 3.00e-09 | 87 |
| GO:004206017 | Endometrium | EEC | wound healing | 92/2168 | 422/18723 | 1.12e-09 | 9.58e-08 | 92 |
| GO:000195213 | Endometrium | EEC | regulation of cell-matrix adhesion | 37/2168 | 128/18723 | 8.21e-08 | 4.23e-06 | 37 |
| GO:005254717 | Endometrium | EEC | regulation of peptidase activity | 91/2168 | 461/18723 | 2.00e-07 | 8.93e-06 | 91 |
| GO:200123417 | Endometrium | EEC | negative regulation of apoptotic signaling pathway | 53/2168 | 224/18723 | 2.53e-07 | 1.09e-05 | 53 |
| GO:009719117 | Endometrium | EEC | extrinsic apoptotic signaling pathway | 52/2168 | 219/18723 | 2.91e-07 | 1.20e-05 | 52 |
| GO:200123617 | Endometrium | EEC | regulation of extrinsic apoptotic signaling pathway | 40/2168 | 151/18723 | 3.33e-07 | 1.33e-05 | 40 |
| GO:000716014 | Endometrium | EEC | cell-matrix adhesion | 54/2168 | 233/18723 | 3.98e-07 | 1.56e-05 | 54 |
| GO:004586117 | Endometrium | EEC | negative regulation of proteolysis | 72/2168 | 351/18723 | 8.46e-07 | 2.98e-05 | 72 |
| GO:005254817 | Endometrium | EEC | regulation of endopeptidase activity | 82/2168 | 432/18723 | 3.96e-06 | 1.04e-04 | 82 |
| GO:200014613 | Endometrium | EEC | negative regulation of cell motility | 71/2168 | 359/18723 | 3.98e-06 | 1.04e-04 | 71 |
| GO:005127113 | Endometrium | EEC | negative regulation of cellular component movement | 72/2168 | 367/18723 | 4.59e-06 | 1.15e-04 | 72 |
| GO:003033612 | Endometrium | EEC | negative regulation of cell migration | 67/2168 | 344/18723 | 1.24e-05 | 2.54e-04 | 67 |
| GO:004001312 | Endometrium | EEC | negative regulation of locomotion | 74/2168 | 391/18723 | 1.28e-05 | 2.59e-04 | 74 |
| GO:000756815 | Endometrium | EEC | aging | 66/2168 | 339/18723 | 1.46e-05 | 2.87e-04 | 66 |
| GO:005134615 | Endometrium | EEC | negative regulation of hydrolase activity | 72/2168 | 379/18723 | 1.46e-05 | 2.87e-04 | 72 |
| GO:000689815 | Endometrium | EEC | receptor-mediated endocytosis | 51/2168 | 244/18723 | 1.89e-05 | 3.50e-04 | 51 |
| GO:003010014 | Endometrium | EEC | regulation of endocytosis | 45/2168 | 211/18723 | 3.40e-05 | 5.78e-04 | 45 |
| Page: 1 2 3 4 5 6 7 8 9 10 11 12 13 14 15 16 17 18 19 20 21 22 23 24 25 26 27 28 29 30 31 32 33 |
| Pathway ID | Tissue | Disease Stage | Description | Gene Ratio | Bg Ratio | pvalue | p.adjust | qvalue | Count |
| hsa0411524 | Esophagus | ESCC | p53 signaling pathway | 65/4205 | 74/8465 | 3.88e-12 | 6.50e-11 | 3.33e-11 | 65 |
| hsa0421829 | Esophagus | ESCC | Cellular senescence | 119/4205 | 156/8465 | 5.89e-12 | 9.40e-11 | 4.81e-11 | 119 |
| hsa0493310 | Esophagus | ESCC | AGE-RAGE signaling pathway in diabetic complications | 72/4205 | 100/8465 | 4.15e-06 | 2.28e-05 | 1.17e-05 | 72 |
| hsa0406629 | Esophagus | ESCC | HIF-1 signaling pathway | 75/4205 | 109/8465 | 3.66e-05 | 1.68e-04 | 8.60e-05 | 75 |
| hsa051425 | Esophagus | ESCC | Chagas disease | 65/4205 | 102/8465 | 2.81e-03 | 7.59e-03 | 3.89e-03 | 65 |
| hsa0439018 | Esophagus | ESCC | Hippo signaling pathway | 92/4205 | 157/8465 | 1.46e-02 | 3.31e-02 | 1.69e-02 | 92 |
| hsa0411534 | Esophagus | ESCC | p53 signaling pathway | 65/4205 | 74/8465 | 3.88e-12 | 6.50e-11 | 3.33e-11 | 65 |
| hsa0421838 | Esophagus | ESCC | Cellular senescence | 119/4205 | 156/8465 | 5.89e-12 | 9.40e-11 | 4.81e-11 | 119 |
| hsa0493317 | Esophagus | ESCC | AGE-RAGE signaling pathway in diabetic complications | 72/4205 | 100/8465 | 4.15e-06 | 2.28e-05 | 1.17e-05 | 72 |
| hsa04066113 | Esophagus | ESCC | HIF-1 signaling pathway | 75/4205 | 109/8465 | 3.66e-05 | 1.68e-04 | 8.60e-05 | 75 |
| hsa0514213 | Esophagus | ESCC | Chagas disease | 65/4205 | 102/8465 | 2.81e-03 | 7.59e-03 | 3.89e-03 | 65 |
| hsa0439019 | Esophagus | ESCC | Hippo signaling pathway | 92/4205 | 157/8465 | 1.46e-02 | 3.31e-02 | 1.69e-02 | 92 |
| hsa04610 | Liver | NAFLD | Complement and coagulation cascades | 35/1043 | 86/8465 | 2.48e-11 | 2.04e-09 | 1.64e-09 | 35 |
| hsa046101 | Liver | NAFLD | Complement and coagulation cascades | 35/1043 | 86/8465 | 2.48e-11 | 2.04e-09 | 1.64e-09 | 35 |
| hsa046102 | Liver | Cirrhotic | Complement and coagulation cascades | 48/2530 | 86/8465 | 4.41e-07 | 5.44e-06 | 3.35e-06 | 48 |
| hsa042187 | Liver | Cirrhotic | Cellular senescence | 66/2530 | 156/8465 | 5.94e-04 | 3.60e-03 | 2.22e-03 | 66 |
| hsa0406612 | Liver | Cirrhotic | HIF-1 signaling pathway | 46/2530 | 109/8465 | 4.00e-03 | 1.59e-02 | 9.78e-03 | 46 |
| hsa046103 | Liver | Cirrhotic | Complement and coagulation cascades | 48/2530 | 86/8465 | 4.41e-07 | 5.44e-06 | 3.35e-06 | 48 |
| hsa0421812 | Liver | Cirrhotic | Cellular senescence | 66/2530 | 156/8465 | 5.94e-04 | 3.60e-03 | 2.22e-03 | 66 |
| hsa0406613 | Liver | Cirrhotic | HIF-1 signaling pathway | 46/2530 | 109/8465 | 4.00e-03 | 1.59e-02 | 9.78e-03 | 46 |
| Page: 1 2 3 |
Top |
Cell-cell communication analysis |
| Identification of potential cell-cell interactions between two cell types and their ligand-receptor pairs for different disease states |
| Ligand | Receptor | LRpair | Pathway | Tissue | Disease Stage |
| Page: 1 |
Top |
Single-cell gene regulatory network inference analysis |
| Find out the significant the regulons (TFs) and the target genes of each regulon across cell types for different disease states |
| TF | Cell Type | Tissue | Disease Stage | Target Gene | RSS | Regulon Activity |
| ∗The dot plots of a searched regulon are shown for all cell subpopulations in each disease state of each tissue based on the regulon specific score inferred using pySCENIC and by calculating the average expression. |
| Page: 1 |
Top |
Somatic mutation of malignant transformation related genes |
| Annotation of somatic variants for genes involved in malignant transformation |
| Hugo Symbol | Variant Class | Variant Classification | dbSNP RS | HGVSc | HGVSp | HGVSp Short | SWISSPROT | BIOTYPE | SIFT | PolyPhen | Tumor Sample Barcode | Tissue | Histology | Sex | Age | Stage | Therapy Types | Drugs | Outcome |
| SERPINE1 | SNV | Missense_Mutation | c.407N>C | p.Phe136Ser | p.F136S | P05121 | protein_coding | deleterious(0.05) | probably_damaging(1) | TCGA-A8-A08F-01 | Breast | breast invasive carcinoma | Female | <65 | III/IV | Chemotherapy | 5-fluorouracil | CR | |
| SERPINE1 | SNV | Missense_Mutation | c.748C>G | p.Pro250Ala | p.P250A | P05121 | protein_coding | deleterious(0) | probably_damaging(0.999) | TCGA-AR-A256-01 | Breast | breast invasive carcinoma | Female | <65 | I/II | Chemotherapy | doxorubicin | PD | |
| SERPINE1 | SNV | Missense_Mutation | c.785C>T | p.Ala262Val | p.A262V | P05121 | protein_coding | tolerated(0.31) | probably_damaging(0.944) | TCGA-BH-A0HF-01 | Breast | breast invasive carcinoma | Female | >=65 | I/II | Hormone Therapy | arimidex | SD | |
| SERPINE1 | insertion | Frame_Shift_Ins | novel | c.292_293insA | p.Leu98HisfsTer16 | p.L98Hfs*16 | P05121 | protein_coding | TCGA-C8-A26Y-01 | Breast | breast invasive carcinoma | Female | >=65 | I/II | Unknown | Unknown | SD | ||
| SERPINE1 | SNV | Missense_Mutation | novel | c.85N>C | p.Ser29Pro | p.S29P | P05121 | protein_coding | tolerated(0.22) | benign(0.001) | TCGA-VS-A9UJ-01 | Cervix | cervical & endocervical cancer | Female | <65 | I/II | Unknown | Unknown | PD |
| SERPINE1 | SNV | Missense_Mutation | c.283N>A | p.Ala95Thr | p.A95T | P05121 | protein_coding | deleterious(0.04) | benign(0.36) | TCGA-A6-5661-01 | Colorectum | colon adenocarcinoma | Female | >=65 | I/II | Unknown | Unknown | SD | |
| SERPINE1 | SNV | Missense_Mutation | rs138483939 | c.1028C>T | p.Ala343Val | p.A343V | P05121 | protein_coding | tolerated(1) | benign(0.405) | TCGA-AA-3492-01 | Colorectum | colon adenocarcinoma | Female | >=65 | I/II | Unknown | Unknown | SD |
| SERPINE1 | SNV | Missense_Mutation | novel | c.672G>A | p.Met224Ile | p.M224I | P05121 | protein_coding | deleterious(0) | probably_damaging(0.996) | TCGA-AA-3872-01 | Colorectum | colon adenocarcinoma | Male | <65 | III/IV | Unknown | Unknown | SD |
| SERPINE1 | SNV | Missense_Mutation | rs760569885 | c.1018N>A | p.Val340Ile | p.V340I | P05121 | protein_coding | deleterious(0.04) | possibly_damaging(0.528) | TCGA-AD-6895-01 | Colorectum | colon adenocarcinoma | Male | >=65 | III/IV | Unknown | Unknown | SD |
| SERPINE1 | SNV | Missense_Mutation | rs774647903 | c.1057N>A | p.Glu353Lys | p.E353K | P05121 | protein_coding | deleterious(0.01) | probably_damaging(1) | TCGA-AM-5821-01 | Colorectum | colon adenocarcinoma | Female | >=65 | I/II | Unknown | Unknown | SD |
| Page: 1 2 3 4 5 6 |
Top |
Related drugs of malignant transformation related genes |
| Identification of chemicals and drugs interact with genes involved in malignant transfromation |
| (DGIdb 4.0) |
| Entrez ID | Symbol | Category | Interaction Types | Drug Claim Name | Drug Name | PMIDs |
| 5054 | SERPINE1 | DRUGGABLE GENOME, PROTEASE INHIBITOR | 9-CIS RETINOIC ACID | 9869165 | ||
| 5054 | SERPINE1 | DRUGGABLE GENOME, PROTEASE INHIBITOR | 5-BROMODEOXYURIDINE | 2537681 | ||
| 5054 | SERPINE1 | DRUGGABLE GENOME, PROTEASE INHIBITOR | DEFIBROTIDE | DEFIBROTIDE | 12745658 | |
| 5054 | SERPINE1 | DRUGGABLE GENOME, PROTEASE INHIBITOR | RETINOID | 8498603 | ||
| 5054 | SERPINE1 | DRUGGABLE GENOME, PROTEASE INHIBITOR | LEVOTHYROXINE | LEVOTHYROXINE | 16075920 | |
| 5054 | SERPINE1 | DRUGGABLE GENOME, PROTEASE INHIBITOR | citalopram | CITALOPRAM | 18794724 | |
| 5054 | SERPINE1 | DRUGGABLE GENOME, PROTEASE INHIBITOR | CETRORELIX | CETRORELIX | 16391860 | |
| 5054 | SERPINE1 | DRUGGABLE GENOME, PROTEASE INHIBITOR | UROKINASE | UROKINASE | ||
| 5054 | SERPINE1 | DRUGGABLE GENOME, PROTEASE INHIBITOR | NORETHISTERONE ACETATE | 12385861 | ||
| 5054 | SERPINE1 | DRUGGABLE GENOME, PROTEASE INHIBITOR | inhibitor | CHEMBL325424 | ALEPLASININ |
| Page: 1 2 3 4 |

Copyright 2023-Present -The University of Texas Health Science Center at Houston |