
|
|||||
|
 | |
| |
| |
| |
| |
| |
|
Gene: SERPIND1 |
Gene summary for SERPIND1 |
| Gene information | Species | Human | Gene symbol | SERPIND1 | Gene ID | 3053 |
| Gene name | serpin family D member 1 | |
| Gene Alias | D22S673 | |
| Cytomap | 22q11.21 | |
| Gene Type | protein-coding | GO ID | GO:0006508 | UniProtAcc | P05546 |
Top |
Malignant transformation analysis |
| Identification of the aberrant gene expression in precancerous and cancerous lesions by comparing the gene expression of stem-like cells in diseased tissues with normal stem cells |
| Entrez ID | Symbol | Replicates | Species | Organ | Tissue | Adj P-value | Log2FC | Malignancy |
| 3053 | SERPIND1 | HCC1_Meng | Human | Liver | HCC | 2.03e-82 | 5.30e-01 | 0.0246 |
| 3053 | SERPIND1 | HCC1 | Human | Liver | HCC | 2.46e-51 | 7.64e+00 | 0.5336 |
| 3053 | SERPIND1 | HCC2 | Human | Liver | HCC | 2.55e-43 | 4.89e+00 | 0.5341 |
| 3053 | SERPIND1 | HCC5 | Human | Liver | HCC | 1.23e-02 | 3.09e+00 | 0.4932 |
| 3053 | SERPIND1 | Pt13.b | Human | Liver | HCC | 6.46e-10 | 1.46e-01 | 0.0251 |
| 3053 | SERPIND1 | Pt14.a | Human | Liver | HCC | 9.40e-13 | 6.00e-01 | 0.0169 |
| 3053 | SERPIND1 | Pt14.b | Human | Liver | HCC | 1.00e-02 | 2.01e-01 | 0.018 |
| 3053 | SERPIND1 | Pt14.d | Human | Liver | HCC | 4.28e-04 | 3.09e-01 | 0.0143 |
| 3053 | SERPIND1 | S014 | Human | Liver | HCC | 4.63e-43 | 2.49e+00 | 0.2254 |
| 3053 | SERPIND1 | S015 | Human | Liver | HCC | 1.30e-41 | 3.02e+00 | 0.2375 |
| 3053 | SERPIND1 | S016 | Human | Liver | HCC | 4.15e-56 | 2.36e+00 | 0.2243 |
| 3053 | SERPIND1 | S028 | Human | Liver | HCC | 1.23e-04 | 4.30e-01 | 0.2503 |
| 3053 | SERPIND1 | S029 | Human | Liver | HCC | 2.60e-07 | 7.25e-01 | 0.2581 |
| Page: 1 |
| Tissue | Expression Dynamics | Abbreviation |
| Liver | 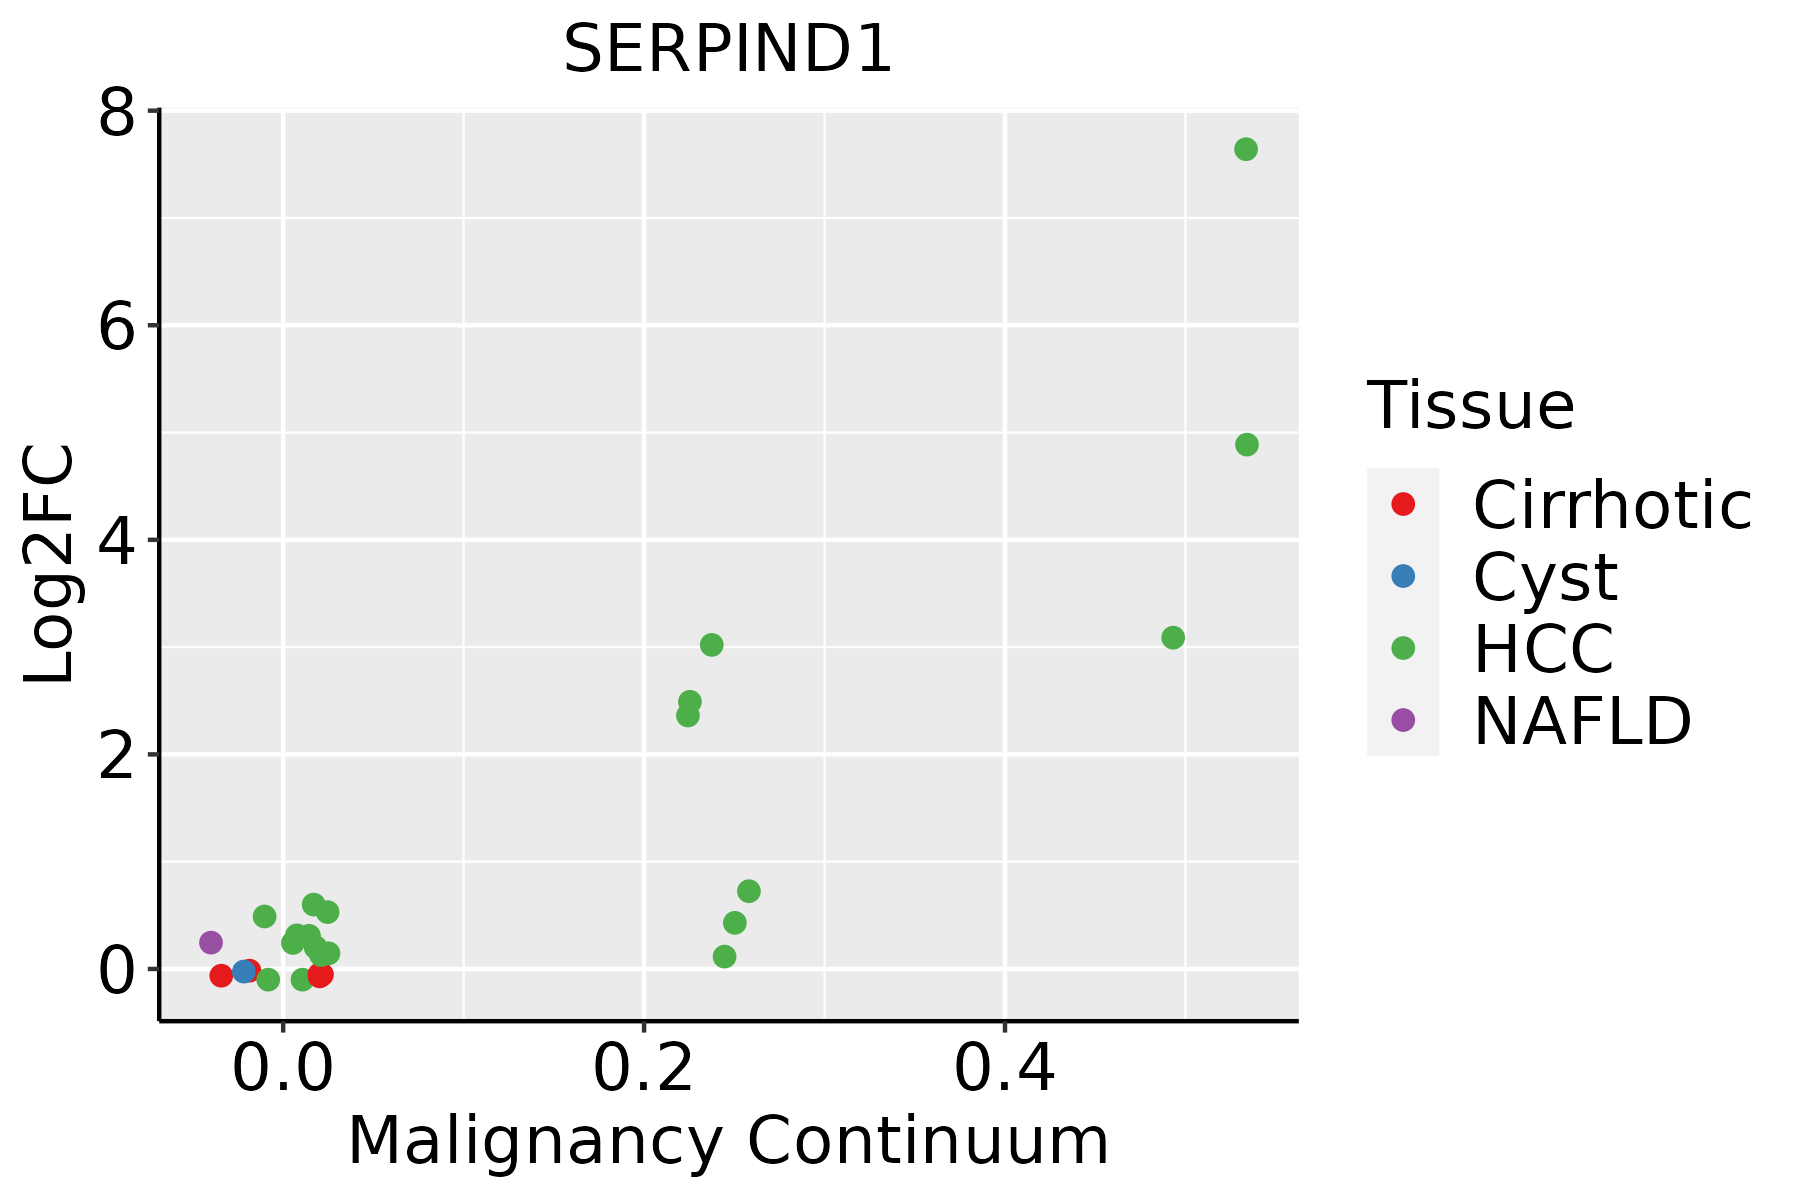 | HCC: Hepatocellular carcinoma |
| NAFLD: Non-alcoholic fatty liver disease |
| ∗log2FC in expression of this searched gene in stem-like cells from each diseased tissue sample relative to stem-like cells in normal samples in each tissue plotted against the malignancy continuum. Samples are colored based on if they are from different disease stage. |
Top |
Malignant transformation related pathway analysis |
| Find out the enriched GO biological processes and KEGG pathways involved in transition from healthy to precancer to cancer |
| Tissue | Disease Stage | Enriched GO biological Processes |
| Colorectum | AD |  |
| Colorectum | SER |  |
| Colorectum | MSS |  |
| Colorectum | MSI-H |  |
| Colorectum | FAP |  |
| ∗Top 15 enriched GO BP terms are showed in the bar plot of each disease state in each tissue. Each row represents a significant GO biological process which is colored according to the -log10(p.adjust). |
| Page: 1 2 3 4 5 6 7 8 9 |
| GO ID | Tissue | Disease Stage | Description | Gene Ratio | Bg Ratio | pvalue | p.adjust | Count |
| GO:005254722 | Liver | HCC | regulation of peptidase activity | 247/7958 | 461/18723 | 8.28e-07 | 1.27e-05 | 247 |
| GO:005254822 | Liver | HCC | regulation of endopeptidase activity | 230/7958 | 432/18723 | 3.58e-06 | 4.68e-05 | 230 |
| GO:004586122 | Liver | HCC | negative regulation of proteolysis | 186/7958 | 351/18723 | 4.19e-05 | 4.11e-04 | 186 |
| GO:004206022 | Liver | HCC | wound healing | 219/7958 | 422/18723 | 5.34e-05 | 5.04e-04 | 219 |
| GO:005134622 | Liver | HCC | negative regulation of hydrolase activity | 195/7958 | 379/18723 | 2.44e-04 | 1.82e-03 | 195 |
| GO:00075962 | Liver | HCC | blood coagulation | 118/7958 | 217/18723 | 2.63e-04 | 1.94e-03 | 118 |
| GO:00075992 | Liver | HCC | hemostasis | 119/7958 | 222/18723 | 5.25e-04 | 3.41e-03 | 119 |
| GO:00508172 | Liver | HCC | coagulation | 118/7958 | 222/18723 | 8.41e-04 | 5.03e-03 | 118 |
| GO:005087822 | Liver | HCC | regulation of body fluid levels | 191/7958 | 379/18723 | 1.06e-03 | 6.11e-03 | 191 |
| GO:001095121 | Liver | HCC | negative regulation of endopeptidase activity | 129/7958 | 252/18723 | 3.17e-03 | 1.47e-02 | 129 |
| GO:001046621 | Liver | HCC | negative regulation of peptidase activity | 132/7958 | 262/18723 | 5.82e-03 | 2.42e-02 | 132 |
| Page: 1 |
| Pathway ID | Tissue | Disease Stage | Description | Gene Ratio | Bg Ratio | pvalue | p.adjust | qvalue | Count |
| hsa046104 | Liver | HCC | Complement and coagulation cascades | 57/4020 | 86/8465 | 3.19e-04 | 1.45e-03 | 8.04e-04 | 57 |
| hsa046105 | Liver | HCC | Complement and coagulation cascades | 57/4020 | 86/8465 | 3.19e-04 | 1.45e-03 | 8.04e-04 | 57 |
| Page: 1 |
Top |
Cell-cell communication analysis |
| Identification of potential cell-cell interactions between two cell types and their ligand-receptor pairs for different disease states |
| Ligand | Receptor | LRpair | Pathway | Tissue | Disease Stage |
| Page: 1 |
Top |
Single-cell gene regulatory network inference analysis |
| Find out the significant the regulons (TFs) and the target genes of each regulon across cell types for different disease states |
| TF | Cell Type | Tissue | Disease Stage | Target Gene | RSS | Regulon Activity |
| ∗The dot plots of a searched regulon are shown for all cell subpopulations in each disease state of each tissue based on the regulon specific score inferred using pySCENIC and by calculating the average expression. |
| Page: 1 |
Top |
Somatic mutation of malignant transformation related genes |
| Annotation of somatic variants for genes involved in malignant transformation |
| Hugo Symbol | Variant Class | Variant Classification | dbSNP RS | HGVSc | HGVSp | HGVSp Short | SWISSPROT | BIOTYPE | SIFT | PolyPhen | Tumor Sample Barcode | Tissue | Histology | Sex | Age | Stage | Therapy Types | Drugs | Outcome |
| SERPIND1 | SNV | Missense_Mutation | rs778720255 | c.1124N>G | p.Pro375Arg | p.P375R | P05546 | protein_coding | tolerated(0.08) | probably_damaging(0.913) | TCGA-B6-A0WV-01 | Breast | breast invasive carcinoma | Female | >=65 | I/II | Unknown | Unknown | SD |
| SERPIND1 | SNV | Missense_Mutation | rs142451096 | c.1339G>A | p.Glu447Lys | p.E447K | P05546 | protein_coding | deleterious(0) | probably_damaging(1) | TCGA-C8-A8HP-01 | Breast | breast invasive carcinoma | Female | <65 | III/IV | Chemotherapy | 5-fluorouracil | CR |
| SERPIND1 | insertion | Frame_Shift_Ins | novel | c.1163_1163+1insTGAGACCTGGTCTCAAAAACCAAATAATAATAACAGTAATAAAA | p.Arg388SerfsTer33 | p.R388Sfs*33 | P05546 | protein_coding | TCGA-A2-A0CX-01 | Breast | breast invasive carcinoma | Female | <65 | I/II | Chemotherapy | adriamycin | SD | ||
| SERPIND1 | SNV | Missense_Mutation | c.1475N>A | p.Arg492Lys | p.R492K | P05546 | protein_coding | tolerated(0.06) | possibly_damaging(0.883) | TCGA-IR-A3LI-01 | Cervix | cervical & endocervical cancer | Female | <65 | I/II | Chemotherapy | cisplatin | CR | |
| SERPIND1 | SNV | Missense_Mutation | c.514N>C | p.Glu172Gln | p.E172Q | P05546 | protein_coding | tolerated(0.52) | benign(0.012) | TCGA-UC-A7PF-01 | Cervix | cervical & endocervical cancer | Female | <65 | I/II | Unknown | Unknown | SD | |
| SERPIND1 | SNV | Missense_Mutation | c.1189T>A | p.Phe397Ile | p.F397I | P05546 | protein_coding | deleterious(0) | probably_damaging(0.999) | TCGA-A6-5656-01 | Colorectum | colon adenocarcinoma | Male | >=65 | I/II | Unknown | Unknown | SD | |
| SERPIND1 | SNV | Missense_Mutation | c.364C>T | p.Arg122Trp | p.R122W | P05546 | protein_coding | deleterious(0) | probably_damaging(0.988) | TCGA-AY-6197-01 | Colorectum | colon adenocarcinoma | Male | <65 | I/II | Unknown | Unknown | SD | |
| SERPIND1 | SNV | Missense_Mutation | novel | c.905N>C | p.Lys302Thr | p.K302T | P05546 | protein_coding | deleterious(0.01) | possibly_damaging(0.84) | TCGA-CA-6717-01 | Colorectum | colon adenocarcinoma | Male | <65 | I/II | Chemotherapy | oxaliplatin | CR |
| SERPIND1 | SNV | Missense_Mutation | c.275A>G | p.Tyr92Cys | p.Y92C | P05546 | protein_coding | tolerated(0.15) | probably_damaging(0.99) | TCGA-CK-5916-01 | Colorectum | colon adenocarcinoma | Female | >=65 | I/II | Unknown | Unknown | PD | |
| SERPIND1 | SNV | Missense_Mutation | c.311C>G | p.Thr104Arg | p.T104R | P05546 | protein_coding | tolerated(0.33) | benign(0.075) | TCGA-D5-6924-01 | Colorectum | colon adenocarcinoma | Male | >=65 | I/II | Unknown | Unknown | SD |
| Page: 1 2 3 4 5 6 |
Top |
Related drugs of malignant transformation related genes |
| Identification of chemicals and drugs interact with genes involved in malignant transfromation |
| (DGIdb 4.0) |
| Entrez ID | Symbol | Category | Interaction Types | Drug Claim Name | Drug Name | PMIDs |
| 3053 | SERPIND1 | DRUGGABLE GENOME, PROTEASE INHIBITOR | ARDEPARIN | |||
| 3053 | SERPIND1 | DRUGGABLE GENOME, PROTEASE INHIBITOR | ARDEPARIN | |||
| 3053 | SERPIND1 | DRUGGABLE GENOME, PROTEASE INHIBITOR | SULODEXIDE | SULODEXIDE | ||
| 3053 | SERPIND1 | DRUGGABLE GENOME, PROTEASE INHIBITOR | SULODEXIDE | SULODEXIDE |
| Page: 1 |

Copyright 2023-Present -The University of Texas Health Science Center at Houston |