
|
|||||
|
 | |
| |
| |
| |
| |
| |
|
Gene: SERPINB8 |
Gene summary for SERPINB8 |
| Gene information | Species | Human | Gene symbol | SERPINB8 | Gene ID | 5271 |
| Gene name | serpin family B member 8 | |
| Gene Alias | C18orf53 | |
| Cytomap | 18q22.1 | |
| Gene Type | protein-coding | GO ID | GO:0006508 | UniProtAcc | P50452 |
Top |
Malignant transformation analysis |
| Identification of the aberrant gene expression in precancerous and cancerous lesions by comparing the gene expression of stem-like cells in diseased tissues with normal stem cells |
| Entrez ID | Symbol | Replicates | Species | Organ | Tissue | Adj P-value | Log2FC | Malignancy |
| 5271 | SERPINB8 | C04 | Human | Oral cavity | OSCC | 4.92e-13 | 5.93e-01 | 0.2633 |
| 5271 | SERPINB8 | C21 | Human | Oral cavity | OSCC | 2.80e-16 | 4.98e-01 | 0.2678 |
| 5271 | SERPINB8 | C30 | Human | Oral cavity | OSCC | 3.47e-22 | 8.94e-01 | 0.3055 |
| 5271 | SERPINB8 | C38 | Human | Oral cavity | OSCC | 1.34e-03 | 5.00e-01 | 0.172 |
| 5271 | SERPINB8 | C43 | Human | Oral cavity | OSCC | 1.38e-04 | 1.50e-01 | 0.1704 |
| 5271 | SERPINB8 | C46 | Human | Oral cavity | OSCC | 2.34e-07 | 2.17e-01 | 0.1673 |
| 5271 | SERPINB8 | C57 | Human | Oral cavity | OSCC | 2.94e-09 | 3.63e-01 | 0.1679 |
| 5271 | SERPINB8 | C06 | Human | Oral cavity | OSCC | 1.32e-03 | 8.28e-01 | 0.2699 |
| 5271 | SERPINB8 | C07 | Human | Oral cavity | OSCC | 1.31e-02 | 6.61e-01 | 0.2491 |
| 5271 | SERPINB8 | C08 | Human | Oral cavity | OSCC | 5.07e-08 | 1.99e-01 | 0.1919 |
| 5271 | SERPINB8 | C09 | Human | Oral cavity | OSCC | 4.44e-04 | 2.13e-01 | 0.1431 |
| 5271 | SERPINB8 | LN46 | Human | Oral cavity | OSCC | 9.88e-04 | 2.85e-01 | 0.1666 |
| 5271 | SERPINB8 | LP15 | Human | Oral cavity | LP | 2.30e-02 | 4.32e-01 | 0.2174 |
| 5271 | SERPINB8 | SYSMH2 | Human | Oral cavity | OSCC | 5.04e-08 | 1.99e-01 | 0.2326 |
| 5271 | SERPINB8 | SYSMH3 | Human | Oral cavity | OSCC | 1.26e-11 | 2.86e-01 | 0.2442 |
| 5271 | SERPINB8 | SYSMH5 | Human | Oral cavity | OSCC | 1.12e-03 | 1.14e-01 | 0.0647 |
| Page: 1 |
| Tissue | Expression Dynamics | Abbreviation |
| Oral Cavity | 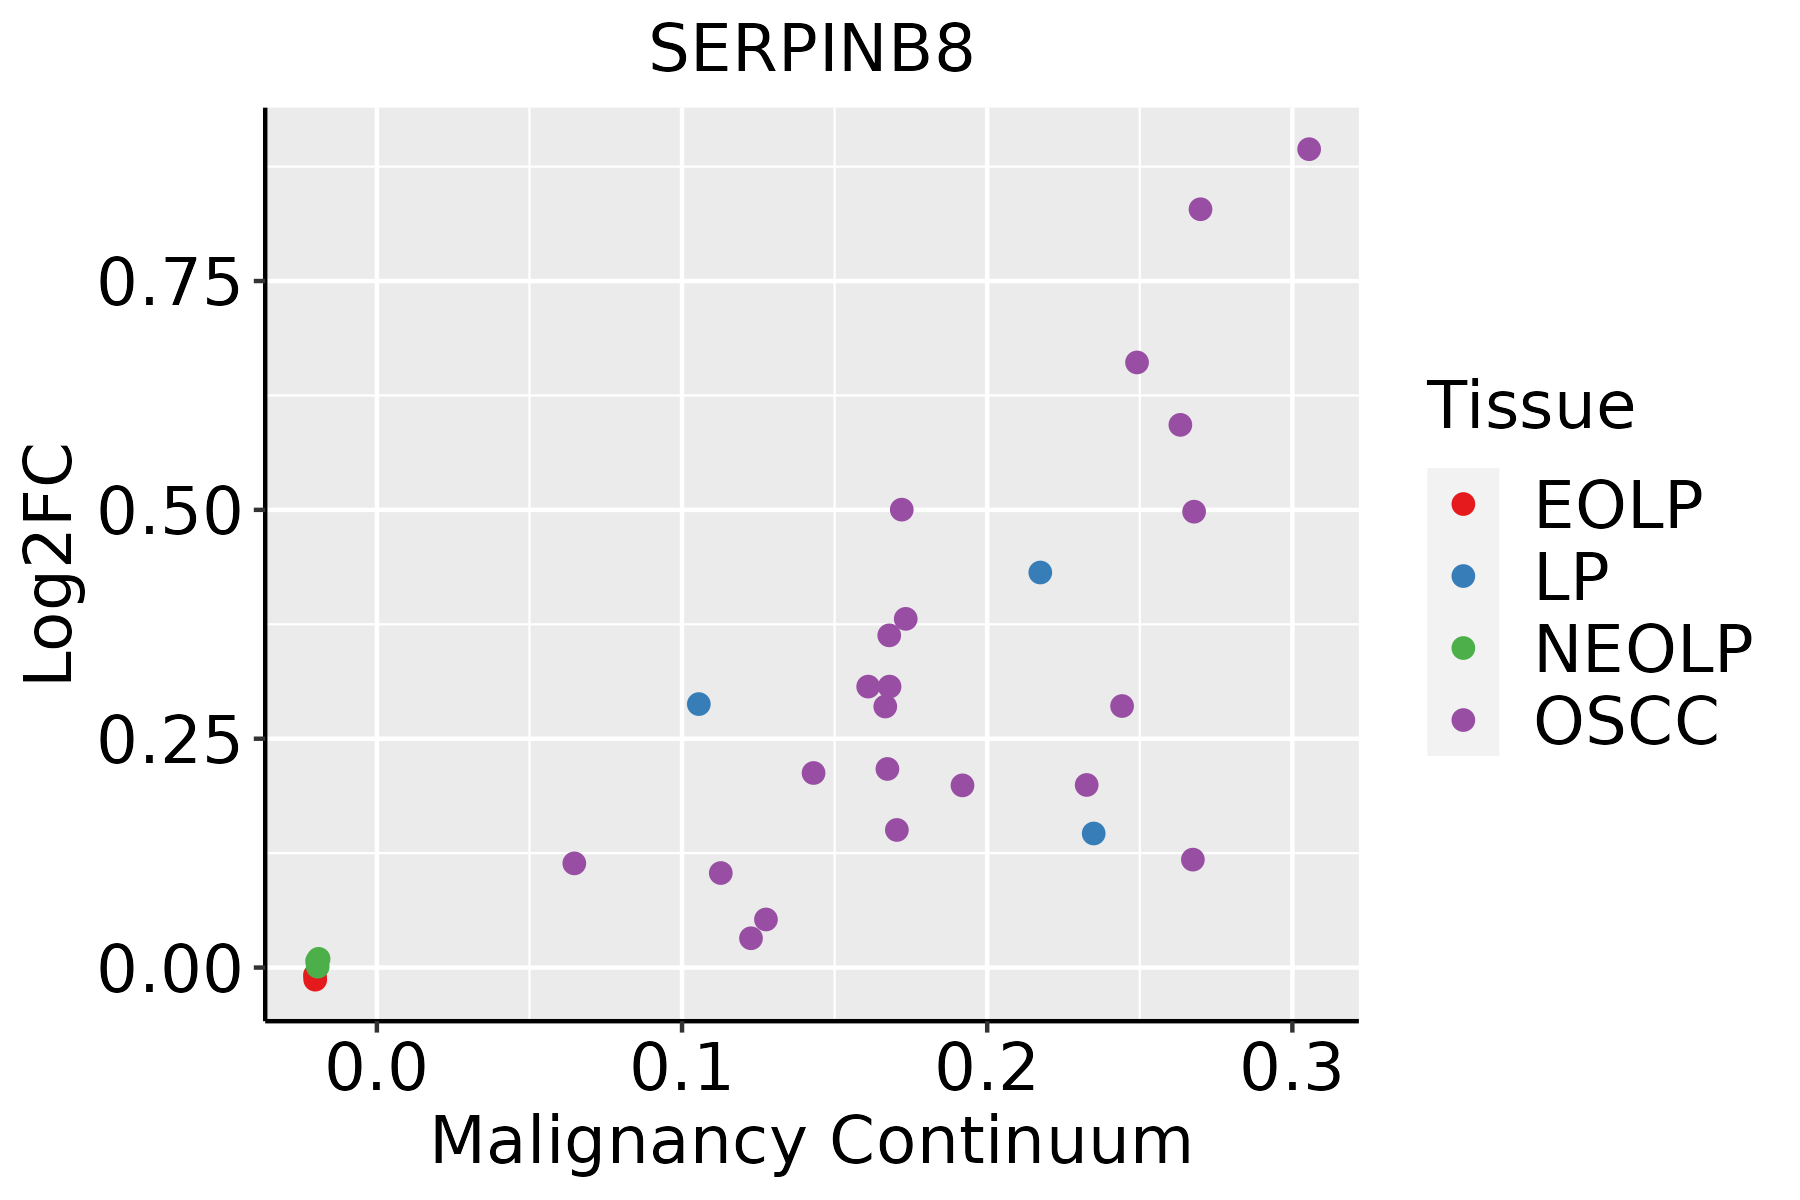 | EOLP: Erosive Oral lichen planus |
| LP: leukoplakia | ||
| NEOLP: Non-erosive oral lichen planus | ||
| OSCC: Oral squamous cell carcinoma |
| ∗log2FC in expression of this searched gene in stem-like cells from each diseased tissue sample relative to stem-like cells in normal samples in each tissue plotted against the malignancy continuum. Samples are colored based on if they are from different disease stage. |
Top |
Malignant transformation related pathway analysis |
| Find out the enriched GO biological processes and KEGG pathways involved in transition from healthy to precancer to cancer |
| Tissue | Disease Stage | Enriched GO biological Processes |
| Colorectum | AD |  |
| Colorectum | SER |  |
| Colorectum | MSS |  |
| Colorectum | MSI-H |  |
| Colorectum | FAP |  |
| ∗Top 15 enriched GO BP terms are showed in the bar plot of each disease state in each tissue. Each row represents a significant GO biological process which is colored according to the -log10(p.adjust). |
| Page: 1 2 3 4 5 6 7 8 9 |
| GO ID | Tissue | Disease Stage | Description | Gene Ratio | Bg Ratio | pvalue | p.adjust | Count |
| GO:005254720 | Oral cavity | OSCC | regulation of peptidase activity | 255/7305 | 461/18723 | 5.78e-13 | 2.75e-11 | 255 |
| GO:005254820 | Oral cavity | OSCC | regulation of endopeptidase activity | 235/7305 | 432/18723 | 4.35e-11 | 1.40e-09 | 235 |
| GO:004586120 | Oral cavity | OSCC | negative regulation of proteolysis | 181/7305 | 351/18723 | 1.01e-06 | 1.37e-05 | 181 |
| GO:005134618 | Oral cavity | OSCC | negative regulation of hydrolase activity | 182/7305 | 379/18723 | 1.98e-04 | 1.32e-03 | 182 |
| GO:001095117 | Oral cavity | OSCC | negative regulation of endopeptidase activity | 126/7305 | 252/18723 | 2.37e-04 | 1.54e-03 | 126 |
| GO:001046618 | Oral cavity | OSCC | negative regulation of peptidase activity | 130/7305 | 262/18723 | 2.89e-04 | 1.82e-03 | 130 |
| GO:0052547110 | Oral cavity | LP | regulation of peptidase activity | 177/4623 | 461/18723 | 3.01e-11 | 2.00e-09 | 177 |
| GO:0052548110 | Oral cavity | LP | regulation of endopeptidase activity | 164/4623 | 432/18723 | 4.33e-10 | 2.20e-08 | 164 |
| GO:0045861110 | Oral cavity | LP | negative regulation of proteolysis | 122/4623 | 351/18723 | 1.32e-05 | 2.34e-04 | 122 |
| GO:001046619 | Oral cavity | LP | negative regulation of peptidase activity | 87/4623 | 262/18723 | 1.12e-03 | 9.19e-03 | 87 |
| GO:005134619 | Oral cavity | LP | negative regulation of hydrolase activity | 120/4623 | 379/18723 | 1.16e-03 | 9.48e-03 | 120 |
| GO:001095118 | Oral cavity | LP | negative regulation of endopeptidase activity | 83/4623 | 252/18723 | 1.86e-03 | 1.39e-02 | 83 |
| Page: 1 |
| Pathway ID | Tissue | Disease Stage | Description | Gene Ratio | Bg Ratio | pvalue | p.adjust | qvalue | Count |
| Page: 1 |
Top |
Cell-cell communication analysis |
| Identification of potential cell-cell interactions between two cell types and their ligand-receptor pairs for different disease states |
| Ligand | Receptor | LRpair | Pathway | Tissue | Disease Stage |
| Page: 1 |
Top |
Single-cell gene regulatory network inference analysis |
| Find out the significant the regulons (TFs) and the target genes of each regulon across cell types for different disease states |
| TF | Cell Type | Tissue | Disease Stage | Target Gene | RSS | Regulon Activity |
| ∗The dot plots of a searched regulon are shown for all cell subpopulations in each disease state of each tissue based on the regulon specific score inferred using pySCENIC and by calculating the average expression. |
| Page: 1 |
Top |
Somatic mutation of malignant transformation related genes |
| Annotation of somatic variants for genes involved in malignant transformation |
| Hugo Symbol | Variant Class | Variant Classification | dbSNP RS | HGVSc | HGVSp | HGVSp Short | SWISSPROT | BIOTYPE | SIFT | PolyPhen | Tumor Sample Barcode | Tissue | Histology | Sex | Age | Stage | Therapy Types | Drugs | Outcome |
| SERPINB8 | SNV | Missense_Mutation | novel | c.1046N>A | p.Ala349Glu | p.A349E | P50452 | protein_coding | deleterious(0) | probably_damaging(0.991) | TCGA-AO-A03L-01 | Breast | breast invasive carcinoma | Female | <65 | III/IV | Chemotherapy | cyclophosphamide | SD |
| SERPINB8 | SNV | Missense_Mutation | c.448N>A | p.Ala150Thr | p.A150T | P50452 | protein_coding | tolerated(0.21) | benign(0.005) | TCGA-E2-A1L6-01 | Breast | breast invasive carcinoma | Female | <65 | I/II | Chemotherapy | cyclophosphamide | SD | |
| SERPINB8 | insertion | Frame_Shift_Ins | novel | c.1019_1020insTGTCAAAGGGATTTTTGTAAAAGAATGCTTATTTCCC | p.Ser341ValfsTer65 | p.S341Vfs*65 | P50452 | protein_coding | TCGA-A8-A07G-01 | Breast | breast invasive carcinoma | Female | >=65 | I/II | Chemotherapy | 5-fluorouracil | CR | ||
| SERPINB8 | insertion | Frame_Shift_Ins | novel | c.884_885insATATGACCCAGATCTAAAATGCTATTTCCTTCTTTGCAGTT | p.Lys296TyrfsTer124 | p.K296Yfs*124 | P50452 | protein_coding | TCGA-A8-A0A7-01 | Breast | breast invasive carcinoma | Female | <65 | I/II | Unknown | Unknown | SD | ||
| SERPINB8 | insertion | In_Frame_Ins | novel | c.1087_1088insTTT | p.Asn363delinsIleTyr | p.N363delinsIY | P50452 | protein_coding | TCGA-AR-A0U0-01 | Breast | breast invasive carcinoma | Female | >=65 | I/II | Unknown | Unknown | SD | ||
| SERPINB8 | SNV | Missense_Mutation | novel | c.200A>C | p.His67Pro | p.H67P | P50452 | protein_coding | deleterious(0) | probably_damaging(0.99) | TCGA-FU-A3HZ-01 | Cervix | cervical & endocervical cancer | Female | <65 | I/II | Chemotherapy | cisplatin | CR |
| SERPINB8 | SNV | Missense_Mutation | novel | c.367G>A | p.Glu123Lys | p.E123K | P50452 | protein_coding | tolerated(1) | benign(0.003) | TCGA-JW-A5VL-01 | Cervix | cervical & endocervical cancer | Female | <65 | I/II | Unknown | Unknown | SD |
| SERPINB8 | SNV | Missense_Mutation | rs549578248 | c.460G>A | p.Asp154Asn | p.D154N | P50452 | protein_coding | tolerated(0.57) | benign(0.003) | TCGA-VS-A9V3-01 | Cervix | cervical & endocervical cancer | Female | <65 | I/II | Chemotherapy | cisplatin | PD |
| SERPINB8 | SNV | Missense_Mutation | rs750331210 | c.883N>A | p.Ala295Thr | p.A295T | P50452 | protein_coding | tolerated(0.18) | benign(0.014) | TCGA-A6-5665-01 | Colorectum | colon adenocarcinoma | Female | >=65 | I/II | Unknown | Unknown | PD |
| SERPINB8 | SNV | Missense_Mutation | c.981N>T | p.Glu327Asp | p.E327D | P50452 | protein_coding | deleterious(0) | probably_damaging(0.986) | TCGA-A6-6781-01 | Colorectum | colon adenocarcinoma | Male | <65 | III/IV | Chemotherapy | oxaliplatin | SD |
| Page: 1 2 3 4 5 6 7 |
Top |
Related drugs of malignant transformation related genes |
| Identification of chemicals and drugs interact with genes involved in malignant transfromation |
| (DGIdb 4.0) |
| Entrez ID | Symbol | Category | Interaction Types | Drug Claim Name | Drug Name | PMIDs |
| Page: 1 |

Copyright 2023-Present -The University of Texas Health Science Center at Houston |