
|
|||||
|
 | |
| |
| |
| |
| |
| |
|
Gene: SERPINB6 |
Gene summary for SERPINB6 |
| Gene information | Species | Human | Gene symbol | SERPINB6 | Gene ID | 5269 |
| Gene name | serpin family B member 6 | |
| Gene Alias | CAP | |
| Cytomap | 6p25.2 | |
| Gene Type | protein-coding | GO ID | GO:0003008 | UniProtAcc | A0A024QZX5 |
Top |
Malignant transformation analysis |
| Identification of the aberrant gene expression in precancerous and cancerous lesions by comparing the gene expression of stem-like cells in diseased tissues with normal stem cells |
| Entrez ID | Symbol | Replicates | Species | Organ | Tissue | Adj P-value | Log2FC | Malignancy |
| 5269 | SERPINB6 | HTA11_3410_2000001011 | Human | Colorectum | AD | 3.94e-02 | 1.69e-01 | 0.0155 |
| 5269 | SERPINB6 | HTA11_2487_2000001011 | Human | Colorectum | SER | 1.10e-09 | 9.10e-01 | -0.1808 |
| 5269 | SERPINB6 | HTA11_1938_2000001011 | Human | Colorectum | AD | 4.80e-18 | 8.99e-01 | -0.0811 |
| 5269 | SERPINB6 | HTA11_78_2000001011 | Human | Colorectum | AD | 4.71e-08 | 5.50e-01 | -0.1088 |
| 5269 | SERPINB6 | HTA11_347_2000001011 | Human | Colorectum | AD | 5.95e-10 | 5.20e-01 | -0.1954 |
| 5269 | SERPINB6 | HTA11_411_2000001011 | Human | Colorectum | SER | 1.91e-04 | 1.31e+00 | -0.2602 |
| 5269 | SERPINB6 | HTA11_2112_2000001011 | Human | Colorectum | SER | 1.10e-02 | 7.51e-01 | -0.2196 |
| 5269 | SERPINB6 | HTA11_83_2000001011 | Human | Colorectum | SER | 1.56e-03 | 5.01e-01 | -0.1526 |
| 5269 | SERPINB6 | HTA11_696_2000001011 | Human | Colorectum | AD | 1.92e-17 | 7.43e-01 | -0.1464 |
| 5269 | SERPINB6 | HTA11_1391_2000001011 | Human | Colorectum | AD | 2.44e-26 | 1.14e+00 | -0.059 |
| 5269 | SERPINB6 | HTA11_99999965062_69753 | Human | Colorectum | MSI-H | 2.58e-03 | 9.29e-01 | 0.3487 |
| 5269 | SERPINB6 | HTA11_99999965104_69814 | Human | Colorectum | MSS | 8.62e-12 | 8.20e-01 | 0.281 |
| 5269 | SERPINB6 | HTA11_99999971662_82457 | Human | Colorectum | MSS | 4.09e-06 | 5.78e-01 | 0.3859 |
| 5269 | SERPINB6 | A015-C-203 | Human | Colorectum | FAP | 9.14e-08 | -2.14e-01 | -0.1294 |
| 5269 | SERPINB6 | A001-C-119 | Human | Colorectum | FAP | 3.52e-02 | -2.54e-01 | -0.1557 |
| 5269 | SERPINB6 | A002-C-205 | Human | Colorectum | FAP | 4.53e-06 | -6.93e-02 | -0.1236 |
| 5269 | SERPINB6 | A015-C-006 | Human | Colorectum | FAP | 9.22e-04 | 3.21e-02 | -0.0994 |
| 5269 | SERPINB6 | A015-C-106 | Human | Colorectum | FAP | 1.21e-03 | -1.56e-01 | -0.0511 |
| 5269 | SERPINB6 | A002-C-114 | Human | Colorectum | FAP | 8.25e-05 | -1.66e-01 | -0.1561 |
| 5269 | SERPINB6 | A015-C-104 | Human | Colorectum | FAP | 3.92e-10 | -2.00e-01 | -0.1899 |
| Page: 1 2 3 4 5 6 7 8 9 |
| Tissue | Expression Dynamics | Abbreviation |
| Colorectum (GSE201348) |  | FAP: Familial adenomatous polyposis |
| CRC: Colorectal cancer | ||
| Colorectum (HTA11) | 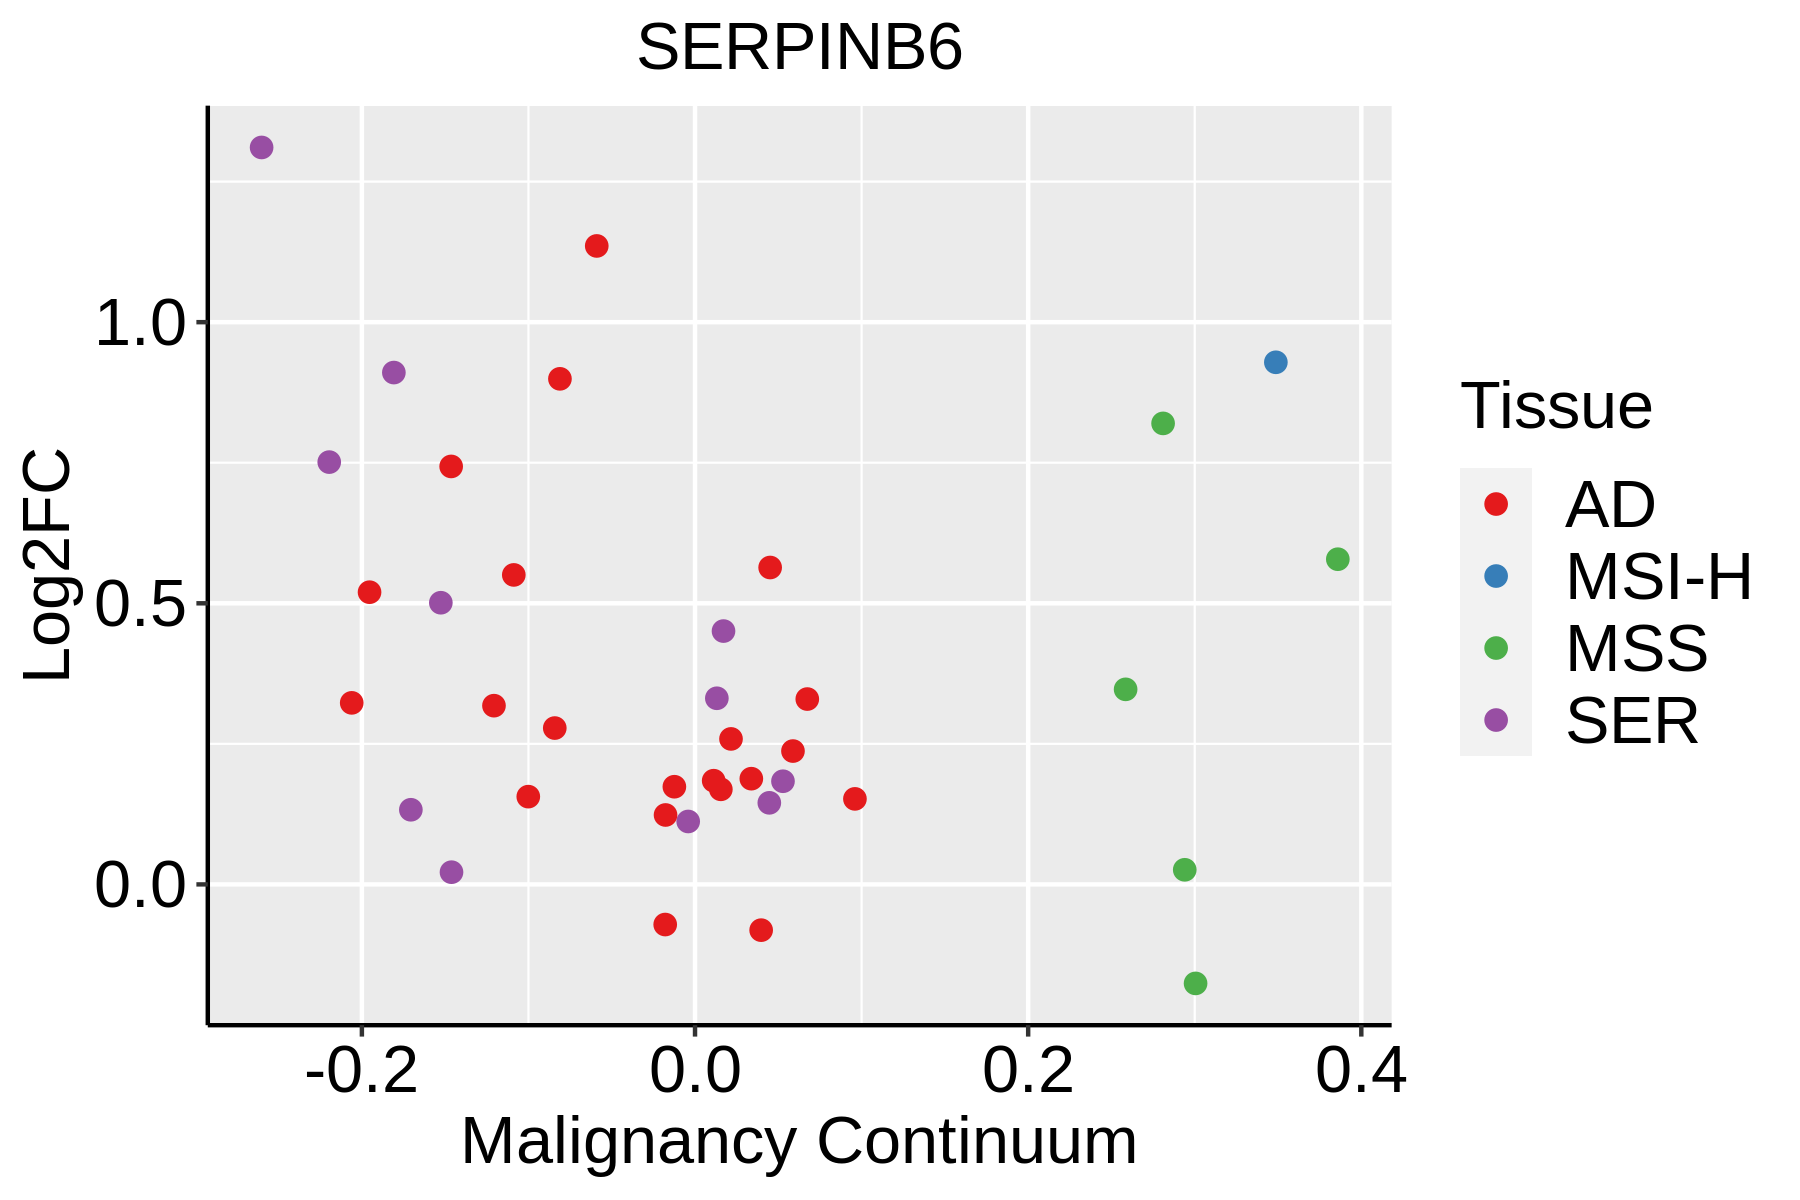 | AD: Adenomas |
| SER: Sessile serrated lesions | ||
| MSI-H: Microsatellite-high colorectal cancer | ||
| MSS: Microsatellite stable colorectal cancer | ||
| Esophagus | 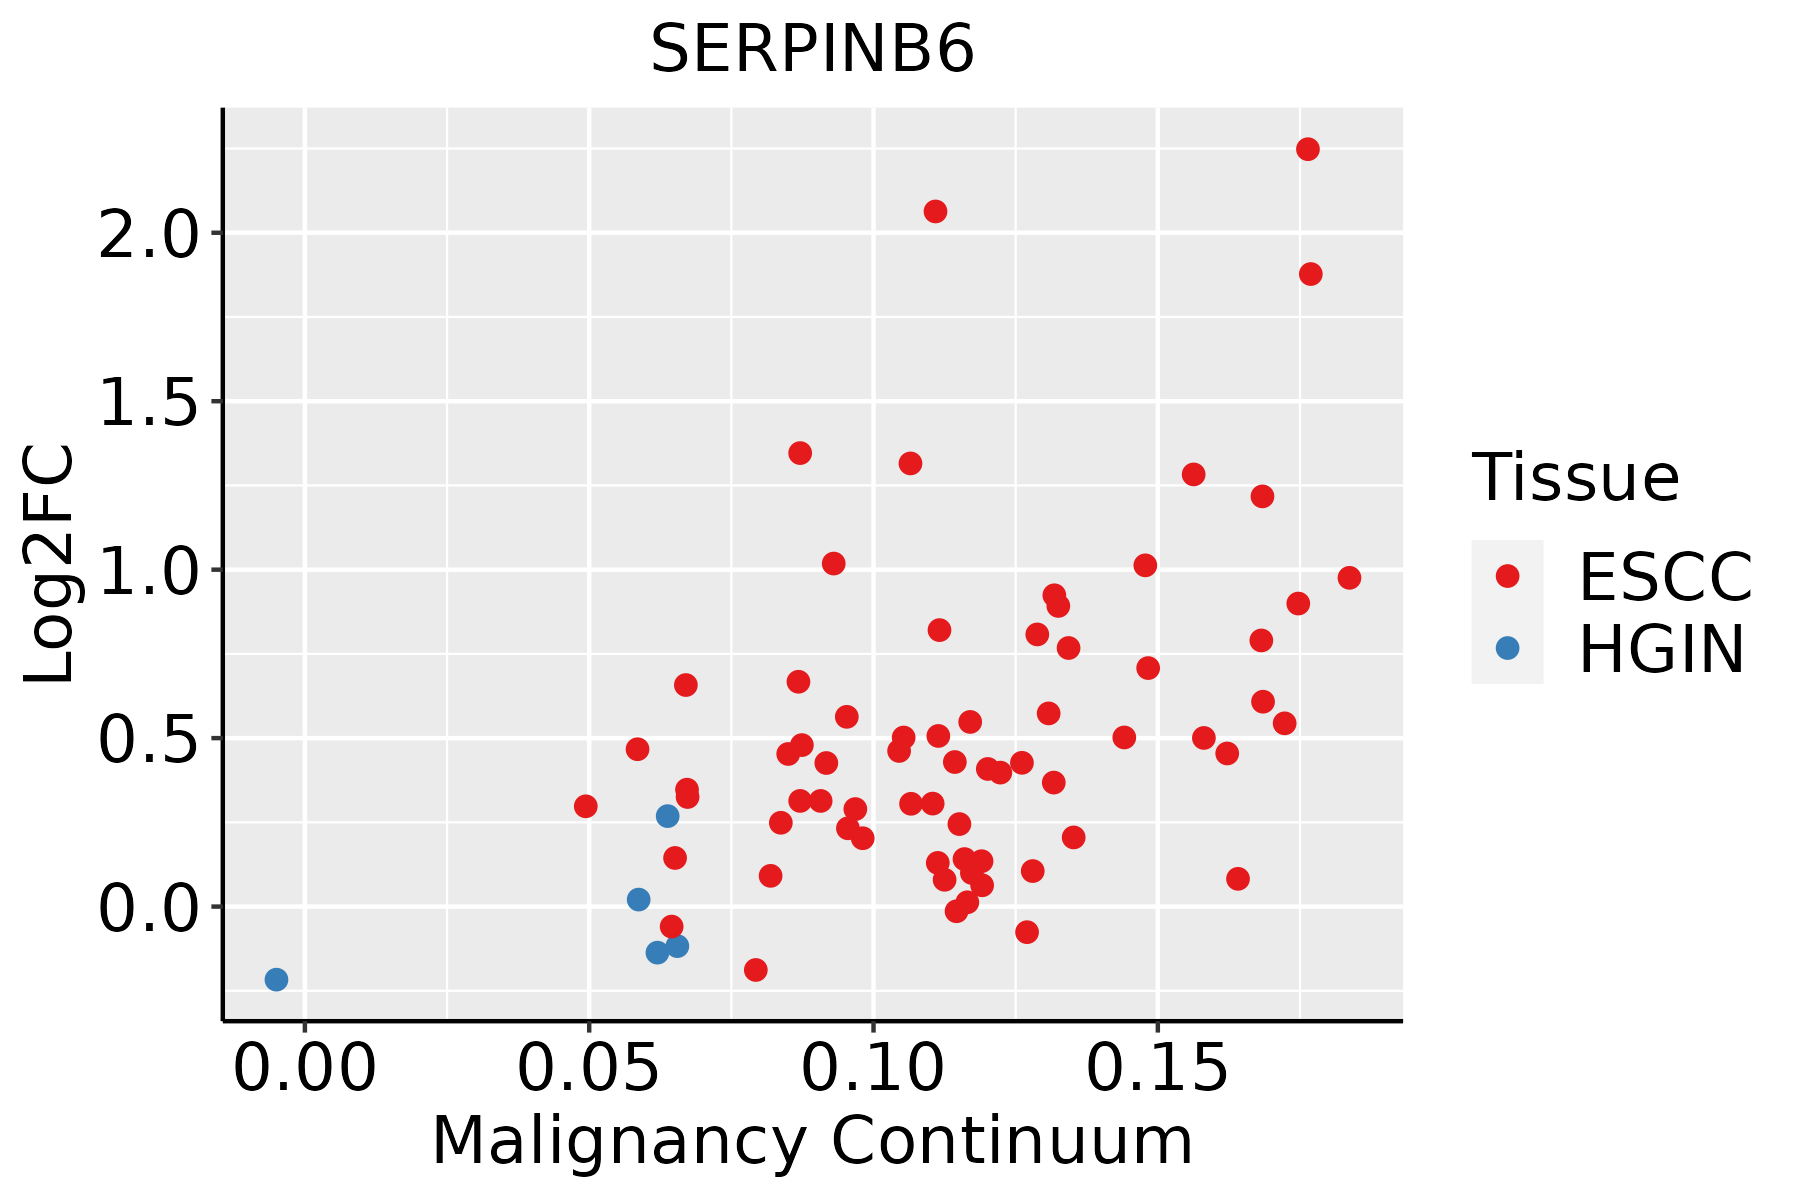 | ESCC: Esophageal squamous cell carcinoma |
| HGIN: High-grade intraepithelial neoplasias | ||
| LGIN: Low-grade intraepithelial neoplasias | ||
| GC |  | CAG: Chronic atrophic gastritis |
| CAG with IM: Chronic atrophic gastritis with intestinal metaplasia | ||
| CSG: Chronic superficial gastritis | ||
| GC: Gastric cancer | ||
| SIM: Severe intestinal metaplasia | ||
| WIM: Wild intestinal metaplasia | ||
| Liver | 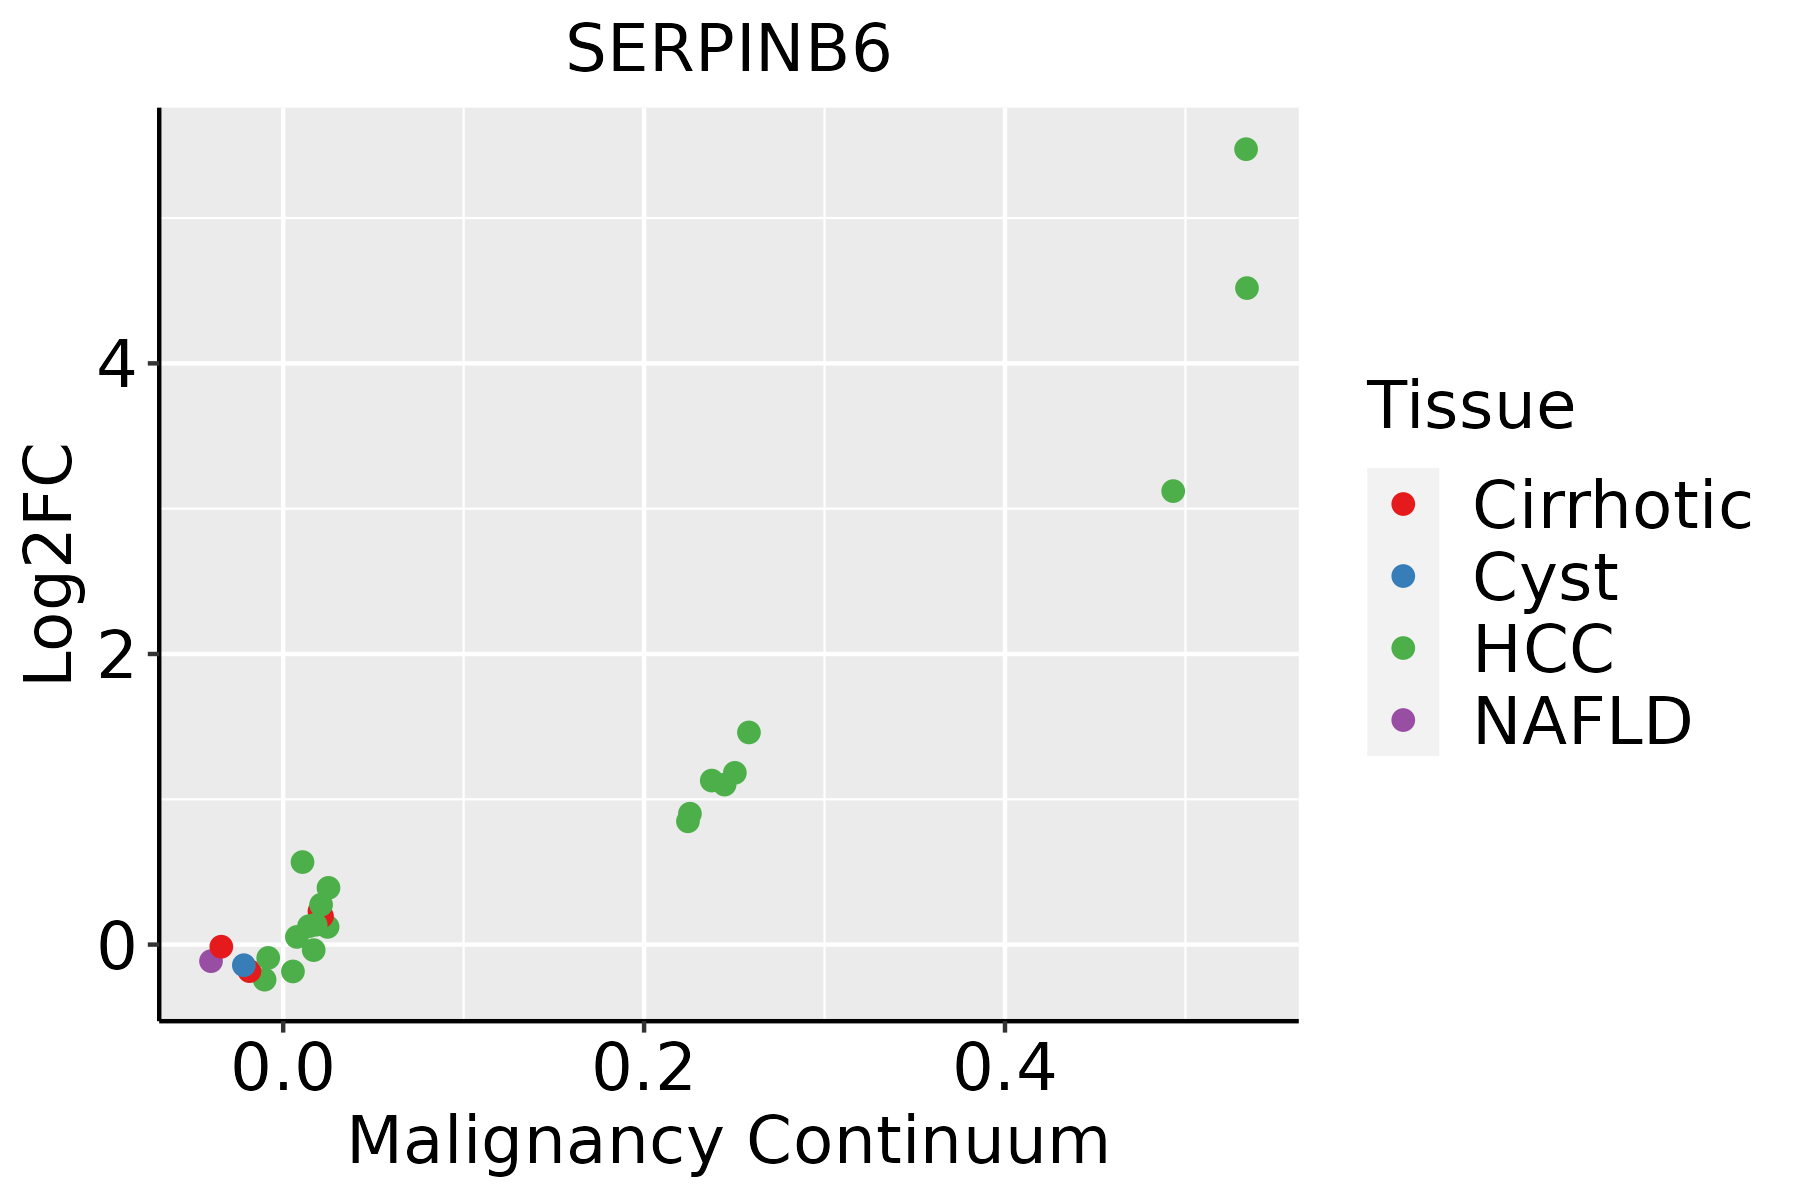 | HCC: Hepatocellular carcinoma |
| NAFLD: Non-alcoholic fatty liver disease | ||
| Oral Cavity |  | EOLP: Erosive Oral lichen planus |
| LP: leukoplakia | ||
| NEOLP: Non-erosive oral lichen planus | ||
| OSCC: Oral squamous cell carcinoma | ||
| Prostate |  | BPH: Benign Prostatic Hyperplasia |
| Skin | 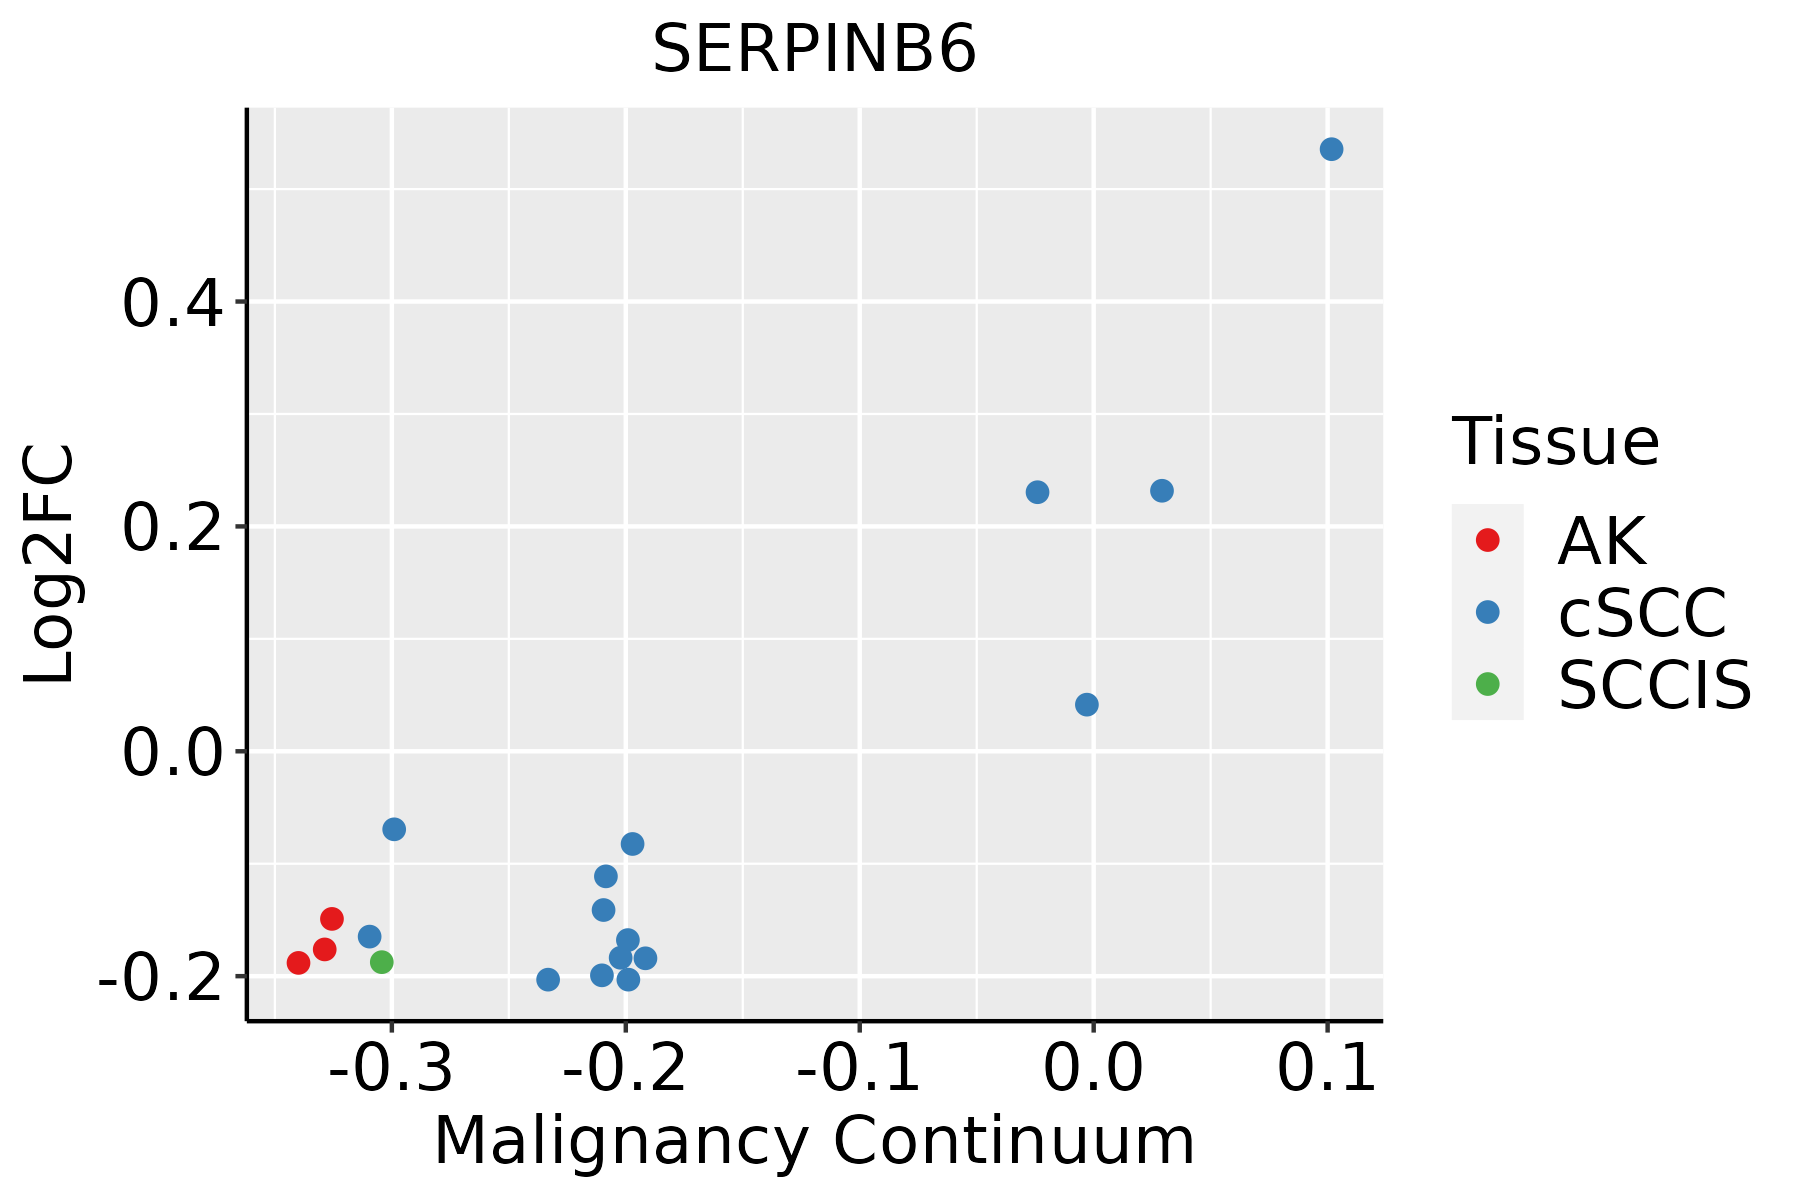 | AK: Actinic keratosis |
| cSCC: Cutaneous squamous cell carcinoma | ||
| SCCIS:squamous cell carcinoma in situ | ||
| Thyroid | 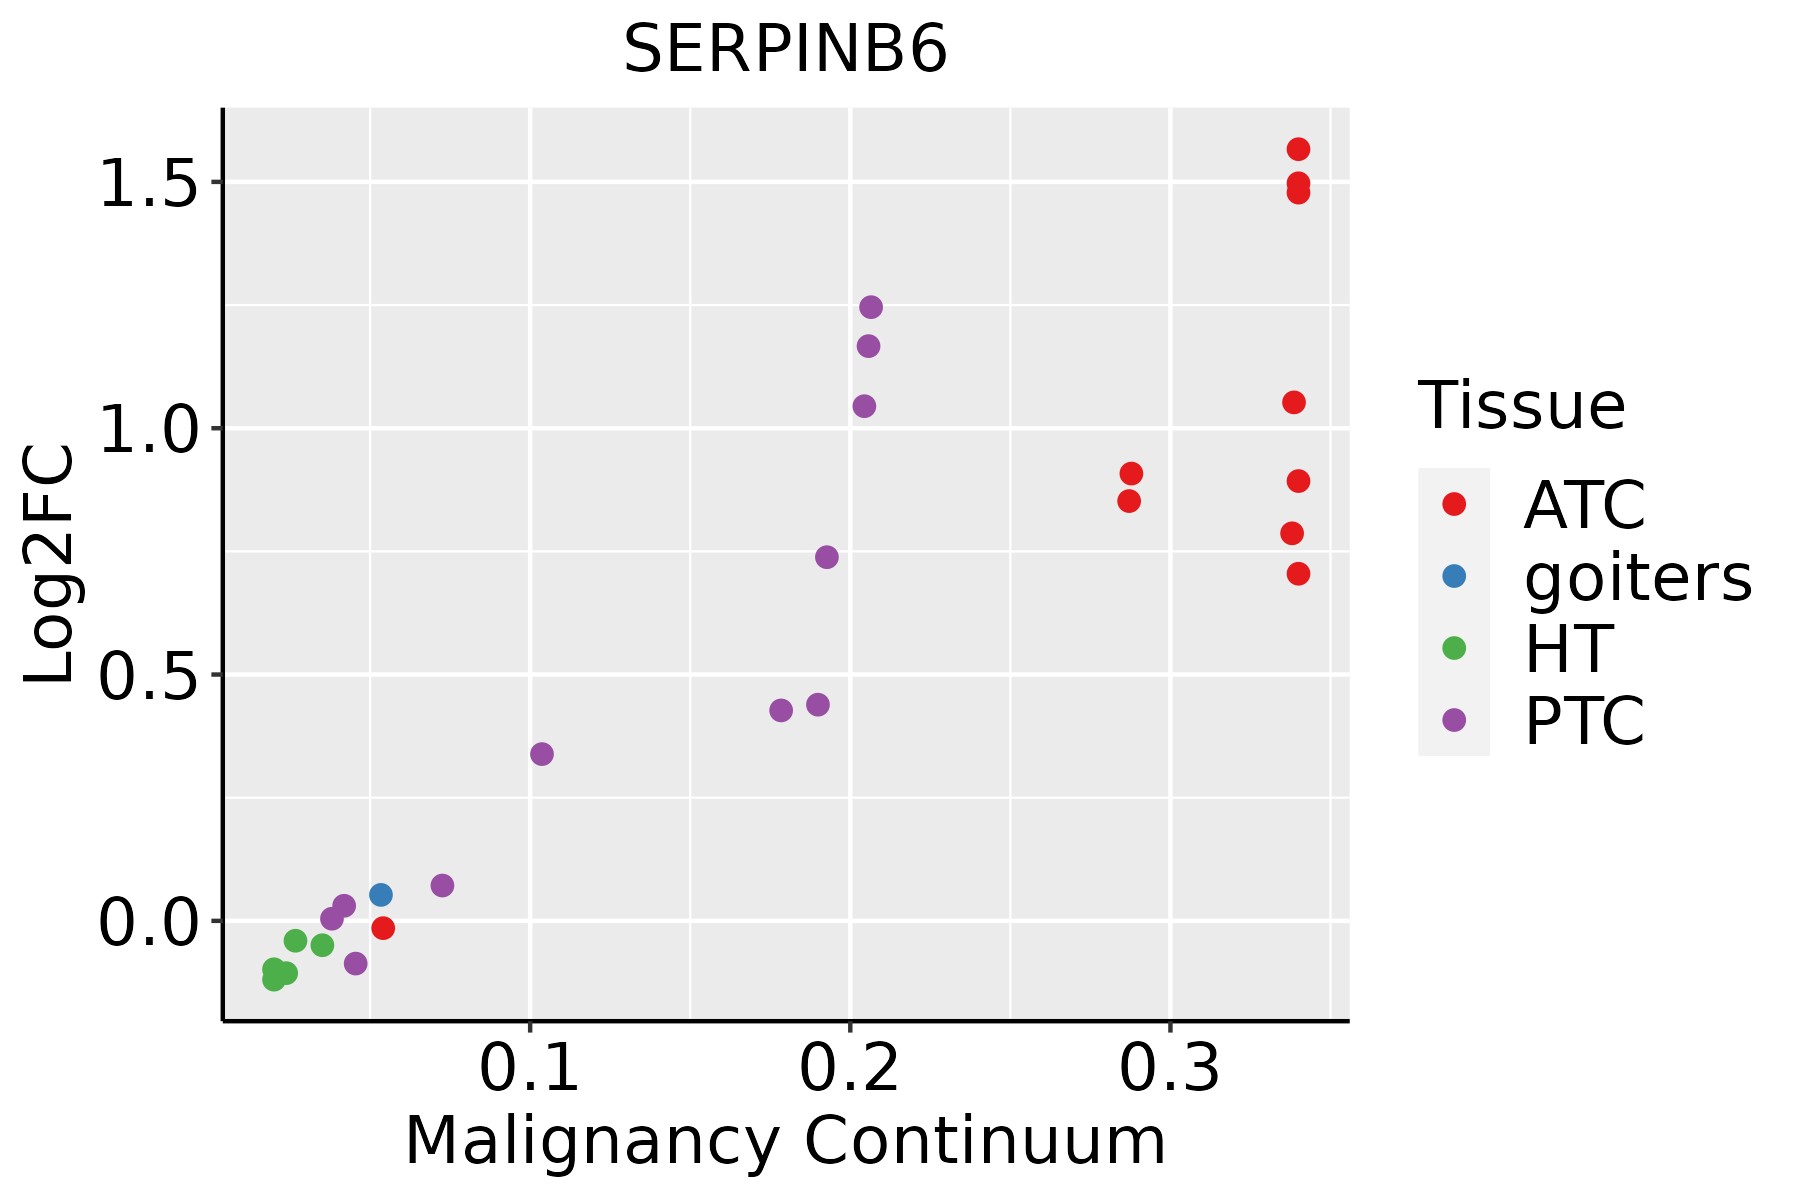 | ATC: Anaplastic thyroid cancer |
| HT: Hashimoto's thyroiditis | ||
| PTC: Papillary thyroid cancer |
| ∗log2FC in expression of this searched gene in stem-like cells from each diseased tissue sample relative to stem-like cells in normal samples in each tissue plotted against the malignancy continuum. Samples are colored based on if they are from different disease stage. |
Top |
Malignant transformation related pathway analysis |
| Find out the enriched GO biological processes and KEGG pathways involved in transition from healthy to precancer to cancer |
| Tissue | Disease Stage | Enriched GO biological Processes |
| Colorectum | AD |  |
| Colorectum | SER |  |
| Colorectum | MSS |  |
| Colorectum | MSI-H |  |
| Colorectum | FAP |  |
| ∗Top 15 enriched GO BP terms are showed in the bar plot of each disease state in each tissue. Each row represents a significant GO biological process which is colored according to the -log10(p.adjust). |
| Page: 1 2 3 4 5 6 7 8 9 |
| GO ID | Tissue | Disease Stage | Description | Gene Ratio | Bg Ratio | pvalue | p.adjust | Count |
| GO:0062197 | Colorectum | AD | cellular response to chemical stress | 109/3918 | 337/18723 | 5.33e-07 | 1.95e-05 | 109 |
| GO:0052547 | Colorectum | AD | regulation of peptidase activity | 137/3918 | 461/18723 | 4.12e-06 | 1.12e-04 | 137 |
| GO:0045861 | Colorectum | AD | negative regulation of proteolysis | 106/3918 | 351/18723 | 2.33e-05 | 4.57e-04 | 106 |
| GO:0052548 | Colorectum | AD | regulation of endopeptidase activity | 124/3918 | 432/18723 | 6.58e-05 | 1.07e-03 | 124 |
| GO:00525471 | Colorectum | SER | regulation of peptidase activity | 114/2897 | 461/18723 | 1.18e-07 | 7.17e-06 | 114 |
| GO:00621971 | Colorectum | SER | cellular response to chemical stress | 87/2897 | 337/18723 | 5.33e-07 | 2.59e-05 | 87 |
| GO:00458611 | Colorectum | SER | negative regulation of proteolysis | 88/2897 | 351/18723 | 1.74e-06 | 7.50e-05 | 88 |
| GO:00525481 | Colorectum | SER | regulation of endopeptidase activity | 103/2897 | 432/18723 | 2.86e-06 | 1.16e-04 | 103 |
| GO:0051346 | Colorectum | SER | negative regulation of hydrolase activity | 82/2897 | 379/18723 | 8.19e-04 | 1.01e-02 | 82 |
| GO:0006970 | Colorectum | SER | response to osmotic stress | 23/2897 | 84/18723 | 3.61e-03 | 3.03e-02 | 23 |
| GO:0010466 | Colorectum | SER | negative regulation of peptidase activity | 57/2897 | 262/18723 | 4.15e-03 | 3.38e-02 | 57 |
| GO:00621972 | Colorectum | MSS | cellular response to chemical stress | 102/3467 | 337/18723 | 9.73e-08 | 4.71e-06 | 102 |
| GO:00525472 | Colorectum | MSS | regulation of peptidase activity | 130/3467 | 461/18723 | 1.81e-07 | 8.13e-06 | 130 |
| GO:00525482 | Colorectum | MSS | regulation of endopeptidase activity | 117/3467 | 432/18723 | 6.25e-06 | 1.65e-04 | 117 |
| GO:00458612 | Colorectum | MSS | negative regulation of proteolysis | 97/3467 | 351/18723 | 1.57e-05 | 3.54e-04 | 97 |
| GO:00513461 | Colorectum | MSS | negative regulation of hydrolase activity | 92/3467 | 379/18723 | 2.85e-03 | 2.22e-02 | 92 |
| GO:00458613 | Colorectum | MSI-H | negative regulation of proteolysis | 55/1319 | 351/18723 | 1.75e-08 | 1.98e-06 | 55 |
| GO:00525473 | Colorectum | MSI-H | regulation of peptidase activity | 66/1319 | 461/18723 | 2.63e-08 | 2.81e-06 | 66 |
| GO:00621973 | Colorectum | MSI-H | cellular response to chemical stress | 51/1319 | 337/18723 | 1.78e-07 | 1.52e-05 | 51 |
| GO:00525483 | Colorectum | MSI-H | regulation of endopeptidase activity | 60/1319 | 432/18723 | 3.29e-07 | 2.57e-05 | 60 |
| Page: 1 2 3 4 5 6 7 8 9 |
| Pathway ID | Tissue | Disease Stage | Description | Gene Ratio | Bg Ratio | pvalue | p.adjust | qvalue | Count |
| hsa051468 | Oral cavity | OSCC | Amoebiasis | 59/3704 | 102/8465 | 2.78e-03 | 7.17e-03 | 3.65e-03 | 59 |
| hsa0514615 | Oral cavity | OSCC | Amoebiasis | 59/3704 | 102/8465 | 2.78e-03 | 7.17e-03 | 3.65e-03 | 59 |
| hsa051467 | Prostate | BPH | Amoebiasis | 33/1718 | 102/8465 | 2.70e-03 | 1.05e-02 | 6.49e-03 | 33 |
| hsa0514614 | Prostate | BPH | Amoebiasis | 33/1718 | 102/8465 | 2.70e-03 | 1.05e-02 | 6.49e-03 | 33 |
| Page: 1 |
Top |
Cell-cell communication analysis |
| Identification of potential cell-cell interactions between two cell types and their ligand-receptor pairs for different disease states |
| Ligand | Receptor | LRpair | Pathway | Tissue | Disease Stage |
| Page: 1 |
Top |
Single-cell gene regulatory network inference analysis |
| Find out the significant the regulons (TFs) and the target genes of each regulon across cell types for different disease states |
| TF | Cell Type | Tissue | Disease Stage | Target Gene | RSS | Regulon Activity |
| ∗The dot plots of a searched regulon are shown for all cell subpopulations in each disease state of each tissue based on the regulon specific score inferred using pySCENIC and by calculating the average expression. |
| Page: 1 |
Top |
Somatic mutation of malignant transformation related genes |
| Annotation of somatic variants for genes involved in malignant transformation |
| Hugo Symbol | Variant Class | Variant Classification | dbSNP RS | HGVSc | HGVSp | HGVSp Short | SWISSPROT | BIOTYPE | SIFT | PolyPhen | Tumor Sample Barcode | Tissue | Histology | Sex | Age | Stage | Therapy Types | Drugs | Outcome |
| SERPINB6 | insertion | Frame_Shift_Ins | novel | c.325_326insGTTCGAGATCAGCC | p.Met109SerfsTer43 | p.M109Sfs*43 | protein_coding | TCGA-BH-A0AY-01 | Breast | breast invasive carcinoma | Female | <65 | I/II | Chemotherapy | SD | ||||
| SERPINB6 | SNV | Missense_Mutation | c.346G>A | p.Glu116Lys | p.E116K | protein_coding | deleterious(0) | probably_damaging(0.994) | TCGA-C5-A1BF-01 | Cervix | cervical & endocervical cancer | Female | <65 | I/II | Chemotherapy | cisplatin | PD | ||
| SERPINB6 | SNV | Missense_Mutation | c.396N>G | p.Phe132Leu | p.F132L | protein_coding | tolerated(0.18) | benign(0.065) | TCGA-C5-A1MH-01 | Cervix | cervical & endocervical cancer | Female | >=65 | III/IV | Chemotherapy | cisplatin | PD | ||
| SERPINB6 | SNV | Missense_Mutation | novel | c.241A>G | p.Ser81Gly | p.S81G | protein_coding | tolerated(0.3) | benign(0.283) | TCGA-A6-5660-01 | Colorectum | colon adenocarcinoma | Male | >=65 | III/IV | Ancillary | leucovorin | SD | |
| SERPINB6 | SNV | Missense_Mutation | rs762701058 | c.1168N>A | p.Gly390Ser | p.G390S | protein_coding | deleterious(0) | probably_damaging(0.994) | TCGA-AA-3966-01 | Colorectum | colon adenocarcinoma | Female | >=65 | I/II | Unknown | Unknown | SD | |
| SERPINB6 | SNV | Missense_Mutation | rs769858532 | c.766N>A | p.Glu256Lys | p.E256K | protein_coding | tolerated(0.07) | benign(0.13) | TCGA-AD-5900-01 | Colorectum | colon adenocarcinoma | Male | >=65 | I/II | Unknown | Unknown | SD | |
| SERPINB6 | SNV | Missense_Mutation | rs368785463 | c.433N>A | p.Ala145Thr | p.A145T | protein_coding | tolerated(0.05) | benign(0.189) | TCGA-AG-A002-01 | Colorectum | rectum adenocarcinoma | Male | <65 | I/II | Unknown | Unknown | SD | |
| SERPINB6 | SNV | Missense_Mutation | novel | c.243T>G | p.Ser81Arg | p.S81R | protein_coding | tolerated(0.35) | benign(0.046) | TCGA-AG-A014-01 | Colorectum | rectum adenocarcinoma | Male | >=65 | I/II | Unknown | Unknown | SD | |
| SERPINB6 | SNV | Missense_Mutation | rs752907413 | c.943N>A | p.Glu315Lys | p.E315K | protein_coding | deleterious(0.05) | possibly_damaging(0.469) | TCGA-A5-A1OF-01 | Endometrium | uterine corpus endometrioid carcinoma | Female | <65 | I/II | Unknown | Unknown | SD | |
| SERPINB6 | SNV | Missense_Mutation | novel | c.134A>C | p.Asn45Thr | p.N45T | protein_coding | deleterious(0) | probably_damaging(0.996) | TCGA-AJ-A3EK-01 | Endometrium | uterine corpus endometrioid carcinoma | Female | <65 | I/II | Chemotherapy | carboplatin | CR |
| Page: 1 2 3 4 |
Top |
Related drugs of malignant transformation related genes |
| Identification of chemicals and drugs interact with genes involved in malignant transfromation |
| (DGIdb 4.0) |
| Entrez ID | Symbol | Category | Interaction Types | Drug Claim Name | Drug Name | PMIDs |
| Page: 1 |

Copyright 2023-Present -The University of Texas Health Science Center at Houston |